The German Credit data provides variables that help classify observations as good credit vs bad credit. Multiple algorithms such as Logistic Regression, Classification tree, GAM, Neural Net and Linear Discriminant Analysis were used to compare the classification power of the models built.
Top profile Call Girls In dimapur [ 7014168258 ] Call Me For Genuine Models W...
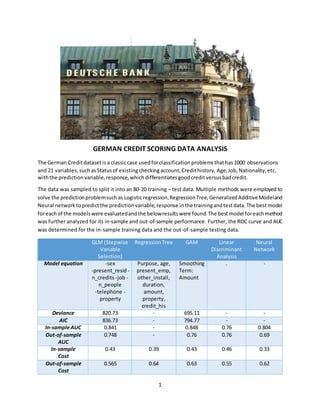
German credit data analysis
1. 1
GERMAN CREDIT SCORING DATA ANALYSIS
The German Creditdatasetisa classiccase usedforclassificationproblemsthathas1000 observations
and 21 variables,suchas Statusof existingcheckingaccount,Credithistory, Age,Job,Nationality,etc.
withthe predictionvariable,response,whichdifferentiatesgoodcreditversusbadcredit.
The data was sampled to split it into an 80-20 training – test data. Multiple methods were employed to
solve the predictionproblemsuchas Logisticregression,RegressionTree,GeneralizedAdditiveModeland
Neural networktopredictthe predictionvariable,response inthe trainingandtestdata.The bestmodel
foreachof the modelswere evaluatedandthe belowresultswere found.The bestmodel foreachmethod
was further analyzed for its in-sample and out-of-sample performance. Further, the ROC curve and AUC
was determined for the in-sample training data and the out-of-sample testing data.
GLM (Stepwise
Variable
Selection)
RegressionTree GAM Linear
Discriminant
Analysis
Neural
Network
Model equation -sex
-present_resid -
n_credits -job -
n_people
-telephone -
property
Purpose, age,
present_emp,
other_install,
duration,
amount,
property,
credit_his
Smoothing
Term:
Amount
. -
Deviance 820.73 - 695.11 - -
AIC 836.73 - 794.77 - -
In-sample AUC 0.841 - 0.848 0.76 0.804
Out-of-sample
AUC
0.748 - 0.76 0.76 0.69
In-sample
Cost
0.43 0.39 0.43 0.46 0.33
Out-of-sample
Cost
0.565 0.64 0.63 0.55 0.62
2. 2
GERMAN CREDIT SCORING DATA
BACKGROUND:
The GermanCreditdatasetisaclassiccase thatcanbe usedtoforclassificationproblems.Itwascollected
by the Prof.Hofmann in1994. The original file waseditedmultiple timesandseveral indicatorvariables
were addedtomake it suitable foralgorithmswhichcannotcope withcategorical variables. The dataset
classifies customers as good or bad credit risks based on a set of attributes.
ABOUT THE DATA:
The dataset contains 1000 observations and 21 variables, such as Status of existing checking account,
Credithistory, Age,Job,Nationality,etc. The data was furthersampledtosplitit into an 80-20 training–
test data using a seed value of 12420360.
MODEL SELECTION:
An asymmetriccostfunctionwasdefinedwithacut-off probabilityof 1/6. Essentially,the False
Negatives (actual 1butpredict0) were givenaweightof 5, while the False Positives (actual 1but predict
0) were givenaweightof 1.
1. GENERALIZED LOGISTIC REGRESSION:
I) Full Model:
For the full model,the responsevariable, responsewasmodeledagainstall the 20 explanatory
variables.The devianceof the full model wasfoundtobe 697.47 and the AIC 795.47.
Many of the variables were foundtobe significant,hencerequiringvariable selectionmethods.
Deviance AIC BIC
697.47 795.47 1025.02
II) Variable Selection (using AIC and BIC):
Employingstepwise variable selectionmethodstoidentifythe bestmodel topredict response,step-wise
variable selection inbothdirections wasused.The nullmodelwasbuiltwithaconstantandthe full model
was built with all variables. AIC and BIC were both explored as the criterion for the variable selection
method.
Using AIC:
The final model obtained as a result of Step-wise AIC had the below formula.
Final Model: response ~chk_acct + duration+ credit_his+purpose + amount + saving_acct+
present_emp+installment_rate +other_debtor+age + other_install +housing+
foreign
Deviance AIC BIC
708.72 780.72 949.37
3. 3
Using BIC:
The final model obtained as a result of Step-wise BIC generated a much simpler model with only 4
predictor variables.
Final Model: response ~chk_acct + duration+ age + other_install
Deviance AIC BIC
820.73 836.73 874.20
From the resultsof the step function,the bestmodel wasdeterminedusingAICcriterion withthe lowest
AIC value of 780.72.
Choosingthe stepwiseAICmodel asthe final model,predictionof the response variable wasdone to
calculate the in-sampleandout-of-sample error.Further, the ROCplotwasdrawn,andAUC was
calculatedforbothin-sample andout-of-sample.
Deviance AIC BIC
708.72 780.72 949.37
Fig 4. ROC plots for the Final Logistic Regression Model
In - sample Out – of – sample
MCR Cost AUC MCR Cost AUC
0.32 0.43 0.841 0.365 0.565 0.748
2. CLASSIFICATION TREE:
The CART technique separatesthe datasetintobinsbyprogressivelyaddingvariable-valuecombinations
to the sequence,ensuringthatat each stepthe splitincreasesthe homogeneityof the resultingsubsets
of observations.All 800 observationsinthe trainingdatasetwere fedintothe classification tree andthe
below tree was observed.
4. 4
Fig 4. Classification Tree
Calculatingthe AsymmetricMisclassificationcostandthe misclassificationrate forthe Classificationtree
for the in-sample andout-of-sampledatageneratedthe followingresults.
In-sample Out-of-sample
MCR Cost MCR Cost
0.32 0.39 0.42 0.64
3. GENERALIZED ADDITIVE MODELS:
A generalizedadditive model wasbuiltwithanon-linearcomponenttothe variables –duration,amount
and age, the only numerical fields. From the summary of this GAMmodel, the edf of duration and age
were foundtobe 1, indicatingnopolynomialrelationshipwiththe responsevariable,response.The GAM
generated the below plots showing the polynomial relationship with the response.
Fig 5. GAM Plots
For the final GAMmodel builtafterretainingthe polynomialrelationshipforthe amountvariable,the
deviance,AICandBICwas calculated.
5. 5
Deviance AIC BIC
695.11 794.77 1028.20
The model wasalsotestedforthe in-sample misclassificationcostand AUCwiththe 80% trainingdata
and the out-of-sample misclassificationcostandAUC withthe 20% trainingdata. Anoptimal cut-off
probabilityof 1/6was usedforthe out-of-samplepredictioncut-off.
In - sample Out – of – sample
MCR Cost AUC MCR Cost AUC
0.32 0.43 0.848 0.395 0.63 0.76
Fig 6. ROC plots for the Final GAM Model
4. LINEAR DISCRIMINANT ANALYSIS:
To performa lineardiscriminantanalysis,the response variable,response wascodedasafactor.The LDA
was performed using the lda() and in-sample and out-of-sample misclassification cost and AUC were
calculated.
In - sample Out – of – sample
MCR Cost AUC MCR Cost AUC
0.32 0.46 0.76 0.37 0.55 0.76
Fig 7. ROC plots for the Final LDA Model
6. 6
5. NEURAL NETWORK:
Toimplementtheneural networkalgorithm,adatapreprocessingstepisrequired.The datapreprocessing
step is necessary to ensure that the algorithm converges. The independent variables were normalized
with the max-min scaling using x = (X-Xmin)/(Xmax-Xmin).
Choosing8hiddennodestorunthe neuralnetwork,the asymmetricmisclassificationcostwascalculated.
In - sample Out – of – sample
MCR Cost AUC MCR Cost AUC
0.24 0.33 0.804 0.34 0.62 0.69
Basedonthe MSPE valuescalculatedforthe Neuralnetwork,the modelperformsthe bestincomparison
with all the models run. The below ROC curves were generated for the Neural network. Clearly neural
networks don’t perform the best for this data set.
Fig 7. ROC plots for the Neural Network Model
CONCLUSION:
Summarizing the results from all the models run for the prediction problem, the below table was
populated.Fromthe belowtable,comparisonsin the performance betweenin-sample measurescanbe
done usingAIC,In-sample MSPE,while betweenthe out-of-sample measurescanbe done usingthe out-
of-sample MSE.
GLM (Stepwise
Variable
Selection)
RegressionTree GAM Linear
Discriminant
Analysis
Neural
Network
Model equation -sex
-present_resid -
n_credits -job -
n_people
Purpose, age,
present_emp,
other_install,
duration,
Smoothing
Term:
Amount
. .
7. 7
-telephone -
property
amount,
property,
credit_his
Deviance 820.73 - 695.11 - -
AIC 836.73 - 794.77 - -
In-sample AUC 0.841 - 0.848 0.734 0.804
Out-of-sample
AUC
0.748 - 0.76 0.69 0.69
In-sample
Cost
0.43 0.39 0.43 0.46 0.33
Out-of-sample
Cost
0.565 0.64 0.63 0.55 0.62
Fig 9. ROC plots comparing the in-sample, out-of-sample measures for all models
From the table above,it’sclearthatthe GAM model performsthe bestintermsof the in-sample and
out-of-sample AUCmeasures.Thisisalsobettervisualizedusingthe plotsbelow.
However,intermsof the misclassificationcost,the GAMprovesveryexpensive.Withrespecttothe
cost, the LDA performsbest.However,strikingabalance betweenthe AUCandcost,the Logistic
Regressionmodelworksbestforthe GermanCreditData.