Download as PDF, PPTX
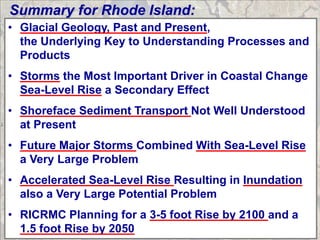
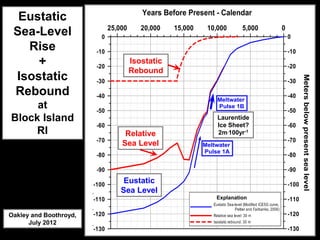
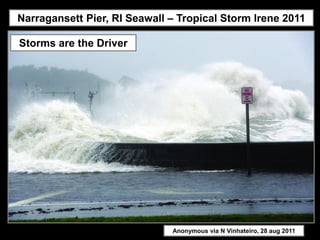
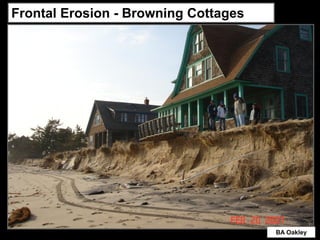

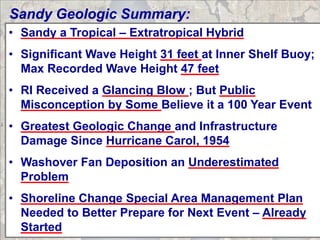

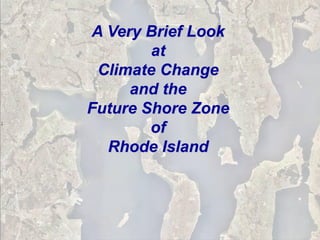
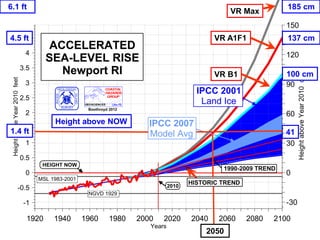
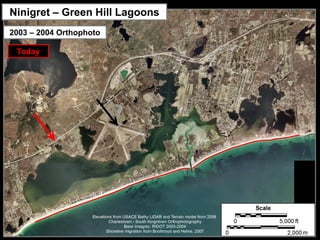

The document discusses coastal geologic hazards and the impact of sea-level rise in Rhode Island, highlighting that storms are the primary drivers of coastal change, with sea-level rise as a significant secondary concern. It outlines the need for better management practices to address erosion and flooding risks, especially in light of projected rises of 3-5 feet by 2100. Key points include concerns about the effects of past and future extreme weather events, the dynamics of sediment transport, and requisite planning efforts to mitigate these issues.


