
More Related Content
What's hot
What's hot (20)
Similar to Earthquake Damage
Similar to Earthquake Damage (20)
Recently uploaded
Recently uploaded (20)
Earthquake Damage
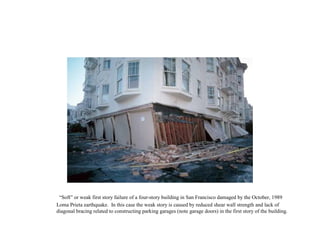
- 1. “Soft” or weak first story failure of a four-story building in San Francisco damaged by the October, 1989 Loma Prieta earthquake. In this case the weak story is caused by reduced shear wall strength and lack of diagonal bracing related to constructing parking garages (note garage doors) in the first story of the building.
- 4. Wreckage of The Emporium and James Flood Building on Market Street. This photograph shows the wreckage of the Emporium Building on the left, and the James Flood Building at Market and Powell streets.
- 5. Liquefaction-Differential Settlements Aerial view of leaning apartment houses in Niigata produced by soil liquefaction and the behavior of poor foundations. Most of the damage was caused by cracking and unequal settlement of the ground such as is shown here. About 1/3 of the city subsided by as much as 2 meters as a result of sand compaction. Photo Credit: National Geophysical Data Center
- 6. Aerial view of roadbed collapse near the interface of the cantilT truss sections of the San Francisco- Oakland Bay Bridge. View northwestward. [C.E. Meyer, U.S. Geological Survey]
- 7. Sand boil or sand volcano measuring 2 m (6.6 ft) in length erupted in median of Interstate Highway 80 west of the Bay Bridge toll plaza when ground shaking transformed loose water-saturated deposit of subsurface sand into a sand-water slurry (liquefaction). Vented sand contains marine-shell fragments. [J.C. Tinsley, U.S. Geological Survey]
- 8. House moved laterally off cement foundation. [J.K. Nakata, U.S. Geological Survey]
- 9. Cars crushed by collapsing brick facade near Fifth and Townsend Streets. At this locality, five people were killed while leaving from work. [C.E. Meyer, U.S. Geological Survey]
- 10. Ground view of collapsed building and burned area shown in photo 4, Beach and Divisadero, Marina District. [C.E. Meyer, U.S. Geological Survey]
- 11. Entrance and garage level of a Beach Street apartment complex in danger of collapse, Marina District. [C.E. Meyer, U.S. Geological Survey]
- 12. An automobile lies crushed under the third story of this apartment building in the Marina District. The ground levels are no longer visible because of structural failure and sinking due to liquefaction. [J.K. Nakata, U.S. Geological Survey]
- 13. Drain grating shows the effects of lateral compression. [R.A. Haugerud, U.S. Geological Survey]
- 14. Downtown sidewalk buckled due to compression. [J.K. Nakata, U.S. Geological Survey]
- 15. Side view of support-column failure and collapsed upper deck, Cypress viaduct. [H.G. Wilshire, U.S. Geological Survey]
- 16. Support-column failure and collapsed upper deck, Cypress viaduct. [H.G. Wilshire, U.S. Geological Survey]
- 17. Aerial view of collapsed sections of the Cypress viaduct of Interstate Highway 880. [H.G. Wilshire, U.S. Geological Survey]
- 18. Aerial view of slide at Daly City. This is the largest slide triggered by the earthquake in San Mateo County, displacing approximately 36,700 cubic meters (48,000 cubic yards) of material. The base is about 152 m (500 ft) across at its widest point. [S.D. Ellen, U.S. Geological Survey]
- 19. KGO radio transmission towers, built on bay mud in a salt-evaporation pond used by the Leslie Salt Company. Note progressively less damage to towers away from viewer. [H.G. Wilshire, U.S. Geological Survey]
- 21. The cement retaining walls along Highway 280 deformed in accordion-like pattern as a result of lateral compression. [J.K. Nakata, U.S. Geological Survey]
- 22. Crack system with 1.2 m (4 ft) of vertical displacement across a clay tennis court; fracture passes across retaining wall and up slope beyond view. West of Summit Road, southeast of Highway 17. [H.G. Wilshire, U.S. Geological Survey]
- 23. A crack system destroys driveway adjacent to summit road 0.8 km (1/2 mi) southeast of Highway 17. [J.K. Nakata, U.S. Geological Survey]
- 24. Construction on fill and the absence of adequate shear walls ccontributed to the failure of this structure. [J.K. Nakata, U.S. Geological Survey]
- 25. House torn off its foundation by the main shock. [J.K. Nakata, U.S. Geological Survey]
- 26. Collapsed outer wall of the Medico Dental Building, Pacific Garden Mall, Santa Cruz. [J.K. Nakata, U.S. Geological Survey]
- 27. Liquefaction in recent deposits of the Pajaro River formed these sand volcanoes along extensional fissures in a field prepared for autumn planting near Pajaro, across the Pajaro River from Watsonville. Furrows are spaced about 1.2 meters (4 feet) apart. [J.C. Tinsley, U.S. Geological Survey]
- 28. This Building is typical of a Japanese Style home. They have very heavy roofs made with clay tiles (designed to resist the frequent typhoons). Due to the general lack of space in Japan, it is common for the houses to start on a second floor with space underneath to park a car in. This type of lower storey proves to be less stiff and this, together with the heavy roof, often causes the lower storey to collapse during an earthquake. (Kobe, Japan, 1995)
- 29. The Timber houses that are simply covered in a form of plaster are rigid and heavy and so are prone to numerous types of failure and collapse. There are additionallly often built on stilts which causes the problem of stiffness differences (Kobe, Japan, 1995)
- 30. In the above, the left hand column on the bottom floor has failed. This has led to the collapse of the whole building, and the annex behind. The failure has most likely occurred this way because of different stiffness ratios between the bottom and next layers. (Kobe, Japan, 1995)
- 31. Large sections of the main Hanshin Expressway toppled over. This was particularly likely where the road crossed areas of softer, wetter ground, where the shaking was stronger and lasted longer. (Kobe, Japan, 1995)
- 33. Buildings founded on liquefied ground will lean or topple. (Kobe, Japan, 1995)
- 34. One of the more famous pictures of the destruction done by the 1964 Great Alaska Earthquake. This photo shows evidence of subsidence at Government Hill School, Anchorage. (slumping)
- 35. The six-story Four Seasons apartment building in Anchorage was completely destroyed. (Anchorage, Alaska, 1964)
- 36. Uplifted sea floor at Cape Cleare, Montague Island, Prince William Sound, in the area of greatest recorded tectonic uplift on land (33 feet). The very gently slopping flat rocky surface with the white coating which lies between the cliffs and the water is about a quarter of a mile wide. It is a wave cut surface that was below sea level before the earthquake. The white coating consists of the remains of calcareous marine organisms that were killed by desiccation when the wave cut surface was lifted above the high tide during the earthquake. (Anchorage, Alaska, 1964)
- 37. The stumps in the foreground are part of an ancient forest on Latouche island, Prince William Sound, that was submerged below sea level and buried in prehistoric times. Tectonic uplift of 9 feet during the earthquake raised these stumps above sea level once again, demonstrating that the area is tectonically restless.
- 38. Close-up view of tsunami damage along the waterfront at Kodiak.
- 39. Collapse of Fourth Avenue near C Street, Anchorage, due to earthquake caused landslide. Before the earthquake, the sidewalk at left, which is in the graben, was at street level on the right. The graben subsides 11 feet in response to 14 feet of horizontal movement. Anchorage district, Cook Inlet region, Alaska. 1964.
- 40. Photographs of the 1960 Tsunami Destruction at Hilo (ITIC archives) (Chile Earthquake, 1960, M 9.5)
- 41. On May 22, 1960, at 19:11 GMT, a large destructive earthquake off the coast of South Central Chile along the Peru-Chile Trench, generated one of the the most destructive tsunamis to hit Hawaii and the rest of the Pacific in this century. The earthquake itself was the largest in this century for the southern hemisphere. Its surface-wave magnitude was 8.6 with an epicenter at 39.5° S, 74.5° W, and a focal depth at 33 km. The earthquake and the tsunami were extremely destructive in Chile, particularly in the coastal area extending from Concepcion to the south end of Isla Chiloe. At the coastal area closest to the epicenter, huge tsunami waves measuring as high as 25 meters, arrived within 10 to 15 minutes after the earthquake, killing at least two hundred people, sinking all the boats, and inundating half a kilometer inland. The total number of lives lost from the tsunami along the coast Peru-Chile coast is not known with accuracy but estimates range anywhere from 330 to 2000 people.
- 42. Photographs of the 1960 Tsunami Destruction at Hilo (ITIC archives) (Chile Earthquake, 1960, M 9.5)
- 43. The Pacific-wide tsunami triggered by this earthquake, raced across the ocean causing extensive destruction along its path, particularly in Hawaii and in Japan. The number of fatalities attributed to both the tsunami and the earthquake have been estimated to be between 490 to 2,290. Damage costs were estimated at over half billion dollars.
- 44. Photographs of the 1960 Tsunami Destruction at Hilo (ITIC archives) (Chile Earthquake, 1960, M 9.5)
- 45. The 1960 tsunami was extremely devastating at Hilo advancing far inland through the entire present downtown area. A total of 61 people lost their lives and about 540 homes and businesses were destroyed or severely damaged. Damage was estimated at $24 million (in 1960 dollars). The first tsunami wave in Hawaii, traveled a distance of 10,000 kilometers from the area of generation and arrived at the town of Hilo , 14.8 hours after the earthquake. Subsequently, seven more large waves arrived at Hilo in 12 to 20 minute intervals. The maximum tsunami wave at Hilo was 10.7 meters (about 35 feet) high, . The aerial photograph below taken by the U.S. Navy , depicts the extent of destruction at downtown Hilo following the passing of the tsunami. The force of debris-carrying tsunami waves showing bent parking meters in downtown Hilo, is illustrated with the photos below taken by the U.S. Army Corps of Engineers. Elsewhere in the United States, tsunami waves of up to 1.7 meters were observed at Crescent City, California, with minor damage reported. The tsunami travel time of the first wave to arrive at Crescent City was 15.5 hours after the occurrence of the Chilean earthquake.