Downloaded 29 times

![RPOA Resources
• Fifty Shades of RPO: Loving your RPO partner after the sexy
sales tam leaves town [webinar]
• Recruitment Process Outsourcing – The Good, the bad, and
the ugly [white paper]
• Ten Things you need to know before you choose a
recruitment process outsourcing partner [white paper]
• Skip this step and kill your brand – recruiting etiquette 101](https://image.slidesharecdn.com/boardroomrecruitingreportwebinarfinal-130926110653-phpapp01/85/Boardroom-recruiting-report-webinar-27-320.jpg)

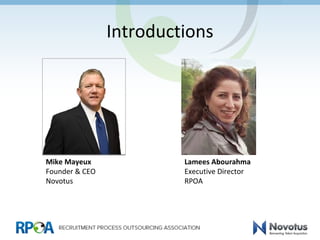
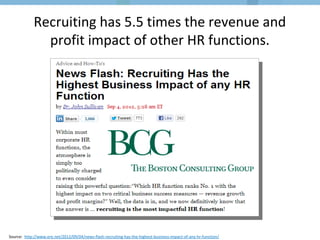
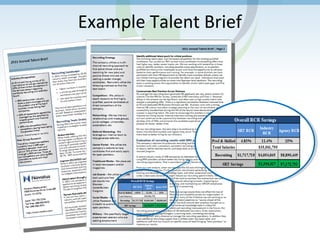
The document is a report presented by Mike Mayeux on essential statistics for recruiting leaders, emphasizing the importance of recruiting for organizational success and cost management. It discusses the impacts of turnover costs, speed of hire, candidate quality, and the need for strong talent acquisition strategies, while advocating for metrics to support recruiting objectives. Additionally, it offers guidelines for creating effective talent briefs and insights into partnership with recruiting process outsourcing providers.


![How to Measure & Improve Quality of Hire [Webcast]](https://cdn.slidesharecdn.com/ss_thumbnails/wcqualityofhirelouadler11-151210103121-thumbnail.jpg?width=640&height=640&fit=bounds)


![In Recruiting, How Important Is Cost Per Hire? [webcast]](https://cdn.slidesharecdn.com/ss_thumbnails/lkndcostperhiredavidgreen10-151007195410-lva1-app6892-thumbnail.jpg?width=640&height=640&fit=bounds)


![5G Explained! A High Level Overview [Introduction]](https://cdn.slidesharecdn.com/ss_thumbnails/5gexplainedahighleveloverview-260119165306-cc137a3e-thumbnail.jpg?width=640&height=640&fit=bounds)

