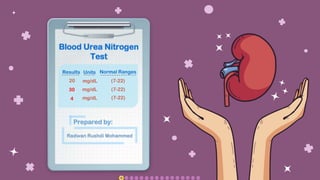
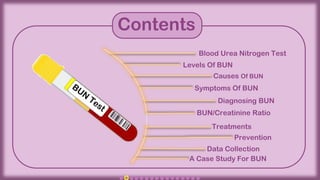
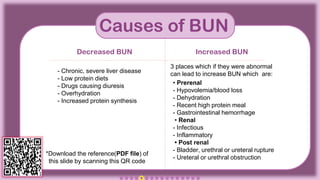
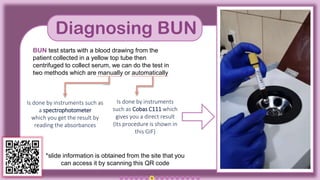
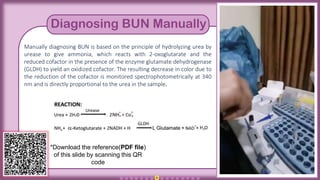
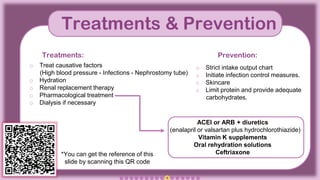
CREDITS: This presentation template was
created by Radwan Rushdi, including
infographics, icons, videos & images
Hold the cursor on the social icons to view the
information & Ctrl + Click to follow the link
Blood Urea Nitrogen
Test
Results Units Normal Ranges
20 mg/dL (7-22)
30 mg/dL (7-22)
4 mg/dL (7-22)
Prepared by:
Radwan Rushdi Mohammed
CREDITS: This presentation template was
created by Radwan Rushdi, including
infographics, icons, videos & images
Hold the cursor on the social icons to view the
information & Ctrl + Click to follow the link
Contents
Blood Urea Nitrogen Test
Levels Of BUN
Causes Of BUN
Symptoms Of BUN
Diagnosing BUN
BUN/Creatinine Ratio
Data Collection
A Case Study For BUN
Treatments
Prevention
CREDITS: This presentation template was
created by Radwan Rushdi, including
infographics, icons, videos & images
Hold the cursor on the social icons to view the
information & Ctrl + Click to follow the link
Blood Urea Nitrogen
Blood urea nitrogen (BUN):
is a measure of the amount of urea
nitrogen's in the blood
The liver produces urea as a waste product of proteins
breakdown. It binds excess nitrogen from used-up
proteins and safely removes it from the body
5 enzymes take part to produces urea
This test is ordered to check if kidneys are working
normally or if kidney disease is progressing
*You can get the reference of this slide
by scanning this QR code
CO(NH2)2
CREDITS: This presentation template was
created by Radwan Rushdi, including
infographics, icons, videos & images
Hold the cursor on the social icons to view the
information & Ctrl + Click to follow the link
Levels of BUN
Approximately normal levels of
Serum/plasma urea is 2.5-7.8 mmol/L and for
Serum/plasma BUN is 7.0-22 mg/dL
BUN levels represent the balance between:
Urea production (in the liver)
Urea breakdown
Urea elimination (via the kidneys)
Therefore, BUN is an indicator of kidney health
and/or liver health.
*Scan for slide reference
0
10
20
30
10 15 20 30 40 50 60 70 80 90 100
BUN with age
male female
CREDITS: This presentation template was
created by Radwan Rushdi, including
infographics, icons, videos & images
Hold the cursor on the social icons to view the
information & Ctrl + Click to follow the link
Causes of BUN
*Download the reference(PDF file) of
this slide by scanning this QR code
- Chronic, severe liver disease
- Low protein diets
- Drugs causing diuresis
- Overhydration
- Increased protein synthesis
• Prerenal
- Hypovolemia/blood loss
- Dehydration
- Recent high protein meal
- Gastrointestinal hemorrhage
• Renal
- Infectious
- Inflammatory
• Post renal
- Bladder, urethral or ureteral rupture
- Ureteral or urethral obstruction
3 places which if they were abnormal
can lead to increase BUN which are:
Decreased BUN Increased BUN
CREDITS: This presentation template was
created by Radwan Rushdi, including
infographics, icons, videos & images
Hold the cursor on the social icons to view the
information & Ctrl + Click to follow the link
Symptoms of BUN
*Scan for slide reference
Decreased BUN Increased BUN
Decreased BUN symptoms include
liver disease symptoms such as:
- jaundice
- Fatigue
- Diarrhea
- Swelling lower legs
Increased BUN may cause you to have
some of the following symptoms:
- Extreme tiredness or fatigue
- Cramping in your legs
- Little or no appetite
- Headache
- Nausea
- Vomiting
- Trouble concentrating
CREDITS: This presentation template was
created by Radwan Rushdi, including
infographics, icons, videos & images
Hold the cursor on the social icons to view the
information & Ctrl + Click to follow the link
Diagnosing BUN
*slide information is obtained from the site that you
can access it by scanning this QR code
Is done by instruments
such as Cobas C111 which
gives you a direct result
(Its procedure is shown in
this GIF)
Is done by instruments such as
a spectrophotometer
which you get the result by
reading the absorbances
BUN test starts with a blood drawing from the
patient collected in a yellow top tube then
centrifuged to collect serum, we can do the test in
two methods which are manually or automatically
CREDITS: This presentation template was
created by Radwan Rushdi, including
infographics, icons, videos & images
Hold the cursor on the social icons to view the
information & Ctrl + Click to follow the link
Diagnosing BUN Manually
*Download the reference(PDF file)
of this slide by scanning this QR
code
Manually diagnosing BUN is based on the principle of hydrolyzing urea by
urease to give ammonia, which reacts with 2-oxoglutarate and the
reduced cofactor in the presence of the enzyme glutamate dehydrogenase
(GLDH) to yield an oxidized cofactor. The resulting decrease in color due to
the reduction of the cofactor is monitored spectrophotometrically at 340
nm and is directly proportional to the urea in the sample.
CREDITS: This presentation template was
created by Radwan Rushdi, including
infographics, icons, videos & images
Hold the cursor on the social icons to view the
information & Ctrl + Click to follow the link
BUN/Creatinine Ratio
*Scan for slide reference
An increased ratio may be due to a condition that causes a
decrease in the flow of blood to the kidneys, such as congestive
heart failure or dehydration. It may also be seen with increased
protein, gastrointestinal bleeding, or increased protein in the diet.
An increased ratio:
The ratio may be decreased with liver
disease (due to a decrease in the
formation of urea) and malnutrition.
A decreased ratio:
The normal BUN/Creatinine ratio
is 10-20 to 1
Increased BUN
Normal Creatinine
Renal decreased BUN / Creatinine ratio
Low dietary protein or severe liver disease
Pre-renal increased BUN / Creatinine ratio
BUN is more susceptible to non-renal factors
Increased BUN
Increased Creatinine
Post-renal increased ratio BUN/ Creatinine ratio
Both BUN and Creatinine are elevated
Decreased BUN
Normal Creatinine
CREDITS: This presentation template was
created by Radwan Rushdi, including
infographics, icons, videos & images
Hold the cursor on the social icons to view the
information & Ctrl + Click to follow the link
Treatments & Prevention
*You can get the reference of this
slide by scanning this QR code
o Treat causative factors
(High blood pressure - Infections - Nephrostomy tube)
o Hydration
o Renal replacement therapy
o Pharmacological treatment
o Dialysis if necessary
o Strict intake output chart
o Initiate infection control measures.
o Skincare
o Limit protein and provide adequate
carbohydrates.
Prevention:
Treatments:
ACEI or ARB + diuretics
(enalapril or valsartan plus hydrochlorothiazide)
Vitamin K supplements
Oral rehydration solutions
Ceftriaxone
CREDITS: This presentation template was
created by Radwan Rushdi, including
infographics, icons, videos & images
Hold the cursor on the social icons to view the
information & Ctrl + Click to follow the link
Data collection For BUN Test
*You can access through the name of the labs
and their places(But not in English)
by scanning this QR code
The data that I collected was based on which
gender is more likely is affected by the BUN test
and also their ages, diagnosis techniques & the
prices are included
- Data is collected by visiting 40 laboratories
- A form is filled out by the lab technicians
- The form consists of 8 questions
- Results are mentioned in the other slide
CREDITS: This presentation template was
created by Radwan Rushdi, including
infographics, icons, videos & images
Hold the cursor on the social icons to view the
information & Ctrl + Click to follow the link
2
7
6
15
7
1 2
Price-IQD
2000 3000 4000 5000 7000 8000 10000
75%
25%
Gender
CREDITS: This presentation template was
created by Radwan Rushdi, including
infographics, icons, videos & images
Hold the cursor on the social icons to view the
information & Ctrl + Click to follow the link
4
6
10
14
30
23
0
5
10
15
20
25
30
35
Age
Age Average
< 10 10-18 19 - 24 25 - 35 36 - 49 > 50
37 3
0 5 10 15 20 25 30 35 40
Method
Diagnosis
Automatically
Manually
CREDITS: This presentation template was
created by Radwan Rushdi, including
infographics, icons, videos & images
Hold the cursor on the social icons to view the
information & Ctrl + Click to follow the link
BUN Clinical Case Study
*This case is based on
real-life research you
can access the research
by scanning this QR
code
A 53-year-old African-American male presented to the emergency room (ER) with complaints of
nausea and vomiting for 2 months, shortness of breath for the last few days, altered taste
sensation, and worsening preexisting lower extremity swelling.
Other complaints included blurred vision, diarrhea, and extreme weakness. Social History
includes no tobacco use and occasional alcohol use. Pertinent physical examination findings
were significant for lower extremity edema up to the knees, and the presence of fine white
crystals distributed in patches on the head and neck (pictures are shown below)
Test results that he made are shown in the other slide.
CREDITS: This presentation template was
created by Radwan Rushdi, including
infographics, icons, videos & images
Hold the cursor on the social icons to view the
information & Ctrl + Click to follow the link
BUN Clinical Case Study
*This case is based on real-life research
you can access the research by scanning
this QR code
NOTE: Those results that are underlined( ) under the numbers refer to an abnormal result
CREDITS: This presentation template was
created by Radwan Rushdi, including
infographics, icons, videos & images
Hold the cursor on the social icons to view the
information & Ctrl + Click to follow the link
Review me!
Download this file as PPT to edit it!

Blood Urea Nitrogen Test

  • 1.
    CREDITS: This presentationtemplate was created by Radwan Rushdi, including infographics, icons, videos & images Hold the cursor on the social icons to view the information & Ctrl + Click to follow the link Blood Urea Nitrogen Test Results Units Normal Ranges 20 mg/dL (7-22) 30 mg/dL (7-22) 4 mg/dL (7-22) Prepared by: Radwan Rushdi Mohammed
  • 2.
    CREDITS: This presentationtemplate was created by Radwan Rushdi, including infographics, icons, videos & images Hold the cursor on the social icons to view the information & Ctrl + Click to follow the link Contents Blood Urea Nitrogen Test Levels Of BUN Causes Of BUN Symptoms Of BUN Diagnosing BUN BUN/Creatinine Ratio Data Collection A Case Study For BUN Treatments Prevention
  • 3.
    CREDITS: This presentationtemplate was created by Radwan Rushdi, including infographics, icons, videos & images Hold the cursor on the social icons to view the information & Ctrl + Click to follow the link Blood Urea Nitrogen Blood urea nitrogen (BUN): is a measure of the amount of urea nitrogen's in the blood The liver produces urea as a waste product of proteins breakdown. It binds excess nitrogen from used-up proteins and safely removes it from the body 5 enzymes take part to produces urea This test is ordered to check if kidneys are working normally or if kidney disease is progressing *You can get the reference of this slide by scanning this QR code CO(NH2)2
  • 4.
    CREDITS: This presentationtemplate was created by Radwan Rushdi, including infographics, icons, videos & images Hold the cursor on the social icons to view the information & Ctrl + Click to follow the link Levels of BUN Approximately normal levels of Serum/plasma urea is 2.5-7.8 mmol/L and for Serum/plasma BUN is 7.0-22 mg/dL BUN levels represent the balance between: Urea production (in the liver) Urea breakdown Urea elimination (via the kidneys) Therefore, BUN is an indicator of kidney health and/or liver health. *Scan for slide reference 0 10 20 30 10 15 20 30 40 50 60 70 80 90 100 BUN with age male female
  • 5.
    CREDITS: This presentationtemplate was created by Radwan Rushdi, including infographics, icons, videos & images Hold the cursor on the social icons to view the information & Ctrl + Click to follow the link Causes of BUN *Download the reference(PDF file) of this slide by scanning this QR code - Chronic, severe liver disease - Low protein diets - Drugs causing diuresis - Overhydration - Increased protein synthesis • Prerenal - Hypovolemia/blood loss - Dehydration - Recent high protein meal - Gastrointestinal hemorrhage • Renal - Infectious - Inflammatory • Post renal - Bladder, urethral or ureteral rupture - Ureteral or urethral obstruction 3 places which if they were abnormal can lead to increase BUN which are: Decreased BUN Increased BUN
  • 6.
    CREDITS: This presentationtemplate was created by Radwan Rushdi, including infographics, icons, videos & images Hold the cursor on the social icons to view the information & Ctrl + Click to follow the link Symptoms of BUN *Scan for slide reference Decreased BUN Increased BUN Decreased BUN symptoms include liver disease symptoms such as: - jaundice - Fatigue - Diarrhea - Swelling lower legs Increased BUN may cause you to have some of the following symptoms: - Extreme tiredness or fatigue - Cramping in your legs - Little or no appetite - Headache - Nausea - Vomiting - Trouble concentrating
  • 7.
    CREDITS: This presentationtemplate was created by Radwan Rushdi, including infographics, icons, videos & images Hold the cursor on the social icons to view the information & Ctrl + Click to follow the link Diagnosing BUN *slide information is obtained from the site that you can access it by scanning this QR code Is done by instruments such as Cobas C111 which gives you a direct result (Its procedure is shown in this GIF) Is done by instruments such as a spectrophotometer which you get the result by reading the absorbances BUN test starts with a blood drawing from the patient collected in a yellow top tube then centrifuged to collect serum, we can do the test in two methods which are manually or automatically
  • 8.
    CREDITS: This presentationtemplate was created by Radwan Rushdi, including infographics, icons, videos & images Hold the cursor on the social icons to view the information & Ctrl + Click to follow the link Diagnosing BUN Manually *Download the reference(PDF file) of this slide by scanning this QR code Manually diagnosing BUN is based on the principle of hydrolyzing urea by urease to give ammonia, which reacts with 2-oxoglutarate and the reduced cofactor in the presence of the enzyme glutamate dehydrogenase (GLDH) to yield an oxidized cofactor. The resulting decrease in color due to the reduction of the cofactor is monitored spectrophotometrically at 340 nm and is directly proportional to the urea in the sample.
  • 9.
    CREDITS: This presentationtemplate was created by Radwan Rushdi, including infographics, icons, videos & images Hold the cursor on the social icons to view the information & Ctrl + Click to follow the link BUN/Creatinine Ratio *Scan for slide reference An increased ratio may be due to a condition that causes a decrease in the flow of blood to the kidneys, such as congestive heart failure or dehydration. It may also be seen with increased protein, gastrointestinal bleeding, or increased protein in the diet. An increased ratio: The ratio may be decreased with liver disease (due to a decrease in the formation of urea) and malnutrition. A decreased ratio: The normal BUN/Creatinine ratio is 10-20 to 1 Increased BUN Normal Creatinine Renal decreased BUN / Creatinine ratio Low dietary protein or severe liver disease Pre-renal increased BUN / Creatinine ratio BUN is more susceptible to non-renal factors Increased BUN Increased Creatinine Post-renal increased ratio BUN/ Creatinine ratio Both BUN and Creatinine are elevated Decreased BUN Normal Creatinine
  • 10.
    CREDITS: This presentationtemplate was created by Radwan Rushdi, including infographics, icons, videos & images Hold the cursor on the social icons to view the information & Ctrl + Click to follow the link Treatments & Prevention *You can get the reference of this slide by scanning this QR code o Treat causative factors (High blood pressure - Infections - Nephrostomy tube) o Hydration o Renal replacement therapy o Pharmacological treatment o Dialysis if necessary o Strict intake output chart o Initiate infection control measures. o Skincare o Limit protein and provide adequate carbohydrates. Prevention: Treatments: ACEI or ARB + diuretics (enalapril or valsartan plus hydrochlorothiazide) Vitamin K supplements Oral rehydration solutions Ceftriaxone
  • 11.
    CREDITS: This presentationtemplate was created by Radwan Rushdi, including infographics, icons, videos & images Hold the cursor on the social icons to view the information & Ctrl + Click to follow the link Data collection For BUN Test *You can access through the name of the labs and their places(But not in English) by scanning this QR code The data that I collected was based on which gender is more likely is affected by the BUN test and also their ages, diagnosis techniques & the prices are included - Data is collected by visiting 40 laboratories - A form is filled out by the lab technicians - The form consists of 8 questions - Results are mentioned in the other slide
  • 12.
    CREDITS: This presentationtemplate was created by Radwan Rushdi, including infographics, icons, videos & images Hold the cursor on the social icons to view the information & Ctrl + Click to follow the link 2 7 6 15 7 1 2 Price-IQD 2000 3000 4000 5000 7000 8000 10000 75% 25% Gender
  • 13.
    CREDITS: This presentationtemplate was created by Radwan Rushdi, including infographics, icons, videos & images Hold the cursor on the social icons to view the information & Ctrl + Click to follow the link 4 6 10 14 30 23 0 5 10 15 20 25 30 35 Age Age Average < 10 10-18 19 - 24 25 - 35 36 - 49 > 50 37 3 0 5 10 15 20 25 30 35 40 Method Diagnosis Automatically Manually
  • 14.
    CREDITS: This presentationtemplate was created by Radwan Rushdi, including infographics, icons, videos & images Hold the cursor on the social icons to view the information & Ctrl + Click to follow the link BUN Clinical Case Study *This case is based on real-life research you can access the research by scanning this QR code A 53-year-old African-American male presented to the emergency room (ER) with complaints of nausea and vomiting for 2 months, shortness of breath for the last few days, altered taste sensation, and worsening preexisting lower extremity swelling. Other complaints included blurred vision, diarrhea, and extreme weakness. Social History includes no tobacco use and occasional alcohol use. Pertinent physical examination findings were significant for lower extremity edema up to the knees, and the presence of fine white crystals distributed in patches on the head and neck (pictures are shown below) Test results that he made are shown in the other slide.
  • 15.
    CREDITS: This presentationtemplate was created by Radwan Rushdi, including infographics, icons, videos & images Hold the cursor on the social icons to view the information & Ctrl + Click to follow the link BUN Clinical Case Study *This case is based on real-life research you can access the research by scanning this QR code NOTE: Those results that are underlined( ) under the numbers refer to an abnormal result
  • 16.
    CREDITS: This presentationtemplate was created by Radwan Rushdi, including infographics, icons, videos & images Hold the cursor on the social icons to view the information & Ctrl + Click to follow the link Review me! Download this file as PPT to edit it!