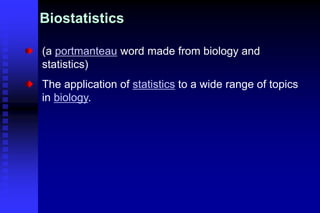
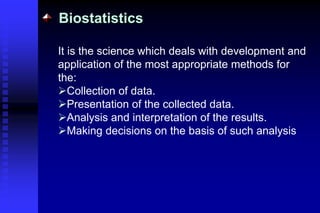
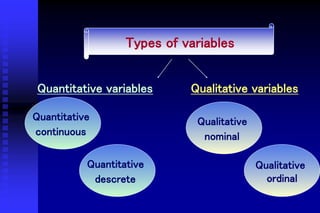
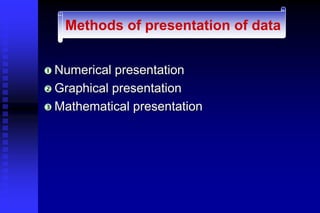
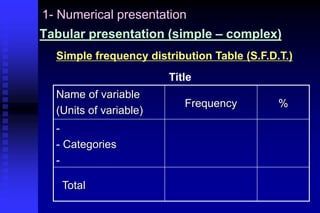
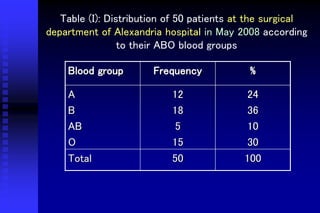
This ppt is all about Biostatistics for Medical, Nursing and Pharmacy Students...
The Essentials of Biostatistics for Physicians, Nurses, and Clinicians
Biostatistics – Lecture Notes/Book (PDF) Nursing
Biostatistics are the development and application of statistical methods to a wide range of topics in biology. It encompasses the design of biological experiments, the collection and analysis of data from those experiments and the interpretation of the results.
Unit-I Measures of Dispersion- Biostatistics - Ravinandan A P.pdfRavinandan A P
Biostatistics, Unit-I, Measures of Dispersion, Dispersion
Range
variation of mean
standard deviation
Variance
coefficient of variation
standard error of the mean
This presentation will address the issue of sample size determination for social sciences. A simple example is provided for every to understand and explain the sample size determination.
A sample design is a definite plan for obtaining a sample from a given population. Researcher must select/prepare a sample design which should be reliable and appropriate for his research study.
Biostatistics are widely used in clinical trials to collect and organize and describe and interpret these result and then give to us proves to take appropriate clinical decisions
This ppt includes basic concepts about data types, levels of measurements. It also explains which descriptive measure, graph and tests should be used for different types of data. A brief of Pivot tables and charts is also included.
Introduction to Biostatistic
It is the science which deals with development and application of the most appropriate methods for the:
Collection of data.
Presentation of the collected data.
Analysis and interpretation of the results.
Making decisions on the basis of such analysis
Frequently used in referral to recorded data
Denotes characteristics calculated for a set of data : sample mean
Role of statisticians
To guide the design of an experiment or survey prior to data collection
To analyze data using proper statistical procedures and techniques
To present and interpret the results to researchers and other decision makers
Statistical Analysis is complex part but reporting of data in proper manner with proper selective graphs & interpretations is also necessary part of data analysis !!!
Introduction to AI for Nonprofits with Tapp NetworkTechSoup
Dive into the world of AI! Experts Jon Hill and Tareq Monaur will guide you through AI's role in enhancing nonprofit websites and basic marketing strategies, making it easy to understand and apply.
Synthetic Fiber Construction in lab .pptxPavel ( NSTU)
Synthetic fiber production is a fascinating and complex field that blends chemistry, engineering, and environmental science. By understanding these aspects, students can gain a comprehensive view of synthetic fiber production, its impact on society and the environment, and the potential for future innovations. Synthetic fibers play a crucial role in modern society, impacting various aspects of daily life, industry, and the environment. ynthetic fibers are integral to modern life, offering a range of benefits from cost-effectiveness and versatility to innovative applications and performance characteristics. While they pose environmental challenges, ongoing research and development aim to create more sustainable and eco-friendly alternatives. Understanding the importance of synthetic fibers helps in appreciating their role in the economy, industry, and daily life, while also emphasizing the need for sustainable practices and innovation.
A Strategic Approach: GenAI in EducationPeter Windle
Artificial Intelligence (AI) technologies such as Generative AI, Image Generators and Large Language Models have had a dramatic impact on teaching, learning and assessment over the past 18 months. The most immediate threat AI posed was to Academic Integrity with Higher Education Institutes (HEIs) focusing their efforts on combating the use of GenAI in assessment. Guidelines were developed for staff and students, policies put in place too. Innovative educators have forged paths in the use of Generative AI for teaching, learning and assessments leading to pockets of transformation springing up across HEIs, often with little or no top-down guidance, support or direction.
This Gasta posits a strategic approach to integrating AI into HEIs to prepare staff, students and the curriculum for an evolving world and workplace. We will highlight the advantages of working with these technologies beyond the realm of teaching, learning and assessment by considering prompt engineering skills, industry impact, curriculum changes, and the need for staff upskilling. In contrast, not engaging strategically with Generative AI poses risks, including falling behind peers, missed opportunities and failing to ensure our graduates remain employable. The rapid evolution of AI technologies necessitates a proactive and strategic approach if we are to remain relevant.
Honest Reviews of Tim Han LMA Course Program.pptxtimhan337
Personal development courses are widely available today, with each one promising life-changing outcomes. Tim Han’s Life Mastery Achievers (LMA) Course has drawn a lot of interest. In addition to offering my frank assessment of Success Insider’s LMA Course, this piece examines the course’s effects via a variety of Tim Han LMA course reviews and Success Insider comments.
Embracing GenAI - A Strategic ImperativePeter Windle
Artificial Intelligence (AI) technologies such as Generative AI, Image Generators and Large Language Models have had a dramatic impact on teaching, learning and assessment over the past 18 months. The most immediate threat AI posed was to Academic Integrity with Higher Education Institutes (HEIs) focusing their efforts on combating the use of GenAI in assessment. Guidelines were developed for staff and students, policies put in place too. Innovative educators have forged paths in the use of Generative AI for teaching, learning and assessments leading to pockets of transformation springing up across HEIs, often with little or no top-down guidance, support or direction.
This Gasta posits a strategic approach to integrating AI into HEIs to prepare staff, students and the curriculum for an evolving world and workplace. We will highlight the advantages of working with these technologies beyond the realm of teaching, learning and assessment by considering prompt engineering skills, industry impact, curriculum changes, and the need for staff upskilling. In contrast, not engaging strategically with Generative AI poses risks, including falling behind peers, missed opportunities and failing to ensure our graduates remain employable. The rapid evolution of AI technologies necessitates a proactive and strategic approach if we are to remain relevant.
3. Biostatistics
(a portmanteau word made from biology and
statistics)
The application of statistics to a wide range of topics
in biology.
4. Biostatistics
It is the science which deals with development and
application of the most appropriate methods for
the:
Collection of data.
Presentation of the collected data.
Analysis and interpretation of the results.
Making decisions on the basis of such analysis
5. Other definitions for “Statistics”
Frequently used in referral to recorded data
Denotes characteristics calculated for a set of data :
sample mean
6. Role of statisticians
To guide the design of an experiment or survey
prior to data collection
To analyze data using proper statistical
procedures and techniques
To present and interpret the results to researchers
and other decision makers
10. Numerical presentation
Graphical presentation
Mathematical presentation
Methods of presentation of data
11. 1- Numerical presentation
Tabular presentation (simple – complex)
Simple frequency distribution Table (S.F.D.T.)
Title
Name of variable
(Units of variable)
Frequency %
-
- Categories
-
Total
12. Table (I): Distribution of 50 patients at the surgical
department of Alexandria hospital in May 2008 according
to their ABO blood groups
Blood group Frequency %
A
B
AB
O
12
18
5
15
24
36
10
30
Total 50 100
13. Table (II): Distribution of 50 patients at the surgical
department of Alexandria hospital in May 2008 according
to their age
Age
(years)
Frequency %
20-<30
30-
40-
50+
12
18
5
15
24
36
10
30
Total 50 100
14. Complex frequency distribution Table
Table (III): Distribution of 20 lung cancer patients at the chest department
of Alexandria hospital and 40 controls in May 2008 according to smoking
Smoking
Lung cancer
Total
Cases Control
No. % No. % No. %
Smoker 15 75% 8 20% 23 38.33
Non
smoker 5 25% 32 80% 37 61.67
Total 20 100 40 100 60 100
15. Complex frequency distribution Table
Table (IV): Distribution of 60 patients at the chest department of
Alexandria hospital in May 2008 according to smoking & lung cancer
Smoking
Lung cancer
Total
positive negative
No. % No. % No. %
Smoker 15 65.2 8 34.8 23 100
Non
smoker 5 13.5 32 86.5 37 100
Total 20 33.3 40 66.7 60 100
16. 2- Graphical presentation
Graphs drawn using Cartesian
coordinates
• Line graph
• Frequency polygon
• Frequency curve
• Histogram
• Bar graph
• Scatter plot
Pie chart
Statistical maps
rules
17. Line Graph
0
10
20
30
40
50
60
1960 1970 1980 1990 2000
Year
MMR/1000 Year MMR
1960 50
1970 45
1980 26
1990 15
2000 12
Figure (1): Maternal mortality rate of
(country), 1960-2000
19. Frequency polygon
Age
Sex
M-P
M F
20- (12%) (10%) 25
30- (36%) (30%) 35
40- (8%) (25%) 45
50- (16%) (15%) 55
60-70 (8%) (20%) 65
0
5
10
15
20
25
30
35
40
25 35 45 55 65
Age
%
Males Females
Figure (2): Distribution of 45 patients at (place) , in
(time) by age and sex
21. Histogram
Distribution of a group of cholera patients by age
Age (years) Frequency %
25-
30-
40-
45-
60-65
3
5
7
4
2
14.3
23.8
33.3
19.0
9.5
Total 21 100
0
5
10
15
20
25
30
35
0
2
5
3
0
4
0
4
5
6
0
6
5
Age (years)
%
Figure (2): Distribution of 100 cholera patients at (place) , in (time)
by age
27. 1- Measures of central tendency (averages)
Midrange
Smallest observation + Largest observation
2
Mode
the value which occurs with the greatest
frequency i.e. the most common value
Summery statistics
28. 1- Measures of central tendency (cont.)
Median
the observation which lies in the middle of
the ordered observation.
Arithmetic mean (mean)
Sum of all observations
Number of observations
Summery statistics
29. Measures of dispersion
Range
Variance
Standard deviation
Semi-interquartile range
Coefficient of variation
“Standard error”
30. Standard deviation SD
7 7
7 7 7
7
7 8
7 7 7
6 3 2
7 8 13
9
Mean = 7
SD=0
Mean = 7
SD=0.63
Mean = 7
SD=4.04
31. Standard error of mean SE
A measure of variability among means of samples
selected from certain population
SE (Mean) =
S
n