The document discusses the necessity of evaluating the uncertainty of measurement (UM) in medical testing, highlighting both analytical and non-analytical components, particularly the role of biological variation. It outlines methods for calculating combined uncertainties, emphasizing the importance of accurately interpreting test results in clinical contexts. Additionally, the document presents examples and guidelines for integrating biological variability into the assessment of uncertainty, underscoring its impact on clinical decision-making.


![Worked example No. 3 (contd.)
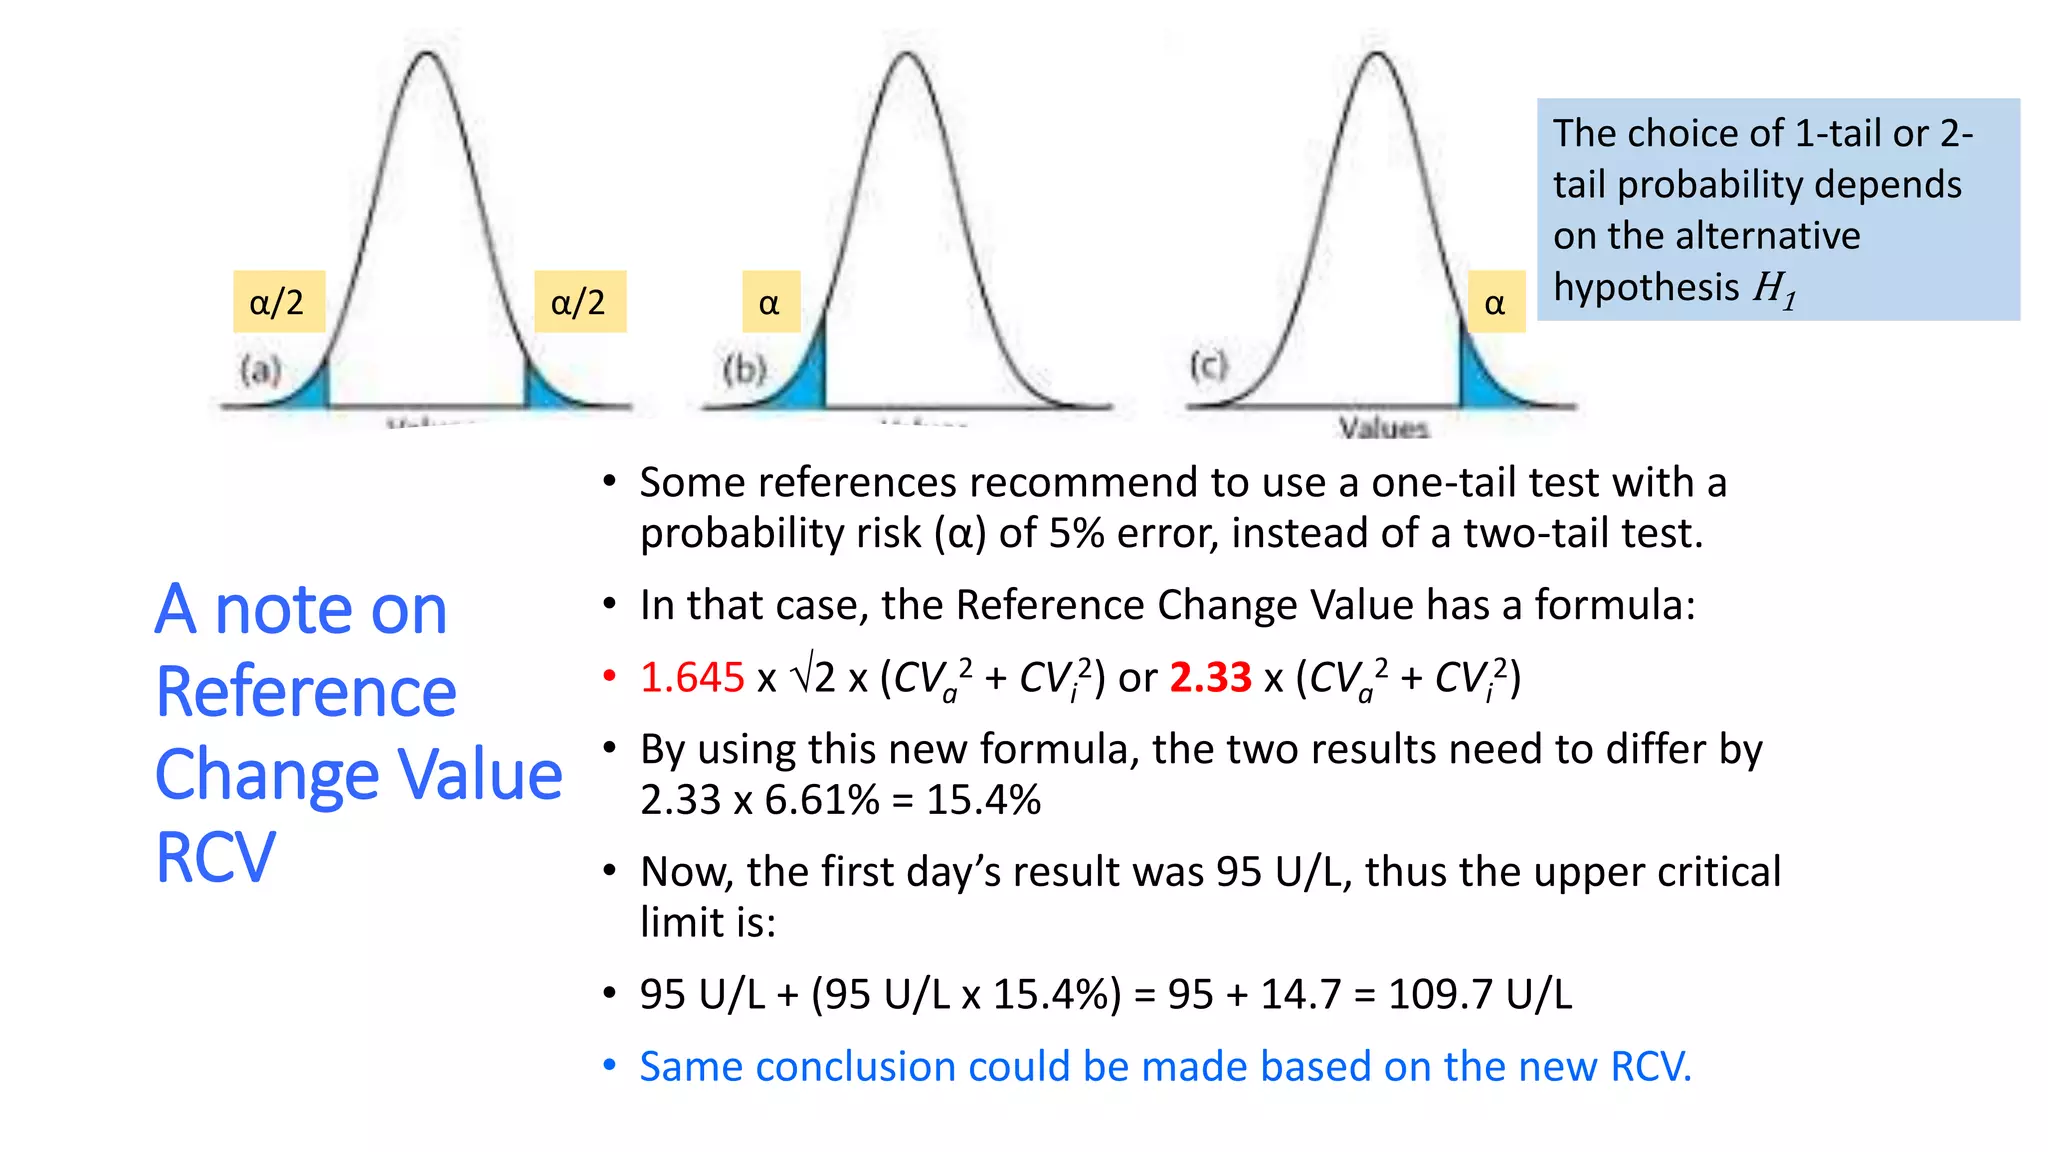
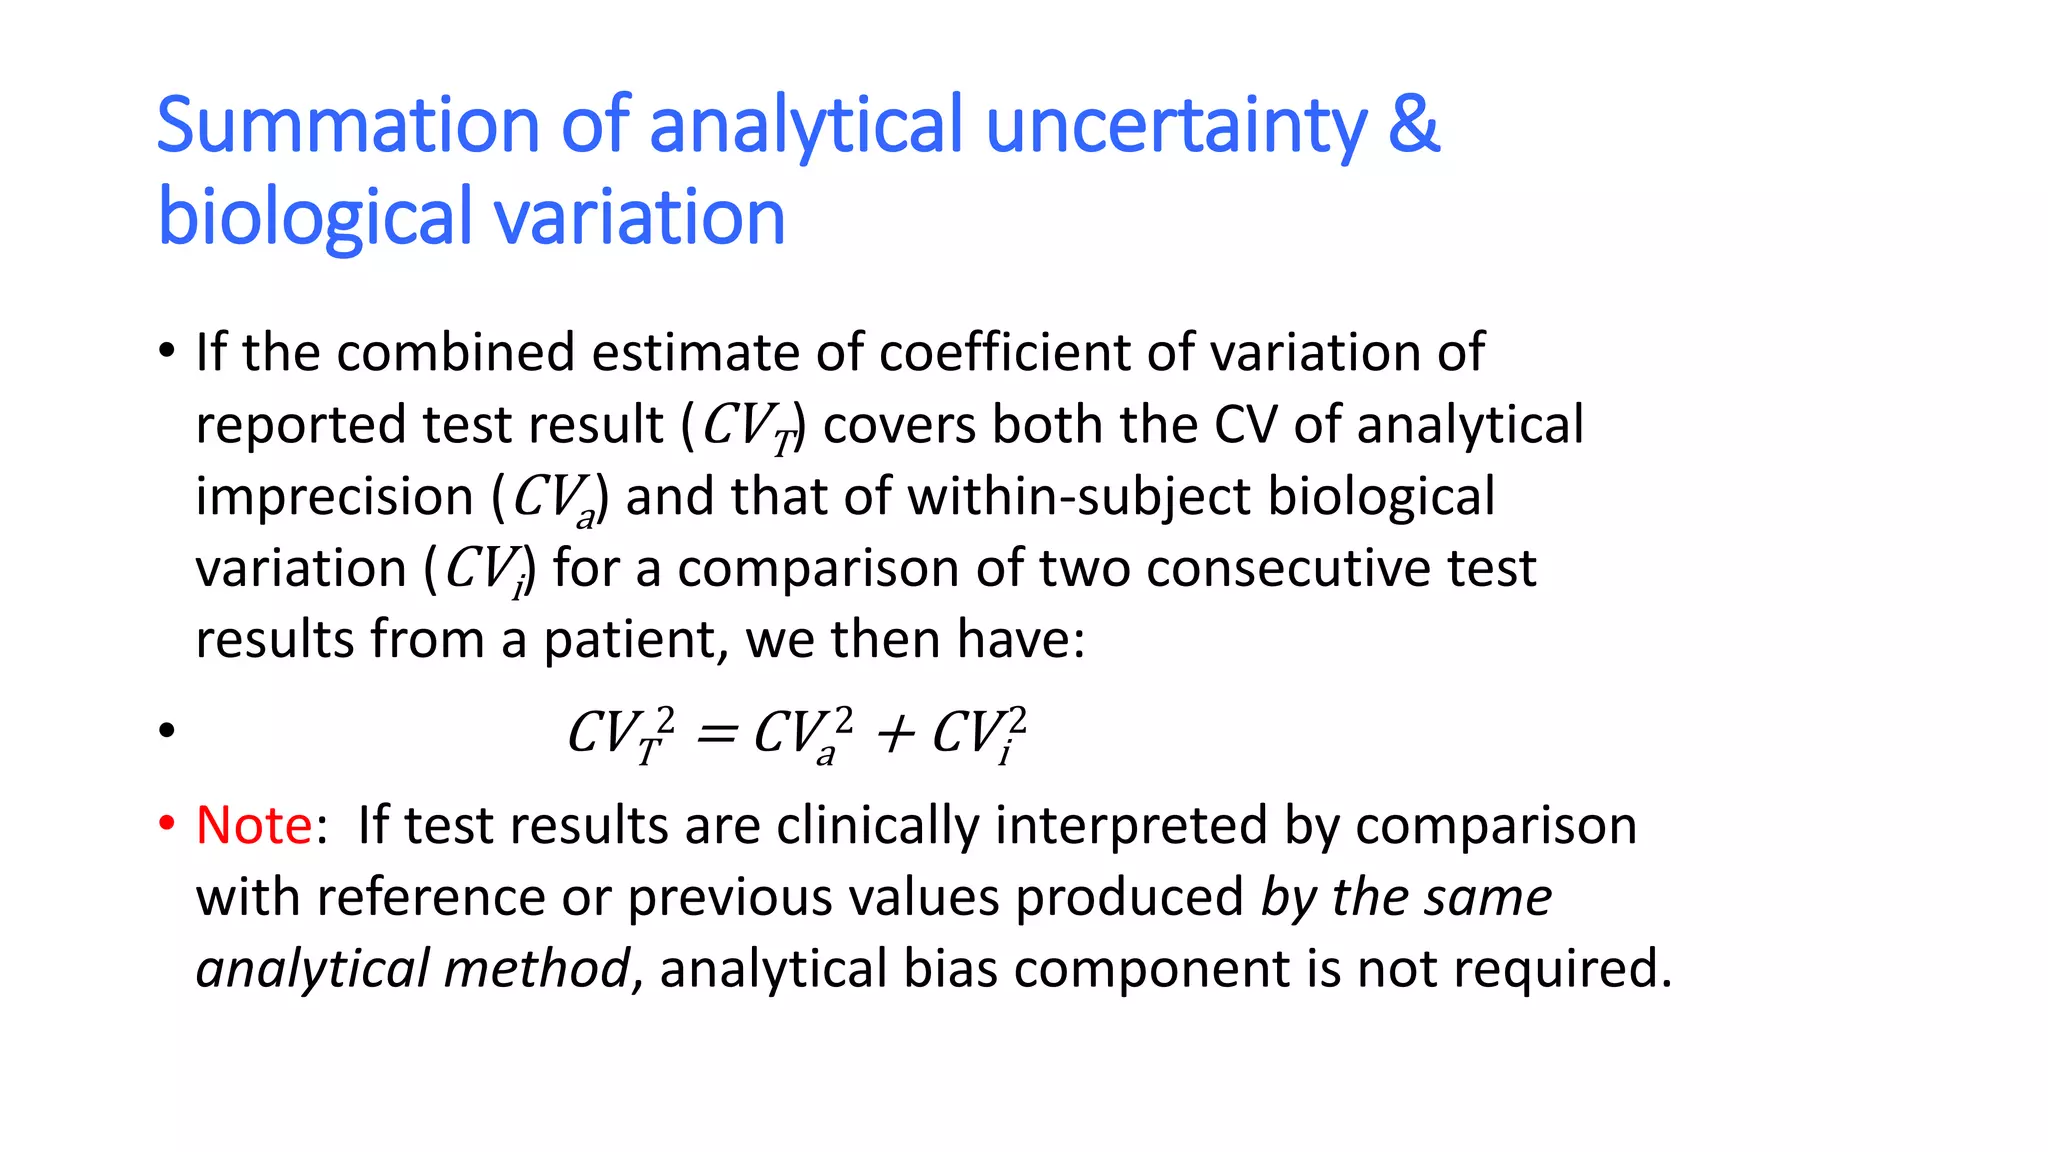
• If the two test results are analytically and biologically different, the “critical difference”
or Reference Change Value (RCV) is to be:
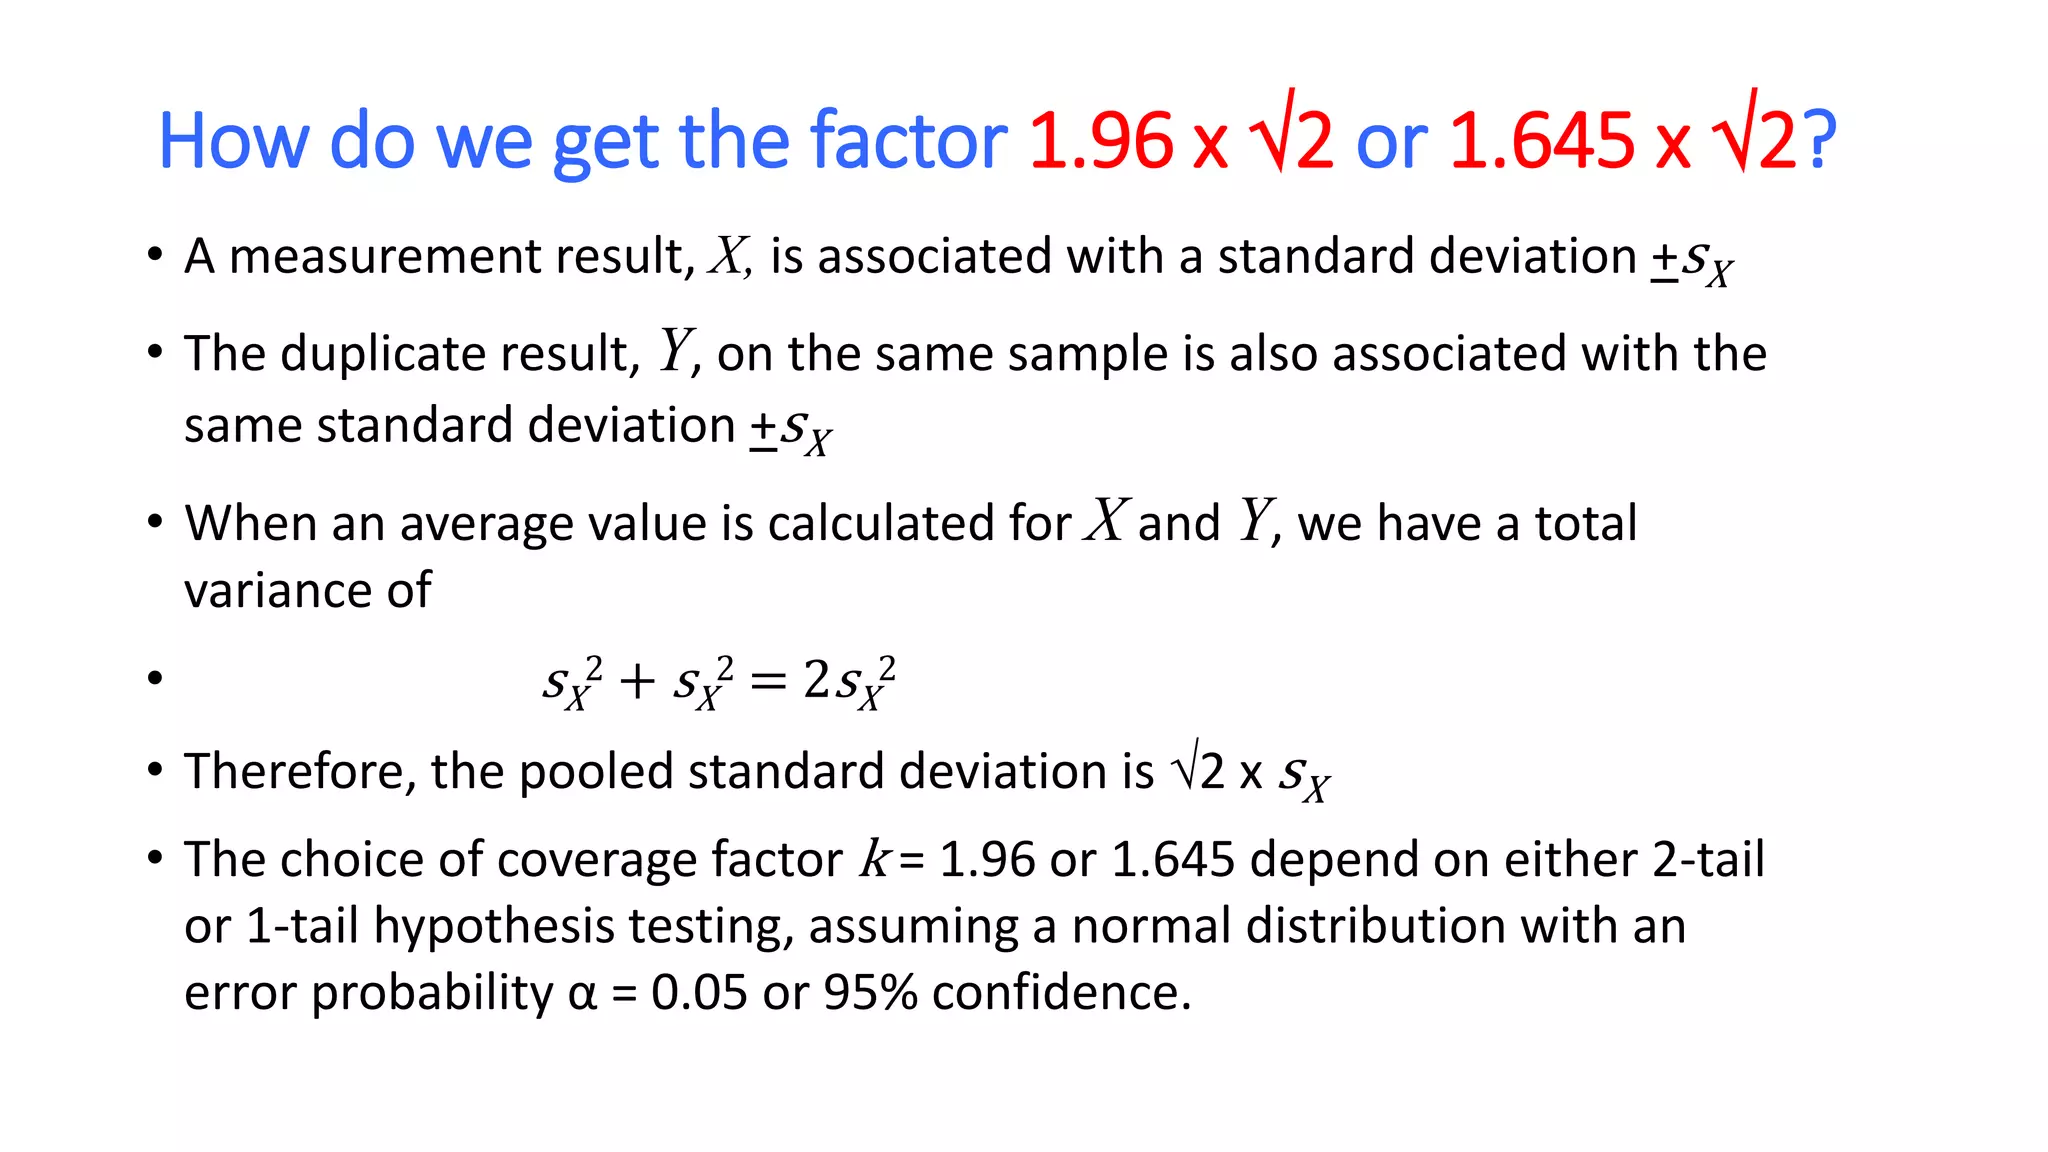
• 1.96 x 2 x (CVa
2 + CVi
2) or 2.77 x (CVa
2 + CVi
2) for 95% confidence
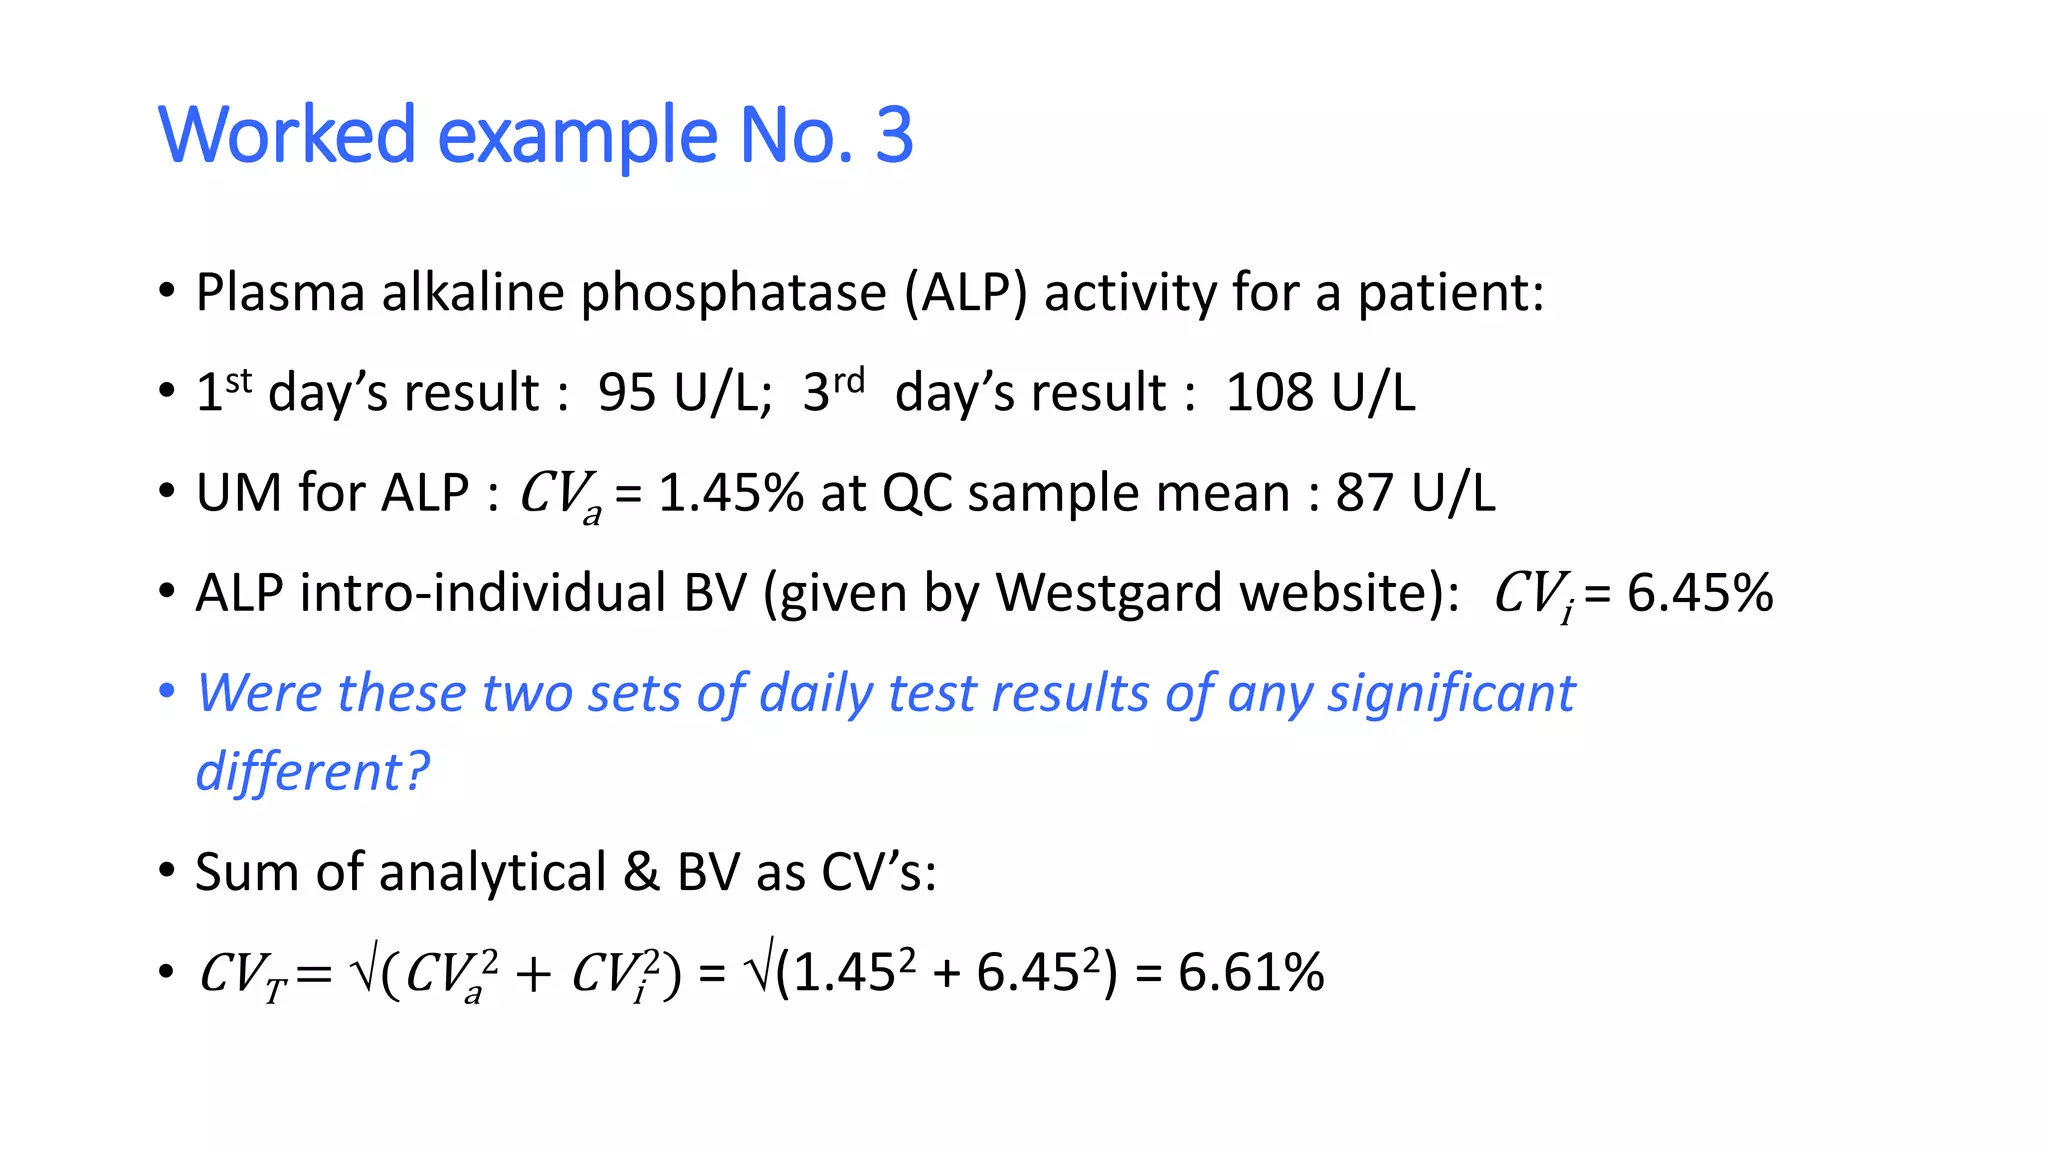
• That means the two results need to differ by 2.77 x 6.61% = 18.3%
• Now, the first day’s result was 95 U/L, thus
• 95 U/L + (95 U/L x 18.3%) = 95 + 17.4 = 112 U/L
• and, 95 U/L - (95 U/L x 18.3%) = 95 - 17.4 = 77.6 U/L
• So, the critical range of expanded uncertainty is [77.6 U/L, 112 U/L]
• The second result would have to be at least 112 U/L for there to be 95% confidence that
it was both analytically and biologically different from the first result. We can therefore
conclude that the test results of 95 U/L and 108 U/L are analytically different, but
probably not biologically different.](https://image.slidesharecdn.com/samlsbiologicalvariationasanucomponent-201204010638/75/Biological-variation-as-an-uncertainty-component-22-2048.jpg)