The document presents a webinar discussing common mistakes in evaluating measurement uncertainty (mu) in laboratory settings. It emphasizes the importance of understanding mu for accuracy, compliance with ISO standards, and confidence in test results, while also highlighting issues such as outdated reports and improper calculation methods. Key concepts include the propagation of uncertainty, the difference between bottom-up and top-down approaches, and the significance of consistent units in mu calculations.

![Propagation Law of Standard Uncertainty (expressed
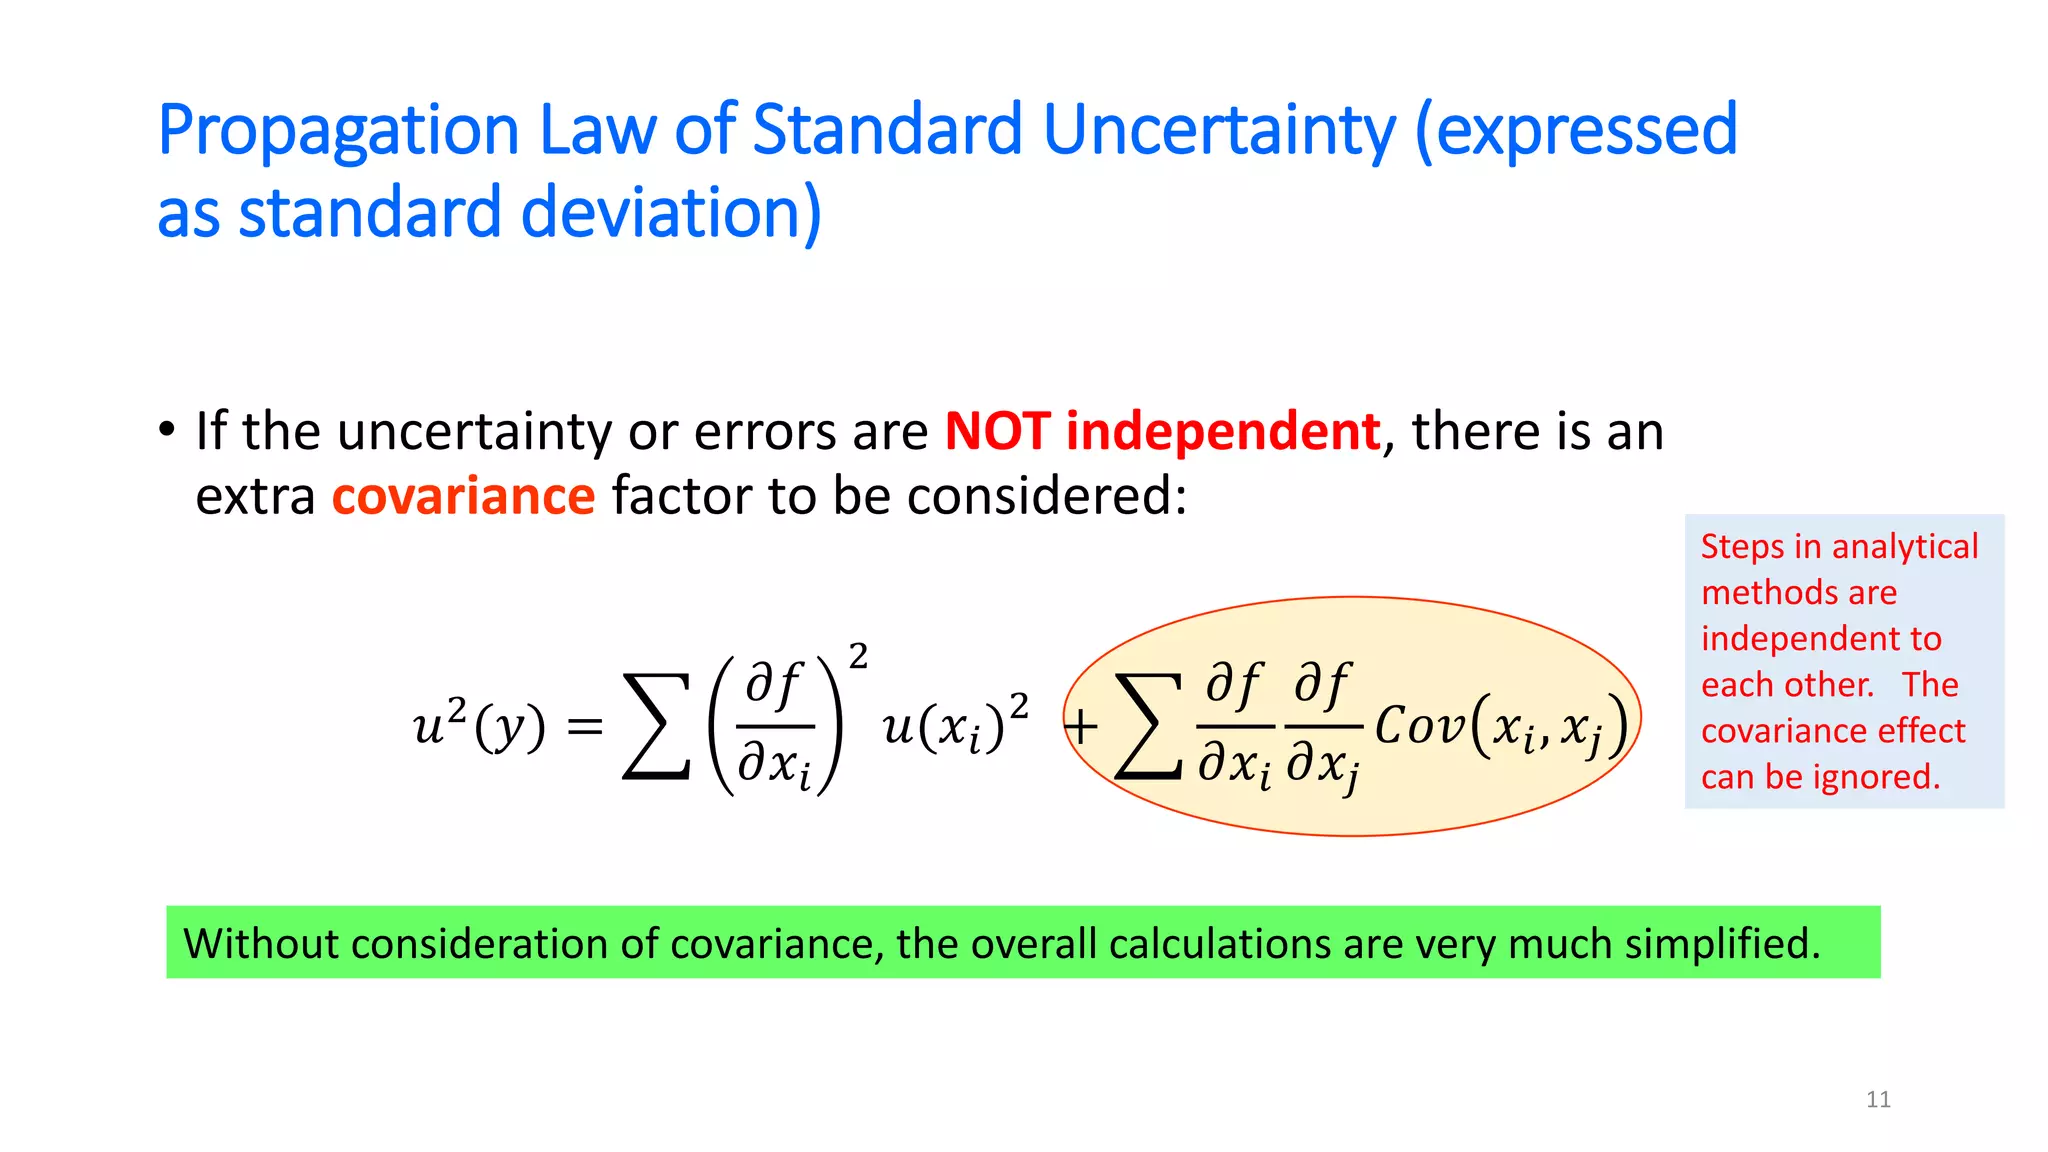
as standard deviation)
• A test method’s outcome, y involves many steps, and each step,
say xi can have a standard uncertainty, expressed as standard
deviation, u(xi), then y is a function of all the xi :
• y = f [x1, x2, x3, …, xn]
• The combined or total uncertainty variance of independent
components is:
• u(y)2 ={[f/x1]2u(x1)2 + [f/x2]2u(x2)2 + [f/x3]2u(x3)2 + .…}
𝑢(𝑦)2 =
𝑖=1
𝑛
𝜕𝑓
𝜕𝑥𝑖
2
𝑢(𝑥𝑖)2
10
Sensitivity coefficient, ci
Total variance = sum of
contributing variances
In statistics,
Variance =
square of standard
deviation, s2 or u2](https://image.slidesharecdn.com/freewebinarmodule9commonmistakesinmucalculations-210618124716/75/Common-mistakes-in-measurement-uncertainty-calculations-10-2048.jpg)