This document provides an overview of big data by discussing its background and definitions. It describes how data has grown exponentially in recent years due to factors like the internet, cloud computing, and internet of things. Big data is defined as data that cannot be processed by traditional technologies due to its huge size, speed of growth, and variety of data types. The document outlines several common definitions of big data, including the 3Vs (volume, velocity, variety) and 4Vs (volume, variety, velocity, value) models. It aims to provide readers with a comprehensive understanding of the emerging field of big data.
![Mobile Netw Appl (2014) 19:171–209
DOI 10.1007/s11036-013-0489-0
Big Data: A Survey
Min Chen · Shiwen Mao · Yunhao Liu
Published online: 22 January 2014
© Springer Science+Business Media New York 2014
Abstract In this paper, we review the background and
state-of-the-art of big data. We first introduce the general
background of big data and review related technologies,
such as could computing, Internet of Things, data centers,
and Hadoop. We then focus on the four phases of the value
chain of big data, i.e., data generation, data acquisition, data
storage, and data analysis. For each phase, we introduce the
general background, discuss the technical challenges, and
review the latest advances. We finally examine the several
representative applications of big data, including enterprise
management, Internet of Things, online social networks,
medial applications, collective intelligence, and smart grid.
These discussions aim to provide a comprehensive overview
and big-picture to readers of this exciting area. This survey
is concluded with a discussion of open problems and future
directions.
Keywords Big data · Cloud computing · Internet of
things · Data center · Hadoop · Smart grid · Big data
analysis
M. Chen ( )
School of Computer Science and Technology,
Huazhong University of Science and Technology,
1037 Luoyu Road, Wuhan, 430074, China
e-mail: minchen2012@hust.edu.cn; minchen@ieee.org
S. Mao
Department of Electrical & Computer Engineering,
Auburn University, 200 Broun Hall, Auburn,
AL 36849-5201, USA
e-mail: smao@ieee.org
Y. Liu
TNLIST, School of Software, Tsinghua University, Beijing, China
e-mail: yunhao@greenorbs.com
1 Background
1.1 Dawn of big data era
Over the past 20 years, data has increased in a large scale
in various fields. According to a report from International
Data Corporation (IDC), in 2011, the overall created and
copied data volume in the world was 1.8ZB (≈ 1021B),
which increased by nearly nine times within five years [1].
This figure will double at least every other two years in the
near future.
Under the explosive increase of global data, the term of
big data is mainly used to describe enormous datasets. Com-
pared with traditional datasets, big data typically includes
masses of unstructured data that need more real-time analy-
sis. In addition, big data also brings about new opportunities
for discovering new values, helps us to gain an in-depth
understanding of the hidden values, and also incurs new
challenges, e.g., how to effectively organize and manage
such datasets.
Recently, industries become interested in the high poten-
tial of big data, and many government agencies announced
major plans to accelerate big data research and applica-
tions [2]. In addition, issues on big data are often covered
in public media, such as The Economist [3, 4], New York
Times [5], and National Public Radio [6, 7]. Two pre-
mier scientific journals, Nature and Science, also opened
special columns to discuss the challenges and impacts of
big data [8, 9]. The era of big data has come beyond all
doubt [10].
Nowadays, big data related to the service of Internet com-
panies grow rapidly. For example, Google processes data of
hundreds of Petabyte (PB), Facebook generates log data of
over 10 PB per month, Baidu, a Chinese company, processes
data of tens of PB, and Taobao, a subsidiary of Alibaba,](https://image.slidesharecdn.com/bigdatasurvey-170106092413/85/Big-data-survey-1-320.jpg)
![Mobile Netw Appl (2014) 19:171–209
DOI 10.1007/s11036-013-0489-0
Big Data: A Survey
Min Chen · Shiwen Mao · Yunhao Liu
Published online: 22 January 2014
© Springer Science+Business Media New York 2014
Abstract In this paper, we review the background and
state-of-the-art of big data. We first introduce the general
background of big data and review related technologies,
such as could computing, Internet of Things, data centers,
and Hadoop. We then focus on the four phases of the value
chain of big data, i.e., data generation, data acquisition, data
storage, and data analysis. For each phase, we introduce the
general background, discuss the technical challenges, and
review the latest advances. We finally examine the several
representative applications of big data, including enterprise
management, Internet of Things, online social networks,
medial applications, collective intelligence, and smart grid.
These discussions aim to provide a comprehensive overview
and big-picture to readers of this exciting area. This survey
is concluded with a discussion of open problems and future
directions.
Keywords Big data · Cloud computing · Internet of
things · Data center · Hadoop · Smart grid · Big data
analysis
M. Chen ( )
School of Computer Science and Technology,
Huazhong University of Science and Technology,
1037 Luoyu Road, Wuhan, 430074, China
e-mail: minchen2012@hust.edu.cn; minchen@ieee.org
S. Mao
Department of Electrical & Computer Engineering,
Auburn University, 200 Broun Hall, Auburn,
AL 36849-5201, USA
e-mail: smao@ieee.org
Y. Liu
TNLIST, School of Software, Tsinghua University, Beijing, China
e-mail: yunhao@greenorbs.com
1 Background
1.1 Dawn of big data era
Over the past 20 years, data has increased in a large scale
in various fields. According to a report from International
Data Corporation (IDC), in 2011, the overall created and
copied data volume in the world was 1.8ZB (≈ 1021B),
which increased by nearly nine times within five years [1].
This figure will double at least every other two years in the
near future.
Under the explosive increase of global data, the term of
big data is mainly used to describe enormous datasets. Com-
pared with traditional datasets, big data typically includes
masses of unstructured data that need more real-time analy-
sis. In addition, big data also brings about new opportunities
for discovering new values, helps us to gain an in-depth
understanding of the hidden values, and also incurs new
challenges, e.g., how to effectively organize and manage
such datasets.
Recently, industries become interested in the high poten-
tial of big data, and many government agencies announced
major plans to accelerate big data research and applica-
tions [2]. In addition, issues on big data are often covered
in public media, such as The Economist [3, 4], New York
Times [5], and National Public Radio [6, 7]. Two pre-
mier scientific journals, Nature and Science, also opened
special columns to discuss the challenges and impacts of
big data [8, 9]. The era of big data has come beyond all
doubt [10].
Nowadays, big data related to the service of Internet com-
panies grow rapidly. For example, Google processes data of
hundreds of Petabyte (PB), Facebook generates log data of
over 10 PB per month, Baidu, a Chinese company, processes
data of tens of PB, and Taobao, a subsidiary of Alibaba,](https://image.slidesharecdn.com/bigdatasurvey-170106092413/75/Big-data-survey-1-2048.jpg)
![172 Mobile Netw Appl (2014) 19:171–209
generates data of tens of Terabyte (TB) for online trading
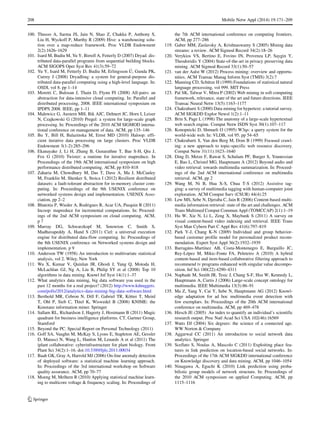
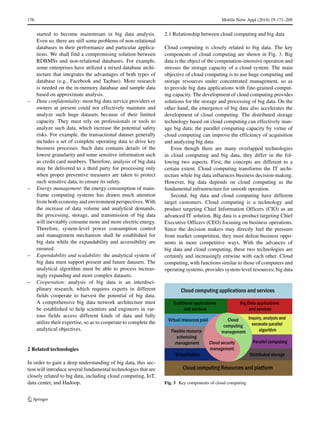
per day. Figure 1 illustrates the boom of the global data vol-
ume. While the amount of large datasets is drastically rising,
it also brings about many challenging problems demanding
prompt solutions:
– The latest advances of information technology (IT)
make it more easily to generate data. For example, on
average, 72 hours of videos are uploaded to YouTube
in every minute [11]. Therefore, we are confronted with
the main challenge of collecting and integrating massive
data from widely distributed data sources.
– The rapid growth of cloud computing and the Internet of
Things (IoT) further promote the sharp growth of data.
Cloud computing provides safeguarding, access sites
and channels for data asset. In the paradigm of IoT, sen-
sors all over the world are collecting and transmitting
data to be stored and processed in the cloud. Such data
in both quantity and mutual relations will far surpass
the capacities of the IT architectures and infrastruc-
ture of existing enterprises, and its realtime requirement
will also greatly stress the available computing capacity.
The increasingly growing data cause a problem of how
to store and manage such huge heterogeneous datasets
with moderate requirements on hardware and software
infrastructure.
– In consideration of the heterogeneity, scalability, real-
time, complexity, and privacy of big data, we shall
effectively “mine” the datasets at different levels during
the analysis, modeling, visualization, and forecasting,
so as to reveal its intrinsic property and improve the
decision making.
1.2 Definition and features of big data
Big data is an abstract concept. Apart from masses of data,
it also has some other features, which determine the differ-
ence between itself and “massive data” or “very big data.”
Fig. 1 The continuously
increasing big data](https://image.slidesharecdn.com/bigdatasurvey-170106092413/85/Big-data-survey-2-320.jpg)
![Mobile Netw Appl (2014) 19:171–209 173
At present, although the importance of big data has been
generally recognized, people still have different opinions on
its definition. In general, big data shall mean the datasets
that could not be perceived, acquired, managed, and pro-
cessed by traditional IT and software/hardware tools within
a tolerable time. Because of different concerns, scientific
and technological enterprises, research scholars, data ana-
lysts, and technical practitioners have different definitions
of big data. The following definitions may help us have a
better understanding on the profound social, economic, and
technological connotations of big data.
In 2010, Apache Hadoop defined big data as “datasets
which could not be captured, managed, and processed by
general computers within an acceptable scope.” On the basis
of this definition, in May 2011, McKinsey & Company, a
global consulting agency announced Big Data as the next
frontier for innovation, competition, and productivity. Big
data shall mean such datasets which could not be acquired,
stored, and managed by classic database software. This def-
inition includes two connotations: First, datasets’ volumes
that conform to the standard of big data are changing, and
may grow over time or with technological advances; Sec-
ond, datasets’ volumes that conform to the standard of big
data in different applications differ from each other. At
present, big data generally ranges from several TB to sev-
eral PB [10]. From the definition by McKinsey & Company,
it can be seen that the volume of a dataset is not the only
criterion for big data. The increasingly growing data scale
and its management that could not be handled by traditional
database technologies are the next two key features.
As a matter of fact, big data has been defined as early
as 2001. Doug Laney, an analyst of META (presently
Gartner) defined challenges and opportunities brought about
by increased data with a 3Vs model, i.e., the increase of
Volume, Velocity, and Variety, in a research report [12].
Although such a model was not originally used to define
big data, Gartner and many other enterprises, including
IBM [13] and some research departments of Microsoft [14]
still used the “3Vs” model to describe big data within
the following ten years [15]. In the “3Vs” model, Volume
means, with the generation and collection of masses of
data, data scale becomes increasingly big; Velocity means
the timeliness of big data, specifically, data collection and
analysis, etc. must be rapidly and timely conducted, so as
to maximumly utilize the commercial value of big data;
Variety indicates the various types of data, which include
semi-structured and unstructured data such as audio, video,
webpage, and text, as well as traditional structured data.
However, others have different opinions, including IDC,
one of the most influential leaders in big data and its
research fields. In 2011, an IDC report defined big data as
“big data technologies describe a new generation of tech-
nologies and architectures, designed to economically extract
value from very large volumes of a wide variety of data, by
enabling the high-velocity capture, discovery, and/or anal-
ysis.” [1] With this definition, characteristics of big data
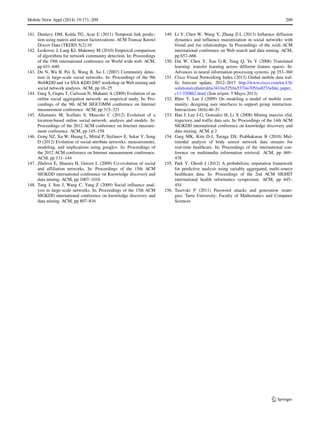
may be summarized as four Vs, i.e., Volume (great volume),
Variety (various modalities), Velocity (rapid generation),
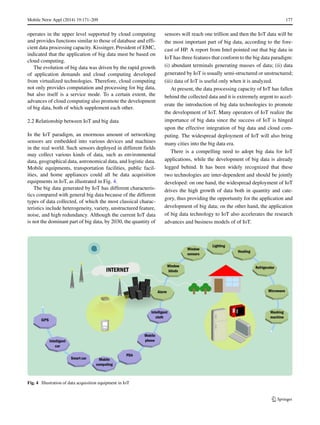
and Value (huge value but very low density), as shown in
Fig. 2. Such 4Vs definition was widely recognized since
it highlights the meaning and necessity of big data, i.e.,
exploring the huge hidden values. This definition indicates
the most critical problem in big data, which is how to dis-
cover values from datasets with an enormous scale, various
types, and rapid generation. As Jay Parikh, Deputy Chief
Engineer of Facebook, said, “You could only own a bunch
of data other than big data if you do not utilize the collected
data.” [11]
In addition, NIST defines big data as “Big data shall
mean the data of which the data volume, acquisition speed,
or data representation limits the capacity of using traditional
relational methods to conduct effective analysis or the data
which may be effectively processed with important horizon-
tal zoom technologies”, which focuses on the technological
aspect of big data. It indicates that efficient methods or
technologies need to be developed and used to analyze and
process big data.
There have been considerable discussions from both
industry and academia on the definition of big data [16, 17].
In addition to developing a proper definition, the big data
research should also focus on how to extract its value, how
to use data, and how to transform “a bunch of data” into “big
data.”
1.3 Big data value
McKinsey & Company observed how big data created val-
ues after in-depth research on the U.S. healthcare, the EU
public sector administration, the U.S. retail, the global man-
ufacturing, and the global personal location data. Through
research on the five core industries that represent the global
economy, the McKinsey report pointed out that big data
may give a full play to the economic function, improve the
productivity and competitiveness of enterprises and public
sectors, and create huge benefits for consumers. In [10],
McKinsey summarized the values that big data could cre-
ate: if big data could be creatively and effectively utilized
to improve efficiency and quality, the potential value of
the U.S medical industry gained through data may surpass
USD 300 billion, thus reducing the expenditure for the U.S.
healthcare by over 8 %; retailers that fully utilize big data
may improve their profit by more than 60 %; big data may
also be utilized to improve the efficiency of government
operations, such that the developed economies in Europe
could save over EUR 100 billion (which excludes the effect
of reduced frauds, errors, and tax difference).](https://image.slidesharecdn.com/bigdatasurvey-170106092413/85/Big-data-survey-3-320.jpg)
![174 Mobile Netw Appl (2014) 19:171–209
Fig. 2 The 4Vs feature of big data
The McKinsey report is regarded as prospective and
predictive, while the following facts may validate the val-
ues of big data. During the 2009 flu pandemic, Google
obtained timely information by analyzing big data, which
even provided more valuable information than that provided
by disease prevention centers. Nearly all countries required
hospitals inform agencies such as disease prevention centers
of the new type of influenza cases. However, patients usu-
ally did not see doctors immediately when they got infected.
It also took some time to send information from hospitals to
disease prevention centers, and for disease prevention cen-
ters to analyze and summarize such information. Therefore,
when the public is aware of the pandemic of the new type
of influenza, the disease may have already spread for one to
two weeks with a hysteretic nature. Google found that dur-
ing the spreading of influenza, entries frequently sought at
its search engines would be different from those at ordinary
times, and the use frequencies of the entries were corre-
lated to the influenza spreading in both time and location.
Google found 45 search entry groups that were closely rel-
evant to the outbreak of influenza and incorporated them
in specific mathematic models to forecast the spreading of
influenza and even to predict places where influenza spread
from. The related research results have been published in
Nature [18].
In 2008, Microsoft purchased Farecast, a sci-tech venture
company in the U.S. Farecast has an airline ticket forecast
system that predicts the trends and rising/dropping ranges of
airline ticket price. The system has been incorporated into
the Bing search engine of Microsoft. By 2012, the system
has saved nearly USD 50 per ticket per passenger, with the
forecasted accuracy as high as 75 %.
At present, data has become an important production fac-
tor that could be comparable to material assets and human
capital. As multimedia, social media, and IoT are devel-
oping, enterprises will collect more information, leading
to an exponential growth of data volume. Big data will
have a huge and increasing potential in creating values for
businesses and consumers.
1.4 The development of big data
In the late 1970s, the concept of “database machine”
emerged, which is a technology specially used for stor-
ing and analyzing data. With the increase of data volume,
the storage and processing capacity of a single mainframe
computer system became inadequate. In the 1980s, peo-
ple proposed “share nothing,” a parallel database system, to
meet the demand of the increasing data volume [19]. The
share nothing system architecture is based on the use of
cluster and every machine has its own processor, storage,
and disk. Teradata system was the first successful com-
mercial parallel database system. Such database became
very popular lately. On June 2, 1986, a milestone event
occurred when Teradata delivered the first parallel database
system with the storage capacity of 1TB to Kmart to help
the large-scale retail company in North America to expand
its data warehouse [20]. In the late 1990s, the advantages
of parallel database was widely recognized in the database
field.
However, many challenges on big data arose. With the
development of Internet servies, indexes and queried con-
tents were rapidly growing. Therefore, search engine com-
panies had to face the challenges of handling such big data.
Google created GFS [21] and MapReduce [22] program-
ming models to cope with the challenges brought about
by data management and analysis at the Internet scale. In
addition, contents generated by users, sensors, and other
ubiquitous data sources also feuled the overwhelming data
flows, which required a fundamental change on the comput-
ing architecture and large-scale data processing mechanism.
In January 2007, Jim Gray, a pioneer of database software,](https://image.slidesharecdn.com/bigdatasurvey-170106092413/85/Big-data-survey-4-320.jpg)
![Mobile Netw Appl (2014) 19:171–209 175
called such transformation “The Fourth Paradigm” [23]. He
also thought the only way to cope with such paradigm was
to develop a new generation of computing tools to manage,
visualize, and analyze massive data. In June 2011, another
milestone event occurred; EMC/IDC published a research
report titled Extracting Values from Chaos [1], which intro-
duced the concept and potential of big data for the first
time. This research report triggered the great interest in both
industry and academia on big data.
Over the past few years, nearly all major companies,
including EMC, Oracle, IBM, Microsoft, Google, Ama-
zon, and Facebook, etc. have started their big data projects.
Taking IBM as an example, since 2005, IBM has invested
USD 16 billion on 30 acquisitions related to big data. In
academia, big data was also under the spotlight. In 2008,
Nature published a big data special issue. In 2011, Science
also launched a special issue on the key technologies of
“data processing” in big data. In 2012, European Research
Consortium for Informatics and Mathematics (ERCIM)
News published a special issue on big data. In the beginning
of 2012, a report titled Big Data, Big Impact presented at the
Davos Forum in Switzerland, announced that big data has
become a new kind of economic assets, just like currency
or gold. Gartner, an international research agency, issued
Hype Cycles from 2012 to 2013, which classified big data
computing, social analysis, and stored data analysis into 48
emerging technologies that deserve most attention.
Many national governments such as the U.S. also paid
great attention to big data. In March 2012, the Obama
Administration announced a USD 200 million investment
to launch the “Big Data Research and Development Plan,”
which was a second major scientific and technological
development initiative after the “Information Highway” ini-
tiative in 1993. In July 2012, the “Vigorous ICT Japan”
project issued by Japan’s Ministry of Internal Affairs and
Communications indicated that the big data development
should be a national strategy and application technologies
should be the focus. In July 2012, the United Nations issued
Big Data for Development report, which summarized how
governments utilized big data to better serve and protect
their people.
1.5 Challenges of big data
The sharply increasing data deluge in the big data era
brings about huge challenges on data acquisition, storage,
management and analysis. Traditional data management
and analysis systems are based on the relational database
management system (RDBMS). However, such RDBMSs
only apply to structured data, other than semi-structured or
unstructured data. In addition, RDBMSs are increasingly
utilizing more and more expensive hardware. It is appar-
ently that the traditional RDBMSs could not handle the
huge volume and heterogeneity of big data. The research
community has proposed some solutions from different per-
spectives. For example, cloud computing is utilized to meet
the requirements on infrastructure for big data, e.g., cost
efficiency, elasticity, and smooth upgrading/downgrading.
For solutions of permanent storage and management of
large-scale disordered datasets, distributed file systems [24]
and NoSQL [25] databases are good choices. Such program-
ming frameworks have achieved great success in processing
clustered tasks, especially for webpage ranking. Various big
data applications can be developed based on these innova-
tive technologies or platforms. Moreover, it is non-trivial to
deploy the big data analysis systems.
Some literature [26–28] discuss obstacles in the develop-
ment of big data applications. The key challenges are listed
as follows:
– Data representation: many datasets have certain levels
of heterogeneity in type, structure, semantics, organiza-
tion, granularity, and accessibility. Data representation
aims to make data more meaningful for computer anal-
ysis and user interpretation. Nevertheless, an improper
data representation will reduce the value of the origi-
nal data and may even obstruct effective data analysis.
Efficient data representation shall reflect data structure,
class, and type, as well as integrated technologies, so as
to enable efficient operations on different datasets.
– Redundancy reduction and data compression: gener-
ally, there is a high level of redundancy in datasets.
Redundancy reduction and data compression is effec-
tive to reduce the indirect cost of the entire system on
the premise that the potential values of the data are not
affected. For example, most data generated by sensor
networks are highly redundant, which may be filtered
and compressed at orders of magnitude.
– Data life cycle management: compared with the rel-
atively slow advances of storage systems, pervasive
sensing and computing are generating data at unprece-
dented rates and scales. We are confronted with a lot
of pressing challenges, one of which is that the current
storage system could not support such massive data.
Generally speaking, values hidden in big data depend
on data freshness. Therefore, a data importance princi-
ple related to the analytical value should be developed
to decide which data shall be stored and which data
shall be discarded.
– Analytical mechanism: the analytical system of big data
shall process masses of heterogeneous data within a
limited time. However, traditional RDBMSs are strictly
designed with a lack of scalability and expandability,
which could not meet the performance requirements.
Non-relational databases have shown their unique
advantages in the processing of unstructured data and](https://image.slidesharecdn.com/bigdatasurvey-170106092413/85/Big-data-survey-5-320.jpg)
![178 Mobile Netw Appl (2014) 19:171–209
2.3 Data center
In the big data paradigm, the data center not only is a plat-
form for concentrated storage of data, but also undertakes
more responsibilities, such as acquiring data, managing
data, organizing data, and leveraging the data values and
functions. Data centers mainly concern “data” other than
“center.” It has masses of data and organizes and man-
ages data according to its core objective and development
path, which is more valuable than owning a good site and
resource. The emergence of big data brings about sound
development opportunities and great challenges to data cen-
ters. Big data is an emerging paradigm, which will promote
the explosive growth of the infrastructure and related soft-
ware of data center. The physical data center network is
the core for supporting big data, but, at present, is the key
infrastructure that is most urgently required [29].
– Big data requires data center provide powerful back-
stage support. The big data paradigm has more strin-
gent requirements on storage capacity and processing
capacity, as well as network transmission capacity.
Enterprises must take the development of data centers
into consideration to improve the capacity of rapidly
and effectively processing of big data under limited
price/performance ratio. The data center shall provide
the infrastructure with a large number of nodes, build a
high-speed internal network, effectively dissipate heat,
and effective backup data. Only when a highly energy-
efficient, stable, safe, expandable, and redundant data
center is built, the normal operation of big data applica-
tions may be ensured.
– The growth of big data applications accelerates the
revolution and innovation of data centers. Many big
data applications have developed their unique architec-
tures and directly promote the development of storage,
network, and computing technologies related to data
center. With the continued growth of the volumes of
structured and unstructured data, and the variety of
sources of analytical data, the data processing and com-
puting capacities of the data center shall be greatly
enhanced. In addition, as the scale of data center is
increasingly expanding, it is also an important issue on
how to reduce the operational cost for the development
of data centers.
– Big data endows more functions to the data center. In
the big data paradigm, data center shall not only con-
cern with hardware facilities but also strengthen soft
capacities, i.e., the capacities of acquisition, processing,
organization, analysis, and application of big data. The
data center may help business personnel analyze the
existing data, discover problems in business operation,
and develop solutions from big data.
2.4 Relationship between hadoop and big data
Presently, Hadoop is widely used in big data applications in
the industry, e.g., spam filtering, network searching, click-
stream analysis, and social recommendation. In addition,
considerable academic research is now based on Hadoop.
Some representative cases are given below. As declared
in June 2012, Yahoo runs Hadoop in 42,000 servers at
four data centers to support its products and services, e.g.,
searching and spam filtering, etc. At present, the biggest
Hadoop cluster has 4,000 nodes, but the number of nodes
will be increased to 10,000 with the release of Hadoop 2.0.
In the same month, Facebook announced that their Hadoop
cluster can process 100 PB data, which grew by 0.5 PB per
day as in November 2012. Some well-known agencies that
use Hadoop to conduct distributed computation are listed
in [30]. In addition, many companies provide Hadoop com-
mercial execution and/or support, including Cloudera, IBM,
MapR, EMC, and Oracle.
Among modern industrial machinery and systems, sen-
sors are widely deployed to collect information for environ-
ment monitoring and failure forecasting, etc. Bahga and oth-
ers in [31] proposed a framework for data organization and
cloud computing infrastructure, termed CloudView. Cloud-
View uses mixed architectures, local nodes, and remote
clusters based on Hadoop to analyze machine-generated
data. Local nodes are used for the forecast of real-time fail-
ures; clusters based on Hadoop are used for complex offline
analysis, e.g., case-driven data analysis.
The exponential growth of the genome data and the sharp
drop of sequencing cost transform bio-science and bio-
medicine to data-driven science. Gunarathne et al. in [32]
utilized cloud computing infrastructures, Amazon AWS,
Microsoft Azune, and data processing framework based
on MapReduce, Hadoop, and Microsoft DryadLINQ to
run two parallel bio-medicine applications: (i) assembly of
genome segments; (ii) dimension reduction in the analy-
sis of chemical structure. In the subsequent application, the
166-D datasets used include 26,000,000 data points. The
authors compared the performance of all the frameworks in
terms of efficiency, cost, and availability. According to the
study, the authors concluded that the loose coupling will be
increasingly applied to research on electron cloud, and the
parallel programming technology (MapReduce) framework
may provide the user an interface with more convenient
services and reduce unnecessary costs.
3 Big data generation and acquisition
We have introduced several key technologies related to big
data, i.e., cloud computing, IoT, data center, and Hadoop.
Next, we will focus on the value chain of big data, which](https://image.slidesharecdn.com/bigdatasurvey-170106092413/85/Big-data-survey-8-320.jpg)
![Mobile Netw Appl (2014) 19:171–209 179
can be generally divided into four phases: data generation,
data acquisition, data storage, and data analysis. If we take
data as a raw material, data generation and data acquisition
are an exploitation process, data storage is a storage process,
and data analysis is a production process that utilizes the
raw material to create new value.
3.1 Data generation
Data generation is the first step of big data. Given Inter-
net data as an example, huge amount of data in terms of
searching entries, Internet forum posts, chatting records, and
microblog messages, are generated. Those data are closely
related to people’s daily life, and have similar features of
high value and low density. Such Internet data may be
valueless individually, but, through the exploitation of accu-
mulated big data, useful information such as habits and
hobbies of users can be identified, and it is even possible to
forecast users’ behaviors and emotional moods.
Moreover, generated through longitudinal and/or dis-
tributed data sources, datasets are more large-scale, highly
diverse, and complex. Such data sources include sensors,
videos, clickstreams, and/or all other available data sources.
At present, main sources of big data are the operation
and trading information in enterprises, logistic and sens-
ing information in the IoT, human interaction information
and position information in the Internet world, and data
generated in scientific research, etc. The information far sur-
passes the capacities of IT architectures and infrastructures
of existing enterprises, while its real time requirement also
greatly stresses the existing computing capacity.
3.1.1 Enterprise data
In 2013, IBM issued Analysis: the Applications of Big Data
to the Real World, which indicates that the internal data of
enterprises are the main sources of big data. The internal
data of enterprises mainly consists of online trading data and
online analysis data, most of which are historically static
data and are managed by RDBMSs in a structured man-
ner. In addition, production data, inventory data, sales data,
and financial data, etc., also constitute enterprise internal
data, which aims to capture informationized and data-driven
activities in enterprises, so as to record all activities of
enterprises in the form of internal data.
Over the past decades, IT and digital data have con-
tributed a lot to improve the profitability of business depart-
ments. It is estimated that the business data volume of all
companies in the world may double every 1.2 years [10],
in which, the business turnover through the Internet, enter-
prises to enterprises, and enterprises to consumers per day
will reach USD 450 billion [33]. The continuously increas-
ing business data volume requires more effective real-time
analysis so as to fully harvest its potential. For example,
Amazon processes millions of terminal operations and more
than 500,000 queries from third-party sellers per day [12].
Walmart processes one million customer trades per hour and
such trading data are imported into a database with a capac-
ity of over 2.5PB [3]. Akamai analyzes 75 million events
per day for its target advertisements [13].
3.1.2 IoT data
As discussed, IoT is an important source of big data. Among
smart cities constructed based on IoT, big data may come
from industry, agriculture, traffic, transportation, medical
care, public departments, and families, etc.
According to the processes of data acquisition and trans-
mission in IoT, its network architecture may be divided
into three layers: the sensing layer, the network layer, and
the application layer. The sensing layer is responsible for
data acquisition and mainly consists of sensor networks.
The network layer is responsible for information transmis-
sion and processing, where close transmission may rely on
sensor networks, and remote transmission shall depend on
the Internet. Finally, the application layer support specific
applications of IoT.
According to characteristics of Internet of Things, the
data generated from IoT has the following features:
– Large-scale data: in IoT, masses of data acquisi-
tion equipments are distributedly deployed, which may
acquire simple numeric data, e.g., location; or complex
multimedia data, e.g., surveillance video. In order to
meet the demands of analysis and processing, not only
the currently acquired data, but also the historical data
within a certain time frame should be stored. Therefore,
data generated by IoT are characterized by large scales.
– Heterogeneity: because of the variety data acquisition
devices, the acquired data is also different and such data
features heterogeneity.
– Strong time and space correlation: in IoT, every data
acquisition device are placed at a specific geographic
location and every piece of data has time stamp. The
time and space correlation are an important property
of data from IoT. During data analysis and process-
ing, time and space are also important dimensions for
statistical analysis.
– Effective data accounts for only a small portion of the
big data: a great quantity of noises may occur dur-
ing the acquisition and transmission of data in IoT.
Among datasets acquired by acquisition devices, only a
small amount of abnormal data is valuable. For exam-
ple, during the acquisition of traffic video, the few video
frames that capture the violation of traffic regulations](https://image.slidesharecdn.com/bigdatasurvey-170106092413/85/Big-data-survey-9-320.jpg)
![180 Mobile Netw Appl (2014) 19:171–209
and traffic accidents are more valuable than those only
capturing the normal flow of traffic.
3.1.3 Bio-medical data
As a series of high-throughput bio-measurement technolo-
gies are innovatively developed in the beginning of the
21st century, the frontier research in the bio-medicine field
also enters the era of big data. By constructing smart,
efficient, and accurate analytical models and theoretical sys-
tems for bio-medicine applications, the essential governing
mechanism behind complex biological phenomena may be
revealed. Not only the future development of bio-medicine
can be determined, but also the leading roles can be assumed
in the development of a series of important strategic indus-
tries related to the national economy, people’s livelihood,
and national security, with important applications such as
medical care, new drug R & D, and grain production (e.g.,
transgenic crops).
The completion of HGP (Human Genome Project) and
the continued development of sequencing technology also
lead to widespread applications of big data in the field.
The masses of data generated by gene sequencing go
through specialized analysis according to different applica-
tion demands, to combine it with the clinical gene diag-
nosis and provide valuable information for early diagnosis
and personalized treatment of disease. One sequencing of
human gene may generate 100 600GB raw data. In the
China National Genebank in Shenzhen, there are 1.3 mil-
lion samples including 1.15 million human samples and
150,000 animal, plant, and microorganism samples. By the
end of 2013, 10 million traceable biological samples will
be stored, and by the end of 2015, this figure will reach
30 million. It is predictable that, with the development of
bio-medicine technologies, gene sequencing will become
faster and more convenient, and thus making big data of
bio-medicine continuously grow beyond all doubt.
In addition, data generated from clinical medical care and
medical R & D also rise quickly. For example, the Uni-
versity of Pittsburgh Medical Center (UPMC) has stored
2TB such data. Explorys, an American company, provides
platforms to collocate clinical data, operation and mainte-
nance data, and financial data. At present, about 13 million
people’s information have been collocated, with 44 arti-
cles of data at the scale of about 60TB, which will reach
70TB in 2013. Practice Fusion, another American com-
pany, manages electronic medical records of about 200,000
patients.
Apart from such small and medium-sized enterprises,
other well-known IT companies, such as Google, Microsoft,
and IBM have invested extensively in the research and com-
putational analysis of methods related to high-throughput
biological big data, for shares in the huge market as known
as the “Next Internet.” IBM forecasts, in the 2013 Strategy
Conference, that with the sharp increase of medical images
and electronic medical records, medical professionals may
utilize big data to extract useful clinical information from
masses of data to obtain a medical history and forecast treat-
ment effects, thus improving patient care and reduce cost.
It is anticipated that, by 2015, the average data volume of
every hospital will increase from 167TB to 665TB.
3.1.4 Data generation from other fields
As scientific applications are increasing, the scale of
datasets is gradually expanding, and the development of
some disciplines greatly relies on the analysis of masses of
data. Here, we examine several such applications. Although
being in different scientific fields, the applications have
similar and increasing demand on data analysis. The first
example is related to computational biology. GenBank is
a nucleotide sequence database maintained by the U.S.
National Bio-Technology Innovation Center. Data in this
database may double every 10 months. By August 2009,
Genbank has more than 250 billion bases from 150,000 dif-
ferent organisms [34]. The second example is related to
astronomy. Sloan Digital Sky Survey (SDSS), the biggest
sky survey project in astronomy, has recorded 25TB data
from 1998 to 2008. As the resolution of the telescope is
improved, by 2004, the data volume generated per night will
surpass 20TB. The last application is related to high-energy
physics. In the beginning of 2008, the Atlas experiment of
Large Hadron Collider (LHC) of European Organization for
Nuclear Research generates raw data at 2PB/s and stores
about 10TB processed data per year.
In addition, pervasive sensing and computing among
nature, commercial, Internet, government, and social envi-
ronments are generating heterogeneous data with unprece-
dented complexity. These datasets have their unique data
characteristics in scale, time dimension, and data category.
For example, mobile data were recorded with respect to
positions, movement, approximation degrees, communica-
tions, multimedia, use of applications, and audio environ-
ment [108]. According to the application environment and
requirements, such datasets into different categories, so as
to select the proper and feasible solutions for big data.
3.2 Big data acquisition
As the second phase of the big data system, big data acqui-
sition includes data collection, data transmission, and data
pre-processing. During big data acquisition, once we col-
lect the raw data, we shall utilize an efficient transmission
mechanism to send it to a proper storage management
system to support different analytical applications. The col-
lected datasets may sometimes include much redundant or](https://image.slidesharecdn.com/bigdatasurvey-170106092413/85/Big-data-survey-10-320.jpg)
![Mobile Netw Appl (2014) 19:171–209 181
useless data, which unnecessarily increases storage space
and affects the subsequent data analysis. For example,
high redundancy is very common among datasets collected
by sensors for environment monitoring. Data compression
technology can be applied to reduce the redundancy. There-
fore, data pre-processing operations are indispensable to
ensure efficient data storage and exploitation.
3.2.1 Data collection
Data collection is to utilize special data collection tech-
niques to acquire raw data from a specific data generation
environment. Four common data collection methods are
shown as follows.
– Log files: As one widely used data collection method,
log files are record files automatically generated by the
data source system, so as to record activities in desig-
nated file formats for subsequent analysis. Log files are
typically used in nearly all digital devices. For exam-
ple, web servers record in log files number of clicks,
click rates, visits, and other property records of web
users [35]. To capture activities of users at the web sites,
web servers mainly include the following three log file
formats: public log file format (NCSA), expanded log
format (W3C), and IIS log format (Microsoft). All the
three types of log files are in the ASCII text format.
Databases other than text files may sometimes be used
to store log information to improve the query efficiency
of the massive log store [36, 37]. There are also some
other log files based on data collection, including stock
indicators in financial applications and determination
of operating states in network monitoring and traffic
management.
– Sensing: Sensors are common in daily life to measure
physical quantities and transform physical quantities
into readable digital signals for subsequent process-
ing (and storage). Sensory data may be classified as
sound wave, voice, vibration, automobile, chemical,
current, weather, pressure, temperature, etc. Sensed
information is transferred to a data collection point
through wired or wireless networks. For applications
that may be easily deployed and managed, e.g., video
surveillance system [38], the wired sensor network is
a convenient solution to acquire related information.
Sometimes the accurate position of a specific phe-
nomenon is unknown, and sometimes the monitored
environment does not have the energy or communica-
tion infrastructures. Then wireless communication must
be used to enable data transmission among sensor nodes
under limited energy and communication capability. In
recent years, WSNs have received considerable inter-
est and have been applied to many applications, such
as environmental research [39, 40], water quality mon-
itoring [41], civil engineering [42, 43], and wildlife
habit monitoring [44]. A WSN generally consists of
a large number of geographically distributed sensor
nodes, each being a micro device powered by battery.
Such sensors are deployed at designated positions as
required by the application to collect remote sensing
data. Once the sensors are deployed, the base station
will send control information for network configura-
tion/management or data collection to sensor nodes.
Based on such control information, the sensory data is
assembled in different sensor nodes and sent back to the
base station for further processing. Interested readers
are referred to [45] for more detailed discussions.
– Methods for acquiring network data: At present, net-
work data acquisition is accomplished using a com-
bination of web crawler, word segmentation system,
task system, and index system, etc. Web crawler is
a program used by search engines for downloading
and storing web pages [46]. Generally speaking, web
crawler starts from the uniform resource locator (URL)
of an initial web page to access other linked web pages,
during which it stores and sequences all the retrieved
URLs. Web crawler acquires a URL in the order of
precedence through a URL queue and then downloads
web pages, and identifies all URLs in the downloaded
web pages, and extracts new URLs to be put in the
queue. This process is repeated until the web crawler
is stopped. Data acquisition through a web crawler is
widely applied in applications based on web pages,
such as search engines or web caching. Traditional web
page extraction technologies feature multiple efficient
solutions and considerable research has been done in
this field. As more advanced web page applications
are emerging, some extraction strategies are proposed
in [47] to cope with rich Internet applications.
The current network data acquisition technologies
mainly include traditional Libpcap-based packet capture
technology, zero-copy packet capture technology, as well
as some specialized network monitoring software such as
Wireshark, SmartSniff, and WinNetCap.
– Libpcap-based packet capture technology: Libpcap
(packet capture library) is a widely used network data
packet capture function library. It is a general tool that
does not depend on any specific system and is mainly
used to capture data in the data link layer. It features
simplicity, easy-to-use, and portability, but has a rel-
atively low efficiency. Therefore, under a high-speed
network environment, considerable packet losses may
occur when Libpcap is used.](https://image.slidesharecdn.com/bigdatasurvey-170106092413/85/Big-data-survey-11-320.jpg)
![182 Mobile Netw Appl (2014) 19:171–209
– Zero-copy packet capture technology: The so-called
zero-copy (ZC) means that no copies between any inter-
nal memories occur during packet receiving and send-
ing at a node. In sending, the data packets directly start
from the user buffer of applications, pass through the
network interfaces, and arrive at an external network.
In receiving, the network interfaces directly send data
packets to the user buffer. The basic idea of zero-copy
is to reduce data copy times, reduce system calls, and
reduce CPU load while ddatagrams are passed from net-
work equipments to user program space. The zero-copy
technology first utilizes direct memory access (DMA)
technology to directly transmit network datagrams to an
address space pre-allocated by the system kernel, so as
to avoid the participation of CPU. In the meanwhile, it
maps the internal memory of the datagrams in the sys-
tem kernel to the that of the detection program, or builds
a cache region in the user space and maps it to the ker-
nel space. Then the detection program directly accesses
the internal memory, so as to reduce internal memory
copy from system kernel to user space and reduce the
amount of system calls.
– Mobile equipments: At present, mobile devices are
more widely used. As mobile device functions become
increasingly stronger, they feature more complex and
multiple means of data acquisition as well as more
variety of data. Mobile devices may acquire geo-
graphical location information through positioning sys-
tems; acquire audio information through microphones;
acquire pictures, videos, streetscapes, two-dimensional
barcodes, and other multimedia information through
cameras; acquire user gestures and other body language
information through touch screens and gravity sensors.
Over the years, wireless operators have improved the
service level of the mobile Internet by acquiring and
analyzing such information. For example, iPhone itself
is a “mobile spy.” It may collect wireless data and
geographical location information, and then send such
information back to Apple Inc. for processing, of which
the user is not aware. Apart from Apple, smart phone
operating systems such as Android of Google and Win-
dows Phone of Microsoft can also collect information
in the similar manner.
In addition to the aforementioned three data acquisition
methods of main data sources, there are many other data
collect methods or systems. For example, in scientific exper-
iments, many special tools can be used to collect exper-
imental data, such as magnetic spectrometers and radio
telescopes. We may classify data collection methods from
different perspectives. From the perspective of data sources,
data collection methods can be classified into two cate-
gories: collection methods recording through data sources
and collection methods recording through other auxiliary
tools.
3.2.2 Data transportation
Upon the completion of raw data collection, data will be
transferred to a data storage infrastructure for processing
and analysis. As discussed in Section 2.3, big data is mainly
stored in a data center. The data layout should be adjusted to
improve computing efficiency or facilitate hardware mainte-
nance. In other words, internal data transmission may occur
in the data center. Therefore, data transmission consists
of two phases: Inter-DCN transmissions and Intra-DCN
transmissions.
– Inter-DCN transmissions: Inter-DCN transmissions are
from data source to data center, which is generally
achieved with the existing physical network infrastruc-
ture. Because of the rapid growth of traffic demands,
the physical network infrastructure in most regions
around the world are constituted by high-volumn, high-
rate, and cost-effective optic fiber transmission systems.
Over the past 20 years, advanced management equip-
ment and technologies have been developed, such as
IP-based wavelength division multiplexing (WDM) net-
work architecture, to conduct smart control and man-
agement of optical fiber networks [48, 49]. WDM is
a technology that multiplexes multiple optical carrier
signals with different wave lengths and couples them
to the same optical fiber of the optical link. In such
technology, lasers with different wave lengths carry dif-
ferent signals. By far, the backbone network have been
deployed with WDM optical transmission systems with
single channel rate of 40Gb/s. At present, 100Gb/s com-
mercial interface are available and 100Gb/s systems (or
TB/s systems) will be available in the near future [50].
However, traditional optical transmission technologies
are limited by the bandwidth of the electronic bot-
tleneck [51]. Recently, orthogonal frequency-division
multiplexing (OFDM), initially designed for wireless
systems, is regarded as one of the main candidate
technologies for future high-speed optical transmis-
sion. OFDM is a multi-carrier parallel transmission
technology. It segments a high-speed data flow to trans-
form it into low-speed sub-data-flows to be transmitted
over multiple orthogonal sub-carriers [52]. Compared
with fixed channel spacing of WDM, OFDM allows
sub-channel frequency spectrums to overlap with each
other [53]. Therefore, it is a flexible and efficient optical
networking technology.
– Intra-DCN Transmissions: Intra-DCN transmissions
are the data communication flows within data centers.
Intra-DCN transmissions depend on the communication](https://image.slidesharecdn.com/bigdatasurvey-170106092413/85/Big-data-survey-12-320.jpg)
![Mobile Netw Appl (2014) 19:171–209 183
mechanism within the data center (i.e., on physical con-
nection plates, chips, internal memories of data servers,
network architectures of data centers, and communica-
tion protocols). A data center consists of multiple inte-
grated server racks interconnected with its internal con-
nection networks. Nowadays, the internal connection
networks of most data centers are fat-tree, two-layer
or three-layer structures based on multi-commodity
network flows [51, 54]. In the two-layer topological
structure, the racks are connected by 1Gbps top rack
switches (TOR) and then such top rack switches are
connected with 10Gbps aggregation switches in the
topological structure. The three-layer topological struc-
ture is a structure augmented with one layer on the top
of the two-layer topological structure and such layer
is constituted by 10Gbps or 100Gbps core switches
to connect aggregation switches in the topological
structure. There are also other topological structures
which aim to improve the data center networks [55–
58]. Because of the inadequacy of electronic packet
switches, it is difficult to increase communication band-
widths while keeps energy consumption is low. Over
the years, due to the huge success achieved by opti-
cal technologies, the optical interconnection among the
networks in data centers has drawn great interest. Opti-
cal interconnection is a high-throughput, low-delay,
and low-energy-consumption solution. At present, opti-
cal technologies are only used for point-to-point links
in data centers. Such optical links provide connection
for the switches using the low-cost multi-mode fiber
(MMF) with 10Gbps data rate. Optical interconnec-
tion (switching in the optical domain) of networks in
data centers is a feasible solution, which can provide
Tbps-level transmission bandwidth with low energy
consumption. Recently, many optical interconnection
plans are proposed for data center networks [59]. Some
plans add optical paths to upgrade the existing net-
works, and other plans completely replace the current
switches [59–64]. As a strengthening technology, Zhou
et al. in [65] adopt wireless links in the 60GHz fre-
quency band to strengthen wired links. Network vir-
tualization should also be considered to improve the
efficiency and utilization of data center networks.
3.2.3 Data pre-processing
Because of the wide variety of data sources, the collected
datasets vary with respect to noise, redundancy, and con-
sistency, etc., and it is undoubtedly a waste to store mean-
ingless data. In addition, some analytical methods have
serious requirements on data quality. Therefore, in order
to enable effective data analysis, we shall pre-process data
under many circumstances to integrate the data from differ-
ent sources, which can not only reduces storage expense,
but also improves analysis accuracy. Some relational data
pre-processing techniques are discussed as follows.
– Integration: data integration is the cornerstone of mod-
ern commercial informatics, which involves the com-
bination of data from different sources and provides
users with a uniform view of data [66]. This is a mature
research field for traditional database. Historically, two
methods have been widely recognized: data ware-
house and data federation. Data warehousing includes
a process named ETL (Extract, Transform and Load).
Extraction involves connecting source systems, select-
ing, collecting, analyzing, and processing necessary
data. Transformation is the execution of a series of rules
to transform the extracted data into standard formats.
Loading means importing extracted and transformed
data into the target storage infrastructure. Loading is
the most complex procedure among the three, which
includes operations such as transformation, copy, clear-
ing, standardization, screening, and data organization.
A virtual database can be built to query and aggregate
data from different data sources, but such database does
not contain data. On the contrary, it includes informa-
tion or metadata related to actual data and its positions.
Such two “storage-reading” approaches do not sat-
isfy the high performance requirements of data flows
or search programs and applications. Compared with
queries, data in such two approaches is more dynamic
and must be processed during data transmission. Gen-
erally, data integration methods are accompanied with
flow processing engines and search engines [30, 67].
– Cleaning: data cleaning is a process to identify inac-
curate, incomplete, or unreasonable data, and then
modify or delete such data to improve data quality.
Generally, data cleaning includes five complementary
procedures [68]: defining and determining error types,
searching and identifying errors, correcting errors, doc-
umenting error examples and error types, and mod-
ifying data entry procedures to reduce future errors.
During cleaning, data formats, completeness, rational-
ity, and restriction shall be inspected. Data cleaning is
of vital importance to keep the data consistency, which
is widely applied in many fields, such as banking, insur-
ance, retail industry, telecommunications, and traffic
control.
In e-commerce, most data is electronically col-
lected, which may have serious data quality prob-
lems. Classic data quality problems mainly come from
software defects, customized errors, or system mis-
configuration. Authors in [69] discussed data cleaning](https://image.slidesharecdn.com/bigdatasurvey-170106092413/85/Big-data-survey-13-320.jpg)
![184 Mobile Netw Appl (2014) 19:171–209
in e-commerce by crawlers and regularly re-copying
customer and account information.
In [70], the problem of cleaning RFID data was
examined. RFID is widely used in many applica-
tions, e.g., inventory management and target track-
ing. However, the original RFID features low quality,
which includes a lot of abnormal data limited by the
physical design and affected by environmental noises.
In [71], a probability model was developed to cope
with data loss in mobile environments. Khoussainova
et al. in [72] proposed a system to automatically cor-
rect errors of input data by defining global integrity
constraints.
Herbert et al. [73] proposed a framework called BIO-
AJAX to standardize biological data so as to conduct
further computation and improve search quality. With
BIO-AJAX, some errors and repetitions may be elim-
inated, and common data mining technologies can be
executed more effectively.
– Redundancy elimination: data redundancy refers to data
repetitions or surplus, which usually occurs in many
datasets. Data redundancy can increase the unneces-
sary data transmission expense and cause defects on
storage systems, e.g., waste of storage space, lead-
ing to data inconsistency, reduction of data reliabil-
ity, and data damage. Therefore, various redundancy
reduction methods have been proposed, such as redun-
dancy detection, data filtering, and data compression.
Such methods may apply to different datasets or appli-
cation environments. However, redundancy reduction
may also bring about certain negative effects. For
example, data compression and decompression cause
additional computational burden. Therefore, the ben-
efits of redundancy reduction and the cost should be
carefully balanced. Data collected from different fields
will increasingly appear in image or video formats.
It is well-known that images and videos contain con-
siderable redundancy, including temporal redundancy,
spacial redundancy, statistical redundancy, and sens-
ing redundancy. Video compression is widely used
to reduce redundancy in video data, as specified in
the many video coding standards (MPEG-2, MPEG-4,
H.263, and H.264/AVC). In [74], the authors inves-
tigated the problem of video compression in a video
surveillance system with a video sensor network. The
authors propose a new MPEG-4 based method by
investigating the contextual redundancy related to back-
ground and foreground in a scene. The low com-
plexity and the low compression ratio of the pro-
posed approach were demonstrated by the evaluation
results.
On generalized data transmission or storage, re-
peated data deletion is a special data compression
technology, which aims to eliminate repeated data
copies [75]. With repeated data deletion, individual data
blocks or data segments will be assigned with identi-
fiers (e.g., using a hash algorithm) and stored, with the
identifiers added to the identification list. As the anal-
ysis of repeated data deletion continues, if a new data
block has an identifier that is identical to that listed
in the identification list, the new data block will be
deemed as redundant and will be replaced by the cor-
responding stored data block. Repeated data deletion
can greatly reduce storage requirement, which is par-
ticularly important to a big data storage system. Apart
from the aforementioned data pre-processing methods,
specific data objects shall go through some other oper-
ations such as feature extraction. Such operation plays
an important role in multimedia search and DNA anal-
ysis [76–78]. Usually high-dimensional feature vec-
tors (or high-dimensional feature points) are used to
describe such data objects and the system stores the
dimensional feature vectors for future retrieval. Data
transfer is usually used to process distributed hetero-
geneous data sources, especially business datasets [79].
As a matter of fact, in consideration of various datasets,
it is non-trivial, or impossible, to build a uniform data
pre-processing procedure and technology that is appli-
cable to all types of datasets. on the specific feature,
problem, performance requirements, and other factors
of the datasets should be considered, so as to select a
proper data pre-processing strategy.
4 Big data storage
The explosive growth of data has more strict requirements
on storage and management. In this section, we focus on
the storage of big data. Big data storage refers to the stor-
age and management of large-scale datasets while achiev-
ing reliability and availability of data accessing. We will
review important issues including massive storage systems,
distributed storage systems, and big data storage mecha-
nisms. On one hand, the storage infrastructure needs to
provide information storage service with reliable storage
space; on the other hand, it must provide a powerful access
interface for query and analysis of a large amount of
data.
Traditionally, as auxiliary equipment of server, data stor-
age device is used to store, manage, look up, and analyze
data with structured RDBMSs. With the sharp growth of
data, data storage device is becoming increasingly more
important, and many Internet companies pursue big capac-
ity of storage to be competitive. Therefore, there is a
compelling need for research on data storage.](https://image.slidesharecdn.com/bigdatasurvey-170106092413/85/Big-data-survey-14-320.jpg)
![Mobile Netw Appl (2014) 19:171–209 185
4.1 Storage system for massive data
Various storage systems emerge to meet the demands of
massive data. Existing massive storage technologies can be
classified as Direct Attached Storage (DAS) and network
storage, while network storage can be further classified
into Network Attached Storage (NAS) and Storage Area
Network (SAN).
In DAS, various harddisks are directly connected with
servers, and data management is server-centric, such that
storage devices are peripheral equipments, each of which
takes a certain amount of I/O resource and is managed by an
individual application software. For this reason, DAS is only
suitable to interconnect servers with a small scale. How-
ever, due to its low scalability, DAS will exhibit undesirable
efficiency when the storage capacity is increased, i.e., the
upgradeability and expandability are greatly limited. Thus,
DAS is mainly used in personal computers and small-sized
servers.
Network storage is to utilize network to provide users
with a union interface for data access and sharing. Network
storage equipment includes special data exchange equip-
ments, disk array, tap library, and other storage media, as
well as special storage software. It is characterized with
strong expandability.
NAS is actually an auxillary storage equipment of a net-
work. It is directly connected to a network through a hub or
switch through TCP/IP protocols. In NAS, data is transmit-
ted in the form of files. Compared to DAS, the I/O burden
at a NAS server is reduced extensively since the server
accesses a storage device indirectly through a network.
While NAS is network-oriented, SAN is especially
designed for data storage with a scalable and bandwidth
intensive network, e.g., a high-speed network with optical
fiber connections. In SAN, data storage management is rel-
atively independent within a storage local area network,
where multipath based data switching among any internal
nodes is utilized to achieve a maximum degree of data
sharing and data management.
From the organization of a data storage system, DAS,
NAS, and SAN can all be divided into three parts: (i) disc
array: it is the foundation of a storage system and the fun-
damental guarantee for data storage; (ii) connection and
network sub-systems, which provide connection among one
or more disc arrays and servers; (iii) storage management
software, which handles data sharing, disaster recovery, and
other storage management tasks of multiple servers.
4.2 Distributed storage system
The first challenge brought about by big data is how to
develop a large scale distributed storage system for effi-
ciently data processing and analysis. To use a distributed
system to store massive data, the following factors should
be taken into consideration:
– Consistency: a distributed storage system requires mul-
tiple servers to cooperatively store data. As there are
more servers, the probability of server failures will be
larger. Usually data is divided into multiple pieces to
be stored at different servers to ensure availability in
case of server failure. However, server failures and par-
allel storage may cause inconsistency among different
copies of the same data. Consistency refers to assuring
that multiple copies of the same data are identical.
– Availability: a distributed storage system operates in
multiple sets of servers. As more servers are used,
server failures are inevitable. It would be desirable if
the entire system is not seriously affected to satisfy cus-
tomer’s requests in terms of reading and writing. This
property is called availability.
– Partition Tolerance: multiple servers in a distributed
storage system are connected by a network. The net-
work could have link/node failures or temporary con-
gestion. The distributed system should have a certain
level of tolerance to problems caused by network fail-
ures. It would be desirable that the distributed storage
still works well when the network is partitioned.
Eric Brewer proposed a CAP [80, 81] theory in 2000,
which indicated that a distributed system could not simulta-
neously meet the requirements on consistency, availability,
and partition tolerance; at most two of the three require-
ments can be satisfied simultaneously. Seth Gilbert and
Nancy Lynch from MIT proved the correctness of CAP the-
ory in 2002. Since consistency, availability, and partition
tolerance could not be achieved simultaneously, we can have
a CA system by ignoring partition tolerance, a CP system by
ignoring availability, and an AP system that ignores consis-
tency, according to different design goals. The three systems
are discussed in the following.
CA systems do not have partition tolerance, i.e, they
could not handle network failures. Therefore, CA sys-
tems are generally deemed as storage systems with a sin-
gle server, such as the traditional small-scale relational
databases. Such systems feature single copy of data, such
that consistency is easily ensured. Availability is guaranteed
by the excellent design of relational databases. However,
since CA systems could not handle network failures, they
could not be expanded to use many servers. Therefore, most
large-scale storage systems are CP systems and AP systems.
Compared with CA systems, CP systems ensure parti-
tion tolerance. Therefore, CP systems can be expanded to
become distributed systems. CP systems generally main-
tain several copies of the same data in order to ensure a](https://image.slidesharecdn.com/bigdatasurvey-170106092413/85/Big-data-survey-15-320.jpg)
![186 Mobile Netw Appl (2014) 19:171–209
level of fault tolerance. CP systems also ensure data consis-
tency, i.e., multiple copies of the same data are guaranteed
to be completely identical. However, CP could not ensure
sound availability because of the high cost for consistency
assurance. Therefore, CP systems are useful for the scenar-
ios with moderate load but stringent requirements on data
accuracy (e.g., trading data). BigTable and Hbase are two
popular CP systems.
AP systems also ensure partition tolerance. However, AP
systems are different from CP systems in that AP systems
also ensure availability. However, AP systems only ensure
eventual consistency rather than strong consistency in the
previous two systems. Therefore, AP systems only apply
to the scenarios with frequent requests but not very high
requirements on accuracy. For example, in online Social
Networking Services (SNS) systems, there are many con-
current visits to the data but a certain amount of data errors
are tolerable. Furthermore, because AP systems ensure
eventual consistency, accurate data can still be obtained after
a certain amount of delay. Therefore, AP systems may also
be used under the circumstances with no stringent realtime
requirements. Dynamo and Cassandra are two popular AP
systems.
4.3 Storage mechanism for big data
Considerable research on big data promotes the develop-
ment of storage mechanisms for big data. Existing stor-
age mechanisms of big data may be classified into three
bottom-up levels: (i) file systems, (ii) databases, and (iii)
programming models.
File systems are the foundation of the applications at
upper levels. Google’s GFS is an expandable distributed
file system to support large-scale, distributed, data-intensive
applications [25]. GFS uses cheap commodity servers to
achieve fault-tolerance and provides customers with high-
performance services. GFS supports large-scale file appli-
cations with more frequent reading than writing. However,
GFS also has some limitations, such as a single point of
failure and poor performances for small files. Such limita-
tions have been overcome by Colossus [82], the successor
of GFS.
In addition, other companies and researchers also have
their solutions to meet the different demands for storage
of big data. For example, HDFS and Kosmosfs are deriva-
tives of open source codes of GFS. Microsoft developed
Cosmos [83] to support its search and advertisement busi-
ness. Facebook utilizes Haystack [84] to store the large
amount of small-sized photos. Taobao also developed TFS
and FastDFS. In conclusion, distributed file systems have
been relatively mature after years of development and busi-
ness operation. Therefore, we will focus on the other two
levels in the rest of this section.
4.3.1 Database technology
The database technology has been evolving for more than
30 years. Various database systems are developed to handle
datasets at different scales and support various applica-
tions. Traditional relational databases cannot meet the chal-
lenges on categories and scales brought about by big data.
NoSQL databases (i.e., non traditional relational databases)
are becoming more popular for big data storage. NoSQL
databases feature flexible modes, support for simple and
easy copy, simple API, eventual consistency, and support
of large volume data. NoSQL databases are becoming
the core technology for of big data. We will examine
the following three main NoSQL databases in this sec-
tion: Key-value databases, column-oriented databases, and
document-oriented databases, each based on certain data
models.
– Key-value Databases: Key-value Databases are con-
stituted by a simple data model and data is stored
corresponding to key-values. Every key is unique and
customers may input queried values according to the
keys. Such databases feature a simple structure and
the modern key-value databases are characterized with
high expandability and shorter query response time than
those of relational databases. Over the past few years,
many key-value databases have appeared as motivated
by Amazon’s Dynamo system [85]. We will introduce
Dynamo and several other representative key-value
databases.
– Dynamo: Dynamo is a highly available and
expandable distributed key-value data stor-
age system . It is used to store and manage
the status of some core services, which can
be realized with key access, in the Amazon
e-Commerce Platform. The public mode of
relational databases may generate invalid data
and limit data scale and availability, while
Dynamo can resolve these problems with a
simple key-object interface, which is consti-
tuted by simple reading and writing opera-
tion. Dynamo achieves elasticity and avail-
ability through the data partition, data copy,
and object edition mechanisms. Dynamo par-
tition plan relies on Consistent Hashing [86],
which has a main advantage that node pass-
ing only affects directly adjacent nodes and
do not affect other nodes, to divide the load
for multiple main storage machines. Dynamo
copies data to N sets of servers, in which N
is a configurable parameter in order to achieve](https://image.slidesharecdn.com/bigdatasurvey-170106092413/85/Big-data-survey-16-320.jpg)
![Mobile Netw Appl (2014) 19:171–209 187
high availability and durability. Dynamo sys-
tem also provides eventual consistency, so as
to conduct asynchronous update on all copies.
– Voldemort: Voldemort is also a key-value stor-
age system, which was initially developed for
and is still used by LinkedIn. Key words and
values in Voldemort are composite objects
constituted by tables and images. Volde-
mort interface includes three simple opera-
tions: reading, writing, and deletion, all of
which are confirmed by key words. Volde-
mort provides asynchronous updating con-
current control of multiple editions but does
not ensure data consistency. However, Volde-
mort supports optimistic locking for consistent
multi-record updating. When conflict happens
between the updating and any other opera-
tions, the updating operation will quit. The
data copy mechanism of Voldmort is the same
as that of Dynamo. Voldemort not only stores
data in RAM but allows data be inserted into
a storage engine. Especially, Voldemort sup-
ports two storage engines including Berkeley
DB and Random Access Files.
The key-value database emerged a few years ago.
Deeply influenced by Amazon Dynamo DB, other key-
value storage systems include Redis, Tokyo Canbinet
and Tokyo Tyrant, Memcached and Memcache DB,
Riak and Scalaris, all of which provide expandability
by distributing key words into nodes. Voldemort, Riak,
Tokyo Cabinet, and Memecached can utilize attached
storage devices to store data in RAM or disks. Other
storage systems store data at RAM and provide disk
backup, or rely on copy and recovery to avoid backup.
– Column-oriented Database: The column-oriented
databases store and process data according to columns
other than rows. Both columns and rows are segmented
in multiple nodes to realize expandability. The column-
oriented databases are mainly inspired by Google’s
BigTable. In this Section, we first discuss BigTable and
then introduce several derivative tools.
– BigTable: BigTable is a distributed, structured
data storage system, which is designed to pro-
cess the large-scale (PB class) data among
thousands commercial servers [87]. The basic
data structure of Bigtable is a multi-dimension
sequenced mapping with sparse, distributed,
and persistent storage. Indexes of mapping
are row key, column key, and timestamps,
and every value in mapping is an unana-
lyzed byte array. Each row key in BigTable
is a 64KB character string. By lexicograph-
ical order, rows are stored and continually
segmented into Tablets (i.e., units of distribu-
tion) for load balance. Thus, reading a short
row of data can be highly effective, since it
only involves communication with a small por-
tion of machines. The columns are grouped
according to the prefixes of keys, and thus
forming column families. These column fami-
lies are the basic units for access control. The
timestamps are 64-bit integers to distinguish
different editions of cell values. Clients may
flexibly determine the number of cell editions
stored. These editions are sequenced in the
descending order of timestamps, so the latest
edition will always be read.
The BigTable API features the creation and
deletion of Tablets and column families as well
as modification of metadata of clusters, tables,
and column families. Client applications may
insert or delete values of BigTable, query val-
ues from columns, or browse sub-datasets in a
table. Bigtable also supports some other char-
acteristics, such as transaction processing in a
single row. Users may utilize such features to
conduct more complex data processing.
Every procedure executed by BigTable
includes three main components: Master
server, Tablet server, and client library.
Bigtable only allows one set of Master server
be distributed to be responsible for distribut-
ing tablets for Tablet server, detecting added
or removed Tablet servers, and conducting
load balance. In addition, it can also mod-
ify BigTable schema, e.g., creating tables and
column families, and collecting garbage saved
in GFS as well as deleted or disabled files,
and using them in specific BigTable instances.
Every tablet server manages a Tablet set and
is responsible for the reading and writing of a
loaded Tablet. When Tablets are too big, they
will be segmented by the server. The applica-
tion client library is used to communicate with
BigTable instances.
BigTable is based on many fundamental
components of Google, including GFS [25],
cluster management system, SSTable file for-
mat, and Chubby [88]. GFS is use to store data
and log files. The cluster management system
is responsible for task scheduling, resources
sharing, processing of machine failures, and
monitoring of machine statuses. SSTable file
format is used to store BigTable data internally,](https://image.slidesharecdn.com/bigdatasurvey-170106092413/85/Big-data-survey-17-320.jpg)
![188 Mobile Netw Appl (2014) 19:171–209
and it provides mapping between persistent,
sequenced, and unchangeable keys and values
as any byte strings. BigTable utilizes Chubby
for the following tasks in server: 1) ensure
there is at most one active Master copy at
any time; 2) store the bootstrap location of
BigTable data; 3) look up Tablet server; 4) con-
duct error recovery in case of Table server fail-
ures; 5) store BigTable schema information; 6)
store the access control table.
– Cassandra: Cassandra is a distributed storage
system to manage the huge amount of struc-
tured data distributed among multiple commer-
cial servers [89]. The system was developed
by Facebook and became an open source tool
in 2008. It adopts the ideas and concepts of
both Amazon Dynamo and Google BigTable,
especially integrating the distributed system
technology of Dynamo with the BigTable data
model. Tables in Cassandra are in the form of
distributed four-dimensional structured map-
ping, where the four dimensions including row,
column, column family, and super column. A
row is distinguished by a string-key with arbi-
trary length. No matter the amount of columns
to be read or written, the operation on rows
is an auto. Columns may constitute clusters,
which is called column families, and are sim-
ilar to the data model of Bigtable. Cassandra
provides two kinds of column families: column
families and super columns. The super column
includes arbitrary number of columns related
to same names. A column family includes
columns and super columns, which may be
continuously inserted to the column family
during runtime. The partition and copy mecha-
nisms of Cassandra are very similar to those of
Dynamo, so as to achieve consistency.
– Derivative tools of BigTable: since the
BigTable code cannot be obtained through
the open source license, some open source
projects compete to implement the BigTable
concept to develop similar systems, such as
HBase and Hypertable.
HBase is a BigTable cloned version pro-
grammed with Java and is a part of Hadoop of
Apache’s MapReduce framework [90]. HBase
replaces GFS with HDFS. It writes updated
contents into RAM and regularly writes them
into files on disks. The row operations are
atomic operations, equipped with row-level
locking and transaction processing, which is
optional for large scale. Partition and distribu-
tion are transparently operated and have space
for client hash or fixed key.
HyperTable was developed similar to
BigTable to obtain a set of high-performance,
expandable, distributed storage and process-
ing systems for structured and unstructured
data [91]. HyperTable relies on distributed
file systems, e.g. HDFS and distributed lock
manager. Data representation, processing, and
partition mechanism are similar to that in
BigTable. HyperTable has its own query lan-
guage, called HyperTable query language
(HQL), and allows users to create, modify, and
query underlying tables.
Since the column-oriented storage databases mainly
emulate BigTable, their designs are all similar, except
for the concurrency mechanism and several other fea-
tures. For example, Cassandra emphasizes weak consis-
tency of concurrent control of multiple editions while
HBase and HyperTable focus on strong consistency
through locks or log records.
– Document Database: Compared with key-value stor-
age, document storage can support more complex data
forms. Since documents do not follow strict modes,
there is no need to conduct mode migration. In addition,
key-value pairs can still be saved. We will examine three
important representatives of document storage systems,
i.e., MongoDB, SimpleDB, and CouchDB.
– MongoDB: MongoDB is open-source and
document-oriented database [92]. MongoDB
stores documents as Binary JSON (BSON)
objects [93], which is similar to object. Every
document has an ID field as the primary key.
Query in MongoDB is expressed with syn-
tax similar to JSON. A database driver sends
the query as a BSON object to MongoDB.
The system allows query on all documents,
including embedded objects and arrays. To
enable rapid query, indexes can be created
in the queryable fields of documents. The
copy operation in MongoDB can be executed
with log files in the main nodes that support
all the high-level operations conducted in the
database. During copying, the slavers query
all the writing operations since the last syn-
chronization to the master and execute opera-
tions in log files in local databases. MongoDB
supports horizontal expansion with automatic
sharing to distribute data among thousands
of nodes by automatically balancing load and
failover.](https://image.slidesharecdn.com/bigdatasurvey-170106092413/85/Big-data-survey-18-320.jpg)
![Mobile Netw Appl (2014) 19:171–209 189
– SimpleDB: SimpleDB is a distributed database
and is a web service of Amazon [94]. Data in
SimpleDB is organized into various domains
in which data may be stored, acquired, and
queried. Domains include different proper-
ties and name/value pair sets of projects.
Date is copied to different machines at dif-
ferent data centers in order to ensure data
safety and improve performance. This system
does not support automatic partition and thus
could not be expanded with the change of
data volume. SimpleDB allows users to query
with SQL. It is worth noting that SimpleDB
can assure eventual consistency but does not
support to Muti-Version Concurrency Control
(MVCC). Therefore, conflicts therein could
not be detected from the client side.
– CouchDB: Apache CouchDB is a document-
oriented database written in Erlang [95]. Data
in CouchDB is organized into documents con-
sisting of fields named by keys/names and
values, which are stored and accessed as JSON
objects. Every document is provided with
a unique identifier. CouchDB allows access
to database documents through the RESTful
HTTP API. If a document needs to be modi-
fied, the client must download the entire doc-
ument to modify it, and then send it back to
the database. After a document is rewritten
once, the identifier will be updated. CouchDB
utilizes the optimal copying to obtain scalabil-
ity without a sharing mechanism. Since var-
ious CouchDBs may be executed along with
other transactions simultaneously, any kinds of
Replication Topology can be built. The con-
sistency of CouchDB relies on the copying
mechanism. CouchDB supports MVCC with
historical Hash records.
Big data are generally stored in hundreds and even thou-
sands of commercial servers. Thus, the traditional parallel
models, such as Message Passing Interface (MPI) and Open
Multi-Processing (OpenMP), may not be adequate to sup-
port such large-scale parallel programs. Recently, some
proposed parallel programming models effectively improve
the performance of NoSQL and reduce the performance
gap to relational databases. Therefore, these models have
become the cornerstone for the analysis of massive data.
– MapReduce: MapReduce [22] is a simple but pow-
erful programming model for large-scale computing
using a large number of clusters of commercial PCs
to achieve automatic parallel processing and distribu-
tion. In MapReduce, computing model only has two
functions, i.e., Map and Reduce, both of which are pro-
grammed by users. The Map function processes input
key-value pairs and generates intermediate key-value
pairs. Then, MapReduce will combine all the intermedi-
ate values related to the same key and transmit them to
the Reduce function, which further compress the value
set into a smaller set. MapReduce has the advantage
that it avoids the complicated steps for developing par-
allel applications, e.g., data scheduling, fault-tolerance,
and inter-node communications. The user only needs to
program the two functions to develop a parallel applica-
tion. The initial MapReduce framework did not support
multiple datasets in a task, which has been mitigated by
some recent enhancements [96, 97].
Over the past decades, programmers are familiar
with the advanced declarative language of SQL, often
used in a relational database, for task description and
dataset analysis. However, the succinct MapReduce
framework only provides two nontransparent functions,
which cannot cover all the common operations. There-
fore, programmers have to spend time on programming
the basic functions, which are typically hard to be main-
tained and reused. In order to improve the programming
efficiency, some advanced language systems have been
proposed, e.g., Sawzall [98] of Google, Pig Latin [99]
of Yahoo, Hive [100] of Facebook, and Scope [87] of
Microsoft.
– Dryad: Dryad [101] is a general-purpose distributed
execution engine for processing parallel applications
of coarse-grained data. The operational structure of
Dryad is a directed acyclic graph, in which vertexes
represent programs and edges represent data channels.
Dryad executes operations on the vertexes in clusters
and transmits data via data channels, including doc-
uments, TCP connections, and shared-memory FIFO.
During operation, resources in a logic operation graph
are automatically map to physical resources.
The operation structure of Dryad is coordinated by a
central program called job manager, which can be exe-
cuted in clusters or workstations through network. A
job manager consists of two parts: 1) application codes
which are used to build a job communication graph,
and 2) program library codes that are used to arrange
available resources. All kinds of data are directly trans-
mitted between vertexes. Therefore, the job manager is
only responsible for decision-making, which does not
obstruct any data transmission.
In Dryad, application developers can flexibly choose
any directed acyclic graph to describe the communica-
tion modes of the application and express data transmis-
sion mechanisms. In addition, Dryad allows vertexes
to use any amount of input and output data, while
MapReduce supports only one input and output set.](https://image.slidesharecdn.com/bigdatasurvey-170106092413/85/Big-data-survey-19-320.jpg)
![190 Mobile Netw Appl (2014) 19:171–209
DryadLINQ [102] is the advanced language of Dryad
and is used to integrate the aforementioned SQL-like
language execution environment.
– All-Pairs: All-Pairs [103] is a system specially designed
for biometrics, bio-informatics, and data mining appli-
cations. It focuses on comparing element pairs in two
datasets by a given function. All-Pairs can be expressed
as three-tuples (Set A, Set B, and Function F), in which
Function F is utilized to compare all elements in Set A
and Set B. The comparison result is an output matrix M,
which is also called the Cartesian product or cross join
of Set A and Set B.
All-Pairs is implemented in four phases: system
modeling, distribution of input data, batch job man-
agement, and result collection. In Phase I, an approx-
imation model of system performance will be built to
evaluate how much CPU resource is needed and how to
conduct job partition. In Phase II, a spanning tree is built
for data transmissions, which makes the workload of
every partition retrieve input data effectively. In Phase
III, after the data flow is delivered to proper nodes, the
All-Pairs engine will build a batch-processing submis-
sion for jobs in partitions, while sequencing them in the
batch processing system, and formulating a node run-
ning command to acquire data. In the last phase, after
the job completion of the batch processing system, the
extraction engine will collect results and combine them
in a proper structure, which is generally a single file list,
in which all results are put in order.
– Pregel: The Pregel [104] system of Google facilitates
the processing of large-sized graphs, e.g., analysis of
network graphs and social networking services. A com-
putational task is expressed by a directed graph con-
stituted by vertexes and directed edges. Every vertex
is related to a modifiable and user-defined value, and
every directed edge related to a source vertex is con-
stituted by the user-defined value and the identifier of
a target vertex. When the graph is built, the program
conducts iterative calculations, which is called super-
steps among which global synchronization points are
set until algorithm completion and output completion.
In every superstep, vertex computations are parallel,
and every vertex executes the same user-defined func-
tion to express a given algorithm logic. Every vertex
may modify its and its output edges status, receive a
message sent from the previous superstep, send the
message to other vertexes, and even modify the topolog-
ical structure of the entire graph. Edges are not provided
with corresponding computations. Functions of every
vertex may be removed by suspension. When all ver-
texes are in an inactive status without any message to
transmit, the entire program execution is completed.
The Pregel program output is a set consisting of the val-
ues output from all the vertexes. Generally speaking,
the input and output of Pregel program are isomorphic
directed graphs.
Inspired by the above programming models, other
researches have also focused on programming modes for
more complex computational tasks, e.g., iterative computa-
tions [105, 106], fault-tolerant memory computations [107],
incremental computations [108], and flow control decision-
making related to data [109].
The analysis of big data mainly involves analytical meth-
ods for traditional data and big data, analytical architecture
for big data, and software used for mining and analysis of
big data. Data analysis is the final and the most important
phase in the value chain of big data, with the purpose of
extracting useful values, providing suggestions or decisions.
Different levels of potential values can be generated through
the analysis of datasets in different fields [10]. However,
data analysis is a broad area, which frequently changes
and is extremely complex. In this section, we introduce the
methods, architectures and tools for big data analysis.
4.4 Traditional data analysis
Traditional data analysis means to use proper statistical
methods to analyze massive data, to concentrate, extract,
and refine useful data hidden in a batch of chaotic datasets,
and to identify the inherent law of the subject matter, so as
to maximize the value of data. Data analysis plays a huge
guidance role in making development plans for a country,
understanding customer demands for commerce, and pre-
dicting market trend for enterprises. Big data analysis can be
deemed as the analysis technique for a special kind of data.
Therefore, many traditional data analysis methods may still
be utilized for big data analysis. Several representative tradi-
tional data analysis methods are examined in the following,
many of which are from statistics and computer science.
– Cluster Analysis: is a statistical method for grouping
objects, and specifically, classifying objects according
to some features. Cluster analysis is used to differenti-
ate objects with particular features and divide them into
some categories (clusters) according to these features,
such that objects in the same category will have high
homogeneity while different categories will have high
heterogeneity. Cluster analysis is an unsupervised study
method without training data.
– Factor Analysis: is basically targeted at describing the
relation among many elements with only a few factors,
i.e., grouping several closely related variables into a fac-
tor, and the few factors are then used to reveal the most
information of the original data.](https://image.slidesharecdn.com/bigdatasurvey-170106092413/85/Big-data-survey-20-320.jpg)
![Mobile Netw Appl (2014) 19:171–209 191
– Correlation Analysis: is an analytical method for deter-
mining the law of relations, such as correlation, cor-
relative dependence, and mutual restriction, among
observed phenomena and accordingly conducting fore-
cast and control. Such relations may be classified into
two types: (i) function, reflecting the strict dependence
relationship among phenomena, which is also called
a definitive dependence relationship; (ii) correlation,
some undetermined or inexact dependence relations,
and the numerical value of a variable may correspond
to several numerical values of the other variable, and
such numerical values present a regular fluctuation
surrounding their mean values.
– Regression Analysis: is a mathematical tool for reveal-
ing correlations between one variable and several other
variables. Based on a group of experiments or observed
data, regression analysis identifies dependence relation-
ships among variables hidden by randomness. Regres-
sion analysis may make complex and undetermined
correlations among variables to be simple and regular.
– A/B Testing: also called bucket testing. It is a technol-
ogy for determining how to improve target variables by
comparing the tested group. Big data will require a large
number of tests to be executed and analyzed.
– Statistical Analysis: Statistical analysis is based on
the statistical theory, a branch of applied mathemat-
ics. In statistical theory, randomness and uncertainty
are modeled with Probability Theory. Statistical anal-
ysis can provide a description and an inference for
big data. Descriptive statistical analysis can summarize
and describe datasets, while inferential statistical anal-
ysis can draw conclusions from data subject to random
variations. Statistical analysis is widely applied in the
economic and medical care fields [110].
– Data Mining Algorithms: Data mining is a process
for extracting hidden, unknown, but potentially useful
information and knowledge from massive, incomplete,
noisy, fuzzy, and random data. In 2006, The IEEE Inter-
national Conference on Data Mining Series (ICDM)
identified ten most influential data mining algorithms
through a strict selection procedure [111], including
C4.5, k-means, SVM, Apriori, EM, Naive Bayes, and
Cart, etc. These ten algorithms cover classification,
clustering, regression, statistical learning, association
analysis, and linking mining, all of which are the most
important problems in data mining research.
4.5 Big data analytic methods
In the dawn of the big data era, people are concerned how to
rapidly extract key information from massive data so as to
bring values for enterprises and individuals. At present, the
main processing methods of big data are shown as follows.
– Bloom Filter: Bloom Filter consists of a series of Hash
functions. The principle of Bloom Filter is to store Hash
values of data other than data itself by utilizing a bit
array, which is in essence a bitmap index that uses Hash
functions to conduct lossy compression storage of data.
It has such advantages as high space efficiency and
high query speed, but also has some disadvantages in
misrecognition and deletion.
– Hashing: it is a method that essentially transforms data
into shorter fixed-length numerical values or index val-
ues. Hashing has such advantages as rapid reading,
writing, and high query speed, but it is hard to find a
sound Hash function.
– Index: index is always an effective method to reduce
the expense of disk reading and writing, and improve
insertion, deletion, modification, and query speeds in
both traditional relational databases that manage struc-
tured data, and other technologies that manage semi-
structured and unstructured data. However, index has
a disadvantage that it has the additional cost for stor-
ing index files which should be maintained dynamically
when data is updated.
– Triel: also called trie tree, a variant of Hash Tree. It is
mainly applied to rapid retrieval and word frequency
statistics. The main idea of Triel is to utilize common
prefixes of character strings to reduce comparison on
character strings to the greatest extent, so as to improve
query efficiency.
– Parallel Computing: compared to traditional serial com-
puting, parallel computing refers to simultaneously
utilizing several computing resources to complete a
computation task. Its basic idea is to decompose a
problem and assign them to several separate processes
to be independently completed, so as to achieve co-
processing. Presently, some classic parallel comput-
ing models include MPI (Message Passing Interface),
MapReduce, and Dryad (See a comparison in Table 1).
Although the parallel computing systems or tools, such
as MapReduce or Dryad, are useful for big data analysis,
they are low levels tools that are hard to learn and use.
Therefore, some high-level parallel programming tools or
languages are being developed based on these systems. Such
high-level languages include Sawzall, Pig, and Hive used
for MapReduce, as well as Scope and DryadLINQ used for
Dryad.
4.6 Architecture for big data analysis
Because of the 4Vs of big data, different analytical
architectures shall be considered for different application
requirements.](https://image.slidesharecdn.com/bigdatasurvey-170106092413/85/Big-data-survey-21-320.jpg)
![Mobile Netw Appl (2014) 19:171–209 193
4.6.3 Analysis with different complexity
The time and space complexity of data analysis algorithms
differ greatly from each other according to different kinds
of data and application demands. For example, for applica-
tions that are amenable to parallel processing, a distributed
algorithm may be designed and a parallel processing model
may be used for data analysis.
4.7 Tools for big data mining and analysis
Many tools for big data mining and analysis are avail-
able, including professional and amateur software, expen-
sive commercial software, and open source software. In this
section, we briefly review the top five most widely used
software, according to a survey of “What Analytics, Data
mining, Big Data software that you used in the past 12
months for a real project?” of 798 professionals made by
KDNuggets in 2012 [112].
– R (30.7 %): R, an open source programming language
and software environment, is designed for data
mining/analysis and visualization. While computing-
intensive tasks are executed, code programmed with C,
C++ and Fortran may be called in the R environment. In
addition, skilled users can directly call R objects in C.
Actually, R is a realization of the S language, which is
an interpreted language developed by AT&T Bell Labs
and used for data exploration, statistical analysis, and
drawing plots. Compared to S, R is more popular since
it is open source. R ranks top 1 in the KDNuggets 2012
survey. Furthermore, in a survey of “Design languages
you have used for data mining/analysis in the past year”
in 2012, R was also in the first place, defeating SQL and
Java. Due to the popularity of R, database manufactur-
ers, such as Teradata and Oracle, have released products
supporting R.
– Excel (29.8 %): Excel, a core component of Microsoft
Office, provides powerful data processing and statisti-
cal analysis capabilities. When Excel is installed, some
advanced plug-ins, such as Analysis ToolPak and Solver
Add-in, with powerful functions for data analysis are
integrated initially, but such plug-ins can be used only
if users enable them. Excel is also the only commercial
software among the top five.
– Rapid-I Rapidminer (26.7 %): Rapidminer is an open
source software used for data mining, machine learn-
ing, and predictive analysis. In an investigation of
KDnuggets in 2011, it was more frequently used than
R (ranked Top 1). Data mining and machine learn-
ing programs provided by RapidMiner include Extract,
Transform and Load (ETL), data pre-processing and
visualization, modeling, evaluation, and deployment.
The data mining flow is described in XML and dis-
played through a graphic user interface (GUI). Rapid-
Miner is written in Java. It integrates the learner and
evaluation method of Weka, and works with R. Func-
tions of Rapidminer are implemented with connection
of processes including various operators. The entire
flow can be deemed as a production line of a factory,
with original data input and model results output. The
operators can be considered as some specific functions
with different input and output characteristics.
– KNMINE (21.8%): KNIME (Konstanz Information
Miner) is a user-friendly, intelligent, and open-source-
rich data integration, data processing, data analysis, and
data mining platform [113]. It allows users to create
data flows or data channels in a visualized manner,
to selectively run some or all analytical procedures,
and provides analytical results, models, and interac-
tive views. KNIME was written in Java and, based on
Eclipse, provides more functions as plug-ins. Through
plug-in files, users can insert processing modules for
files, pictures, and time series, and integrate them into
various open source projects, e.g., R and Weka. KNIME
controls data integration, cleansing, conversion, filter-
ing, statistics, mining, and finally data visualization.
The entire development process is conducted under
a visualized environment. KNIME is designed as a
module-based and expandable framework. There is no
dependence between its processing units and data con-
tainers, making it adaptive to the distributed environ-
ment and independent development. In addition, it is
easy to expand KNIME. Developers can effortlessly
expand various nodes and views of KNIME.
– Weka/Pentaho (14.8 %): Weka, abbreviated from
Waikato Environment for Knowledge Analysis, is a free
and open-source machine learning and data mining soft-
ware written in Java. Weka provides such functions as
data processing, feature selection, classification, regres-
sion, clustering, association rule, and visualization, etc.
Pentaho is one of the most popular open-source BI soft-
ware. It includes a web server platform and several tools
to support reporting, analysis, charting, data integration,
and data mining, etc., all aspects of BI. Weka’s data pro-
cessing algorithms are also integrated in Pentaho and
can be directly called.
5 Big data applications
In the previous section, we examined big data analysis,
which is the final and most important phase of the value
chain of big data. Big data analysis can provide useful
values via judgments, suggestions, supports, or decisions.](https://image.slidesharecdn.com/bigdatasurvey-170106092413/85/Big-data-survey-23-320.jpg)
![194 Mobile Netw Appl (2014) 19:171–209
However, data analysis involves a wide range of applica-
tions, which frequently change and are extremely complex.
In this section, we first review the evolution of data sources.
We then examine six of the most important data analysis
fields, including structured data analysis, text analysis, web-
site analysis, multimedia analysis, network analysis, and
mobile analysis. Finally, we introduce several key applica-
tion fields of big data.
5.1 Key applications of big data
5.1.1 Application evolutions
Recently, big data analysis has been proposed as an
advanced analytical technology, which typically includes
large-scale and complex programs under specific analytical
methods. As a matter of fact, data driven applications have
emerged in the past decades. For example, as early as 1990s,
BI has become a prevailing technology for business appli-
cations and, network search engines based on massive data
mining processing emerged in the early 21st century. Some
potential and influential applications from different fields
and their data and analysis characteristics are discussed as
follows.
– Evolution of Commercial Applications: The earliest
business data was generally structured data, which was
collected by companies from legacy systems and then
stored in RDBMSs. Analytical techniques used in such
systems were prevailing in the 1990s and was intu-
itive and simple, e.g., in the forms of reports, dash-
board, queries with condition, search-based business
intelligence, online transaction processing, interactive
visualization, score cards, predictive modeling, and
data mining [114]. Since the beginning of 21st cen-
tury, networks and the World Wide Web (WWW) has
been providing a unique opportunity for organizations
to have online display and directly interact with cus-
tomers. Abundant products and customer information,
such as clickstream data logs and user behavior, can be
acquired from the WWW. Product layout optimization,
customer trade analysis, product suggestions, and mar-
ket structure analysis can be conducted by text analysis
and website mining techniques. As reported in [115],
the quantity of mobile phones and tablet PC first sur-
passed that of laptops and PCs in 2011. Mobile phones
and Internet of Things based on sensors are opening a
new generation of innovation applications, and requir-
ing considerably larger capacity of supporting location
sensing, people oriented, and context-aware operation.
– Evolution of Network Applications: The early gen-
eration of the Internet mainly provided email and
the WWW services. Text analysis, data mining, and
webpage analysis have been applied to the mining of
email contents and building search engines. Nowadays,
most applications are web-based, regardless of their
field and design goals. Network data accounts for a
major percentage of the global data volume. Web has
become a common platform for interconnected pages,
full of various kinds of data, such as text, images, audio,
videos, and interactive contents, etc. Therefore, a plen-
tiful of advanced technologies used for semi-structured
or unstructured data emerged at the right moment. For
example, image analysis can extract useful information
from images, (e.g., face recognition). Multimedia anal-
ysis technologies can be applied to automated video
surveillance systems for business, law enforcement, and
military applications. Since 2004, online social media,
such as Internet forums, online communities, blogs,
social networking services, and social multimedia web-
sites, provide users with great opportunities to create,
upload, and share contents.
– Evolution of Scientific Applications: Scientific research
in many fields is acquiring massive data with high-
throughput sensors and instruments, such as astro-
physics, oceanology, genomics, and environmental
research. The U.S. National Science Foundation (NSF)
has recently announced the BIGDATA program to pro-
mote efforts to extract knowledge and insights from
large and complex collections of digital data. Some
scientific research disciplines have developed big data
platforms and obtained useful outcomes. For example,
in biology, iPlant [116] applies network infrastructure,
physical computing resources, coordination environ-
ment, virtual machine resources, inter-operative anal-
ysis software, and data service to assist researchers,
educators, and students in enriching plant sciences. The
iPlant datasets have high varieties in form, including
specification or reference data, experimental data, ana-
log or model data, observation data, and other derived
data.
As discussed, we can divide data analysis research into
six key technical fields, i.e., structured data analysis, text
data analysis, web data analysis, multimedia data analy-
sis, network data analysis, and mobile data analysis. Such
a classification aims to emphasize data characteristics, but
some of the fields may utilize similar basic technologies.
Since data analysis has a broad scope and it is not easy to
have a comprehensive coverage, we will focus on the key
problems and technologies in data analysis in the following
discussions.](https://image.slidesharecdn.com/bigdatasurvey-170106092413/85/Big-data-survey-24-320.jpg)
![Mobile Netw Appl (2014) 19:171–209 195
5.1.2 Structured data analysis
Business applications and scientific research may generate
massive structured data, of which the management and anal-
ysis rely on mature commercialized technologies, such as
RDBMS, data warehouse, OLAP, and BPM (Business Pro-
cess Management) [28]. Data analysis is mainly based on
data mining and statistical analysis, both of which have been
well studied over the past 30 years.
However, data analysis is still a very active research field
and new application demands drive the development of new
methods. For example, statistical machine learning based on
exact mathematical models and powerful algorithms have
been applied to anomaly detection [117] and energy con-
trol [118]. Exploiting data characteristics, time and space
mining can extract knowledge structures hidden in high-
speed data flows and sensors [119]. Driven by privacy
protection in e-commerce, e-government, and health care
applications, privacy protection data mining is an emerging
research field [120]. Over the past decade, process mining is
becoming a new research field especially in process analysis
with event data [121].
5.1.3 Text data analysis
The most common format of information storage is text,
e.g., emails, business documents, web pages, and social
media. Therefore, text analysis is deemed to feature more
business-based potential than structured data. Generally,
text analysis is a process to extract useful information
and knowledge from unstructured text. Text mining is
inter-disciplinary, involving information retrieval, machine
learning, statistics, computing linguistics, and data min-
ing in particular. Most text mining systems are based on
text expressions and natural language processing (NLP),
with more emphasis on the latter. NLP allows comput-
ers to analyze, interpret, and even generate text. Some
common NLP methods include lexical acquisition, word
sense disambiguation, part-of-speech tagging, and prob-
abilistic context free grammar [122]. Some NLP-based
techniques have been applied to text mining, including
information extraction, topic models, text summarization,
classification, clustering, question answering, and opinion
mining.
5.1.4 Web data analysis
Web data analysis has emerged as an active research field.
It aims to automatically retrieve, extract, and evaluate infor-
mation from Web documents and services so as to dis-
cover useful knowledge. Web analysis is related to several
research fields, including database, information retrieval,
NLP, and text mining. According to the different parts be
mined, we classify Web data analysis into three related
fields: Web content mining, Web structure mining, and Web
usage mining [123].
Web content mining is the process to discover useful
knowledge in Web pages, which generally involve several
types of data, such as text, image, audio, video, code, meta-
data, and hyperlink. The research on image, audio, and
video mining has recently been called multimedia analysis,
which will be discussed in the Section 6.1.5. Since most
Web content data is unstructured text data, the research on
Web data analysis mainly centers around text and hypertext.
Text mining is discussed in Section 6.1.3 while Hypertext
mining involves the mining of the semi-structured HTML
files that contain hyperlinks. Supervised learning and clas-
sification play important roles in hyperlink mining, e.g.,
email, newsgroup management, and Web catalogue mainte-
nance [124]. Web content mining can be conducted with two
methods: the information retrieval method and the database
method. Information retrieval mainly assists in or improves
information lookup, or filters user information according
to deductions or configuration documents. The database
method aims to simulate and integrate data in Web, so as to
conduct more complex queries than searches based on key
words.
Web structure mining involves models for discover-
ing Web link structures. Here, the structure refers to the
schematic diagrams linked in a website or among multiple
websites. Models are built based on topological structures
provided with hyperlinks with or without link descrip-
tion. Such models reveal the similarities and correlations
among different websites and are used to classify website
pages. Page Rank [125] and CLEVER [126] make full use
of the models to look up relevant website pages. Topic-
oriented crawler is another successful case by utilizing the
models [127].
Web usage mining aims to mine auxiliary data gener-
ated by Web dialogues or activities. Web content mining
and Web structure mining use the master Web data. Web
usage data includes access logs at Web servers and proxy
servers, browsers’ history records, user profiles, registration
data, user sessions or trades, cache, user queries, bookmark
data, mouse clicks and scrolls, and any other kinds of data
generated through interaction with the Web. As Web ser-
vices and Web2.0 are becoming mature and popular, Web
usage data will have increasingly high variety. Web usage
mining plays key roles in personalized space, e-commerce,
network privacy/security, and other emerging fields. For
example, collaborative recommender systems can person-
alize e-commerce by utilizing the different preferences of
users.](https://image.slidesharecdn.com/bigdatasurvey-170106092413/85/Big-data-survey-25-320.jpg)
![196 Mobile Netw Appl (2014) 19:171–209
5.1.5 Multimedia data analysis
Multimedia data (mainly including images, audio, and
videos) have been growing at an amazing speed, which is
extracted useful knowledge and understand the semantemes
by analysis. Because multimedia data is heterogeneous and
most of such data contains richer information than sim-
ple structured data or text data, extracting information is
confronted with the huge challenge of the semantic dif-
ferences. Research on multimedia analysis covers many
disciplines. Some recent research priorities include multi-
media summarization, multimedia annotation, multimedia
index and retrieval, multimedia suggestion, and multimedia
event detection, etc.
Audio summarization can be accomplished by extracting
the prominent words or phrases from metadata or syn-
thesizing a new representation. Video summarization is to
interpret the most important or representative video con-
tent sequence, and it can be static or dynamic. Static video
summarization methods utilize a key frame sequence or
context-sensitive key frames to represent a video. Such
methods are simple and have been applied to many business
applications (e.g., by Yahoo, AltaVista and Google), but
their performance is poor. Dynamic summarization meth-
ods use a series of video frame to represent a video, and
take other smooth measures to make the final summariza-
tion look more natural. In [128], the authors propose a
topic-oriented multimedia summarization system (TOMS)
that can automatically summarize the important information
in a video belonging to a certain topic area, based on a given
set of extracted features from the video.
Multimedia annotation inserts labels to describe con-
tents of images and videos at both syntax and semantic
levels. With such labels, the management, summarization,
and retrieval of multimedia data can be easily implemented.
Since manual annotation is both time and labor inten-
sive, automatic annotation without any human interventions
becomes highly appealing. The main challenge for auto-
matic multimedia annotation is the semantic difference.
Although much progress has been made, the performance
of existing automatic annotation methods still needs to be
improved. Currently, many efforts are being made to syn-
chronously explore both manual and automatic multimedia
annotation [129].
Multimedia indexing and retrieval involve describing,
storing, and organizing multimedia information and assist-
ing users to conveniently and quickly look up multime-
dia resources [130]. Generally, multimedia indexing and
retrieval include five procedures: structural analysis, feature
extraction, data mining, classification and annotation, query
and retrieval [131]. Structural analysis aims to segment a
video into several semantic structural elements, including
lens boundary detection, key frame extraction, and scene
segmentation, etc. According to the result of structural
analysis, the second procedure is feature extraction, which
mainly includes further mining the features of key frames,
objects, texts, and movements, which are the foundation of
video indexing and retrieval. Data mining, classification,
and annotation are to utilize the extracted features to find
the modes of video contents and put videos into scheduled
categories so as to generate video indexes. Upon receiving a
query, the system will use a similarity measurement method
to look up a candidate video. The retrieval result optimizes
the related feedback.
Multimedia recommendation is to recommend specific
multimedia contents according to users’ preferences. It is
proven to be an effective approach to provide personal-
ized services. Most existing recommendation systems can
be classified into content-based systems and collaborative-
filtering-based systems. The content-based methods identify
general features of users or their interesting, and recom-
mend users for other contents with similar features. These
methods largely rely on content similarity measurement,
but most of them are troubled by analysis limitation and
excessive specifications. The collaborative-filtering-based
methods identify groups with similar interests and recom-
mend contents for group members according to their behav-
ior [132]. Presently, a mixed method is introduced, which
integrates advantages of the aforementioned two types of
methods to improve recommendation quality [133].
The U.S. National Institute of Standards and Technol-
ogy (NIST) initiated the TREC Video Retrieval Evaluation
for detecting the occurrence of an event in video-clips
based on Event Kit, which contains some text description
related to concepts and video examples [134]. In [135],
the author proposed a new algorithm on special multimedia
event detection using a few positive training examples. The
research on video event detection is still in its infancy, and
mainly focuses on sports or news events, running or abnor-
mal events in monitoring videos, and other similar events
with repetitive patterns.
5.1.6 Network data analysis
Network data analysis evolved from the initial quantita-
tive analysis [136] and sociological network analysis [137]
into the emerging online social network analysis in the
beginning of 21st century. Many online social networking
services include Twitter, Facebook, and LinkedIn, etc. have
become increasingly popular over the years. Such online
social network services generally include massive linked
data and content data. The linked data is mainly in the
form of graphic structures, describing the communications
between two entities. The content data contains text, image,
and other network multimedia data. The rich content in
such networks brings about both unprecedented challenges](https://image.slidesharecdn.com/bigdatasurvey-170106092413/85/Big-data-survey-26-320.jpg)
![Mobile Netw Appl (2014) 19:171–209 197
and opportunities for data analysis. In accordance with the
data-centered perspective, the existing research on social
networking service contexts can be classified into two cat-
egories: link-based structural analysis and content-based
analysis [138].
The research on link-based structural analysis has always
been committed on link prediction, community discovery,
social network evolution, and social influence analysis, etc.
SNS may be visualized as graphs, in which every vertex
corresponds to a user and edges correspond to the correla-
tions among users. Since SNS are dynamic networks, new
vertexes and edges are continually added to the graphs.
Link prediction is to predict the possibility of future con-
nection between two vertexes. Many techniques can be
used for link prediction, e.g., feature-based classification,
probabilistic methods, and Linear Algebra. Feature-based
classification is to select a group of features for a ver-
tex and utilize the existing link information to generate
binary classifiers to predict the future link [139]. Probabilis-
tic methods aim to build models for connection probabilities
among vertexes in SNS [140]. Linear Algebra computes the
similarity between two vertexes according to the singular
similar matrix [141]. A community is represented by a sub-
graphic matrix, in which edges connecting vertexes in the
sub-graph feature high density while the edges between two
sub-graphs feature much lower density [142].
Many methods for community detection have been pro-
posed and studied, most of which are topology-based target
functions relying on the concept of capturing community
structure. Du et al. utilized the property of overlapping com-
munities in real life to propose an effective large-scale SNS
community detection method [143]. The research on SNS
aims to look for a law and deduction model to interpret
network evolution. Some empirical studies found that prox-
imity bias, geographical limitations, and other factors play
important roles in SNS evolution [144–146], and some gen-
eration methods are proposed to assist network and system
design [147].
Social influence refers to the case when individuals
change their behavior under the influence of others. The
strength of social influence depends on the relation among
individuals, network distances, time effect, and characteris-
tics of networks and individuals, etc. Marketing, advertise-
ment, recommendation, and other applications can benefit
from social influence by qualitatively and quantitatively
measuring the influence of individuals on others [148, 149].
Generally, if the proliferation of contents in SNS is consid-
ered, the performance of link-based structural analysis may
be further improved.
Content-based analysis in SNS is also known as social
media analysis. Social media include text, multimedia, posi-
tioning, and comments. However, social media analysis
is confronted with unprecedented challenges. First, mas-
sive and continually growing social media data should be
automatically analyzed within a reasonable time window.
Second, social media data contains much noise. For exam-
ple, blogosphere contains a large number of spam blogs, and
so does trivial Tweets in Twitter. Third, SNS are dynamic
networks, which are frequently and quickly varying and
updated. The existing research on social media analysis is
still in its infancy. Considering that SNS contains massive
information, transfer learning in heterogeneous networks
aims to transfer knowledge information among different
media [150].
5.1.7 Mobile data analysis
By April 2013, Android Apps has provided more than
650,000 applications, covering nearly all categories. By the
end of 2012, the monthly mobile data flow has reached
885 PB [151]. The massive data and abundant applica-
tions call for mobile analysis, but also bring about a few
challenges. As a whole, mobile data has unique character-
istics, e.g., mobile sensing, moving flexibility, noise, and
a large amount of redundancy. Recently, new research on
mobile analysis has been started in different fields. Since
the research on mobile analysis is just started, we will only
introduce some recent and representative analysis applica-
tions in this section.
With the growth of numbers of mobile users and
improved performance, mobile phones are now useful for
building and maintaining communities, such as communi-
ties with geographical locations and communities based on
different cultural backgrounds and interests(e.g., the latest
Webchat). Traditional network communities or SNS com-
munities are in short of online interaction among members,
and the communities are active only when members are sit-
ting before computers. On the contrary, mobile phones can
support rich interaction at any time and anywhere. Mobile
communities are defined as that a group of individuals with
the same hobbies (i.e., health, safety, and entertainment,
etc.) gather together on networks, meet to make a com-
mon goal, decide measures through consultation to achieve
the goal, and start to implement their plan [152]. In [153],
the authors proposed a qualitative model of a mobile com-
munity. It is now widely believed that mobile community
applications will greatly promote the development of the
mobile industry.
Recently, the progress in wireless sensor, mobile commu-
nication technology, and stream processing enable people to
build a body area network to have real-time monitoring of
people’s health. Generally, medical data from various sen-
sors have different characteristics in terms of attributes, time
and space relations, as well as physiological relations, etc.](https://image.slidesharecdn.com/bigdatasurvey-170106092413/85/Big-data-survey-27-320.jpg)
![198 Mobile Netw Appl (2014) 19:171–209
In addition, such datasets involve privacy and safety protec-
tion. In [154], Garg et al. introduce a multi-modal transport
analysis mechanism of raw data for real-time monitoring of
health. Under the circumstance that only highly comprehen-
sive characteristics related to health are available, Park et al.
in [155] examined approaches to better utilize.
Researchers from Gjovik University College in Norway
and Derawi Biometrics collaborated to develop an applica-
tion for smart phones, which analyzes paces when people
walk and uses the pace information for unlocking the safety
system [11]. In the meanwhile, Robert Delano and Brian
Parise from Georgia Institute of Technology developed an
application called iTrem, which monitors human body trem-
bling with a built-in seismograph in a mobile phone, so as to
cope with Parkinson and other nervous system diseases [11].
5.2 Key applications of big data
5.2.1 Application of big data in enterprises
At present, big data mainly comes from and is mainly used
in enterprises, while BI and OLAP can be regarded as the
predecessors of big data application. The application of big
data in enterprises can enhance their production efficiency
and competitiveness in many aspects. In particular, on mar-
keting, with correlation analysis of big data, enterprises can
more accurately predict the consumer behavior and find
new business modes. On sales planning, after comparison
of massive data, enterprises can optimize their commodity
prices. On operation, enterprises can improve their opera-
tion efficiency and satisfaction, optimize the labor force,
accurately forecast personnel allocation requirements, avoid
excess production capacity, and reduce labor cost. On sup-
ply chain, using big data, enterprises may conduct inventory
optimization, logistic optimization, and supplier coordina-
tion, etc., to mitigate the gap between supply and demand,
control budgets, and improve services.
In finance, the application of big data in enterprises
has been rapidly developed. For example, China Merchants
Bank (CMB) utilizes data analysis to recognize that such
activities as “Multi-times score accumulation” and “score
exchange in shops” are effective for attracting quality cus-
tomers. By building a customer drop out warning model, the
bank can sell high-yield financial products to the top 20 %
customers who are most likely to drop out so as to retain
them. As a result, the drop out ratios of customers with Gold
Cards and Sunflower Cards have been reduced by 15 %
and 7 %, respectively. By analyzing customers’ transaction
records, potential small business customers can be effi-
ciently identified. By utilizing remote banking and the cloud
referral platform to implement cross-selling, considerable
performance gains were achieved.
Obviously, the most classic application is in e-commerce.
Tens of thousands of transactions are conducted in Taobao
and the corresponding transaction time, commodity prices,
and purchase quantities are recorded every day, and more
important, along with age, gender, address, and even hob-
bies and interests of buyers and sellers. Data Cube of Taobao
is a big data application on the Taobao platform, through
which, merchants can be ware of the macroscopic indus-
trial status of the Taobao platform, market conditions of
their brands, and consumers’ behaviors, etc., and accord-
ingly make production and inventory decisions. Meanwhile,
more consumers can purchase their favorite commodities
with more preferable prices. The credit loan of Alibaba
automatically analyzes and judges weather to lend loans to
enterprises through the acquired enterprise transaction data
by virtue of big data technology, while manual intervention
does not occur in the entire process. It is disclosed that, so
far, Alibaba has lent more than RMB 30 billion Yuan with
only about 0.3 % bad loans, which is greatly lower than
those of other commercial banks.
5.2.2 Application of IoT based big data
IoT is not only an important source of big data, but also one
of the main markets of big data applications. Because of the
high variety of objects, the applications of IoT also evolve
endlessly.
Logistic enterprises may have profoundly experienced
with the application of IoT big data. For example, trucks of
UPS are equipped with sensors, wireless adapters, and GPS,
so the Headquarter can track truck positions and prevent
engine failures. Meanwhile, this system also helps UPS to
supervise and manage its employees and optimize delivery
routes. The optimal delivery routes specified for UPS trucks
are derived from their past driving experience. In 2011, UPS
drivers have driven for nearly 48.28 million km less.
Smart city is a hot research area based on the application
of IoT data. For example, the smart city project coopera-
tion between the Miami-Dade County in Florida and IBM
closely connects 35 types of key county government depart-
ments and Miami city and helps government leaders obtain
better information support in decision making for manag-
ing water resources, reducing traffic jam, and improving
public safety. The application of smart city brings about
benefits in many aspects for Dade County. For instance, the
Department of Park Management of Dade County saved one
million USD in water bills due to timely identifying and
fixing water pipes that were running and leaking this year.
5.2.3 Application of online social network-oriented big data
Online SNS is a social structure constituted by social indi-
viduals and connections among individuals based on an](https://image.slidesharecdn.com/bigdatasurvey-170106092413/85/Big-data-survey-28-320.jpg)
![Mobile Netw Appl (2014) 19:171–209 199
information network. Big data of online SNS mainly comes
from instant messages, online social, micro blog, and shared
space, etc, which represents various user activities. The
analysis of big data from online SNS uses computational
analytical method provided for understanding relations in
the human society by virtue of theories and methods,
which involves mathematics, informatics, sociology, and
management science, etc., from three dimensions includ-
ing network structure, group interaction, and information
spreading. The application includes network public opin-
ion analysis, network intelligence collection and analysis,
socialized marketing, government decision-making support,
and online education, etc. Fig. 5 illustrates the technical
framework of the application of big data of online SNS.
Classic applications of big data from online SNS are intro-
duced in the following, which mainly mine and analyze
content information and structural information to acquire
values.
– Content-based Applications: Language and text are the
two most important forms of presentation in SNS.
Through the analysis of language and text, user pref-
erence, emotion, interest, and demand, etc. may be
revealed.
– Structure-based Applications: In SNS, users are rep-
resented as nodes while social relation, interest, and
hobbies, etc. aggregate relations among users into a
clustered structure. Such structure with close relations
among internal individuals but loose external relations
is also called a community. The community-based anal-
ysis is of vital importance to improve information
propagation and for interpersonal relation analysis.
The U.S. Santa Cruz Police Department experi-
mented by applying data for predictive analysis. By
analyzing SNS, the police department can discover
crime trends and crime modes, and even predict the
crime rates in major regions [11].
In April 2013, Wolfram Alpha, a computing and
search engine company, studied the law of social behav-
ior by analyzing social data of more than one million
American users of Facebook. According to the anal-
ysis, it was found that most Facebook users fall in
love in their early 20s, and get engaged when they
are about 27 years old, then get married when they
are about 30 years old. Finally, their marriage relation-
ships exhibit slow changes between 30 and 60 years
old. Such research results are highly consistent with the
demographic census data of the U.S. In addition, Global
Pulse conducted a research that revealed some laws in
social and economic activities using SNS data. This
project utilized publicly available Twitter messages in
English, Japanese, and Indonesian from July 2010 to
October 2011, to analyze topics related to food, fuel,
housing, and loan. The goal is to better understand pub-
lic behavior and concerns. This project analyzed SNS
big data from several aspects: 1) predicting the occur-
rence of abnormal events by detecting the sharp growth
Fig. 5 Enabling technologies
for online social
network-oriented big data](https://image.slidesharecdn.com/bigdatasurvey-170106092413/85/Big-data-survey-29-320.jpg)
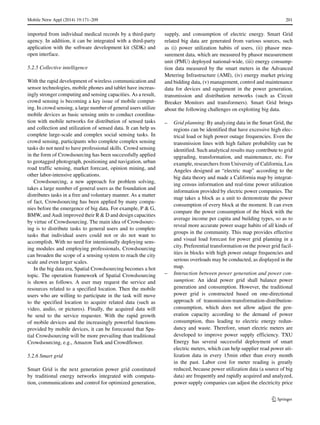
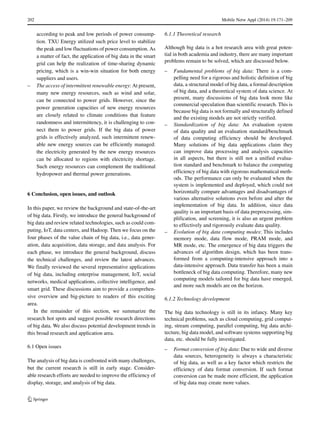
![Mobile Netw Appl (2014) 19:171–209 203
– Big data transfer: Big data transfer involves big data
generation, acquisition, transmission, storage, and other
data transformations in the spatial domain. As dis-
cussed, big data transfer usually incurs high costs,
which is the bottleneck for big data computing. How-
ever, data transfer is inevitable in big data applications.
Improving the transfer efficiency of big data is a key
factor to improve big data computing.
– Real-time performance of big data: The real-time per-
formance of big data is also a key problem in many
application scenarios. Effective means to define the life
cycle of data, compute the rate of depreciation of data,
and build computing models of real-time and online
applications, will influence the analysis results of big
data.
– Processing of big data: As big data research is
advanced, new problems on big data processing arise
from the traditional data analysis, including (i) data
re-utilization, with the increase of data scale, more
values may be mined from re-utilization of existing
data; (ii) data re-organization, datasets in different busi-
nesses can be re-organized, which can be mined more
value; (iii) data exhaust, which means wrong data dur-
ing acquisition. In big data, not only the correct data but
also the wrong data should be utilized to generate more
value.
6.1.3 Practical implications
Although there are already many successful big data appli-
cations, many practical problems should be solved:
– Big data management: The emergence of big data
brings about new challenges to traditional data man-
agement. At present, many research efforts are being
made on big data oriented database and Internet tech-
nologies, storage models and databases suitable for
new hardware, heterogeneous and multi-structured data
integration, data management of mobile and pervasive
computing, data management of SNS, and distributed
data management.
– Searching, mining, and analysis of big data: Data pro-
cessing is always a research hotspot in big data. Related
problems include searching and mining of SNS models,
big data searching algorithms, distributed searching,
P2P searching, visualized analysis of big data, mas-
sive recommendation systems, social media systems,
real-time big data mining, image mining, text min-
ing, semantic mining, multi-structured data mining, and
machine learning, etc.
– Integration and provenance of big data: As discussed,
the value acquired from comprehensive utilization of
multiple datasets is far higher than the sum value of
individual dataset. Therefore, the integration of differ-
ent data sources is a timely problem. Data integration
is confronted with many challenges, such as different
data patterns and a large amount of redundant data.
Data provenance is the process of data generation and
evolution over time, and mainly used to investigate mul-
tiple datasets other than a single dataset. Therefore, it
is worth studying on how to integrate data provenance
information featuring different standards and from dif-
ferent datasets.
– Big data application: At present, the application of big
data is just beginning and we shall explore more effi-
ciently ways to fully utilize big data. Therefore, big data
applications in science, engineering, medicine, medi-
cal care, finance, business, law enforcement, education,
transportation, retail, and telecommunication, big data
applications in small and medium-sized businesses, big
data applications in government departments, big data
services, and human-computer interaction of big data,
etc. are all important research problems.
6.1.4 Data security
In IT, safety and privacy are always two key concerns. In
the big data era, as data volume is fast growing, there are
more severe safety risks, while the traditional data protec-
tion methods have already been shown not applicable to big
data. In particular, big data safety is confronted with the
following security related challenges.
– Big data privacy: Big data privacy includes two aspects:
(i) Protection of personal privacy during data acquisi-
tion: personal interests, habits, and body properties, etc.
of users may be more easily acquired, and users may
not be aware. (ii) Personal privacy data may also be
leaked during storage, transmission, and usage, even
if acquired with the permission of users. For example,
Facebook is deemed as a big data company with the
most SNS data currently. According to a report [156],
Ron Bowes, a researcher of Skull Security, acquired
data in the public pages of Facebook users who fail to
modify their privacy setting via an information acqui-
sition tool. Ron Bowes packaged such data into a 2.8
GB package and created a BitTorrent (BT) seed for oth-
ers to download. The analysis capacity of big data may
lead to privacy mining from seemingly simple informa-
tion. Therefore, privacy protection will become a new
and challenging problem.
– Data quality: Data quality influences big data utiliza-
tion. Low quality data wastes transmission and storage
resources with poor usability. There are a lot of factors
that may restrict data quality, for example, generation,
acquisition, and transmission may all influence data](https://image.slidesharecdn.com/bigdatasurvey-170106092413/85/Big-data-survey-33-320.jpg)
![Mobile Netw Appl (2014) 19:171–209 205
utilizes relational diagrams to express interpersonal
relationship.
– Data-oriented: It is well-known that programs con-
sist of data structures and algorithms, and data struc-
tures are used to store data. In the history of program
design, it is observed that the role of data is becoming
increasingly more significant. In the small scale data
era, in which logic is more complex than data, pro-
gram design is mainly process-oriented. As business
data is becoming more complex, object-oriented design
methods are developed. Nowadays, the complexity of
business data has far surpassed business logic. Con-
sequently, programs are gradually transformed from
algorithm-intensive to data-intensive. It is anticipated
that data-oriented program design methods are certain
to emerge, which will have far-reaching influence on
the development of IT in software engineering, archi-
tecture, and model design, among others.
– Big data triggers the revolution of thinking: Gradually,
big data and its analysis will profoundly influence our
ways of thinking. In [11], the authors summarize the
thinking revolution triggered by big data as follows:
– During data analysis, we will try to utilize all
data other than only analyzing a small set of
sample data.
– Compared with accurate data, we would like to
accept numerous and complicated data.
– We shall pay greater attention to correlations
between things other than exploring causal
relationship.
– The simple algorithms of big data are more
effective than complex algorithms of small
data.
– Analytical results of big data will reduce hasty
and subjective factors during decision making,
and data scientists will replace “experts.”
Throughout the history of human society, the demands
and willingness of human beings are always the source pow-
ers to promote scientific and technological progress. Big
data may provides reference answers for human beings to
make decisions through mining and analytical processing,
but it could not replace human thinking. It is human think-
ing that promotes the widespread utilizations of big data.
Big data is more like an extendable and expandable human
brain other than a substitute of the human brain. With the
emergence of IoT, development of mobile sensing technol-
ogy, and progress of data acquisition technology, people are
not only the users and consumers of big data, but also its
producers and participants. Social relation sensing, crowd-
sourcing, analysis of big data in SNS, and other applications
closely related to human activities based on big data will be
increasingly concerned and will certainly cause enormous
transformations of social activities in the future society.
Acknowledgments This work was supported by China National
Natural Science Foundation (No. 61300224), the Ministry of Sci-
ence and Technology (MOST), China, the International Science and
Technology Collaboration Program (Project No.: S2014GAT014), and
the Hubei Provincial Key Project (No. 2013CFA051). Shiwen Mao’s
research is supported in part by the US NSF under grants CNS-
1320664, CNS-1247955, and CNS-0953513, and through the NSF
Broadband Wireless Access & Applications Center (BWAC) site at
Auburn University.
References
1. Gantz J, Reinsel D (2011) Extracting value from chaos. IDC
iView, pp 1–12
2. Fact sheet: Big data across the federal government (2012). http://
www.whitehouse.gov/sites/default/files/microsites/ostp/big data
fact sheet 3 29 2012.pdf
3. Cukier K (2010) Data, data everywhere: a special report on
managing information. Economist Newspaper
4. Drowning in numbers - digital data will flood the planet- and help
us understand it better (2011). http://www.economist.com/blogs/
dailychart/2011/11/bigdata-0
5. Lohr S (2012) The age of big data. New York Times, pp 11
6. Yuki N (2011) Following digital breadcrumbs to big data gold.
http://www.npr.org/2011/11/29/142521910/thedigitalbreadcrumbs-
that-lead-to-big-data
7. Yuki N The search for analysts to make sense of big data (2011).
http://www.npr.org/2011/11/30/142893065/the-searchforanalysts-
to-make-sense-of-big-data
8. Big data (2008). http://www.nature.com/news/specials/bigdata/
index.html
9. Special online collection: dealing with big data (2011). http://
www.sciencemag.org/site/special/data/
10. Manyika J, McKinsey Global Institute, Chui M, Brown B,
Bughin J, Dobbs R, Roxburgh C, Byers AH (2011) Big data:
the next frontier for innovation, competition, and productivity.
McKinsey Global Institute
11. Mayer-Sch¨onberger V, Cukier K (2013) Big data: a revolu-
tion that will transform how we live, work, and think. Eamon
Dolan/Houghton Mifflin Harcourt
12. Laney D (2001) 3-d data management: controlling data volume,
velocity and variety. META Group Research Note, 6 February
13. Zikopoulos P, Eaton C et al (2011) Understanding big data: ana-
lytics for enterprise class hadoop and streaming data. McGraw-
Hill Osborne Media
14. Meijer E (2011) The world according to linq. Communications
of the ACM 54(10):45–51
15. Beyer M (2011) Gartner says solving big data challenge involves
more than just managing volumes of data. Gartner. http://www.
gartner.com/it/page.jsp
16. O. R. Team (2011) Big data now: current perspectives from
OReilly Radar. OReilly Media
17. Grobelnik M (2012) Big data tutorial. http://videolectures.net/
eswc2012grobelnikbigdata/
18. Ginsberg J, Mohebbi MH, Patel RS, Brammer L, Smolinski MS,
Brilliant L (2008) Detecting influenza epidemics using search
engine query data. Nature 457(7232):1012–1014
19. DeWitt D, Gray J (1992) Parallel database systems: the future of
high performance database systems. Commun ACM 35(6):85–98](https://image.slidesharecdn.com/bigdatasurvey-170106092413/85/Big-data-survey-35-320.jpg)