Download to read offline
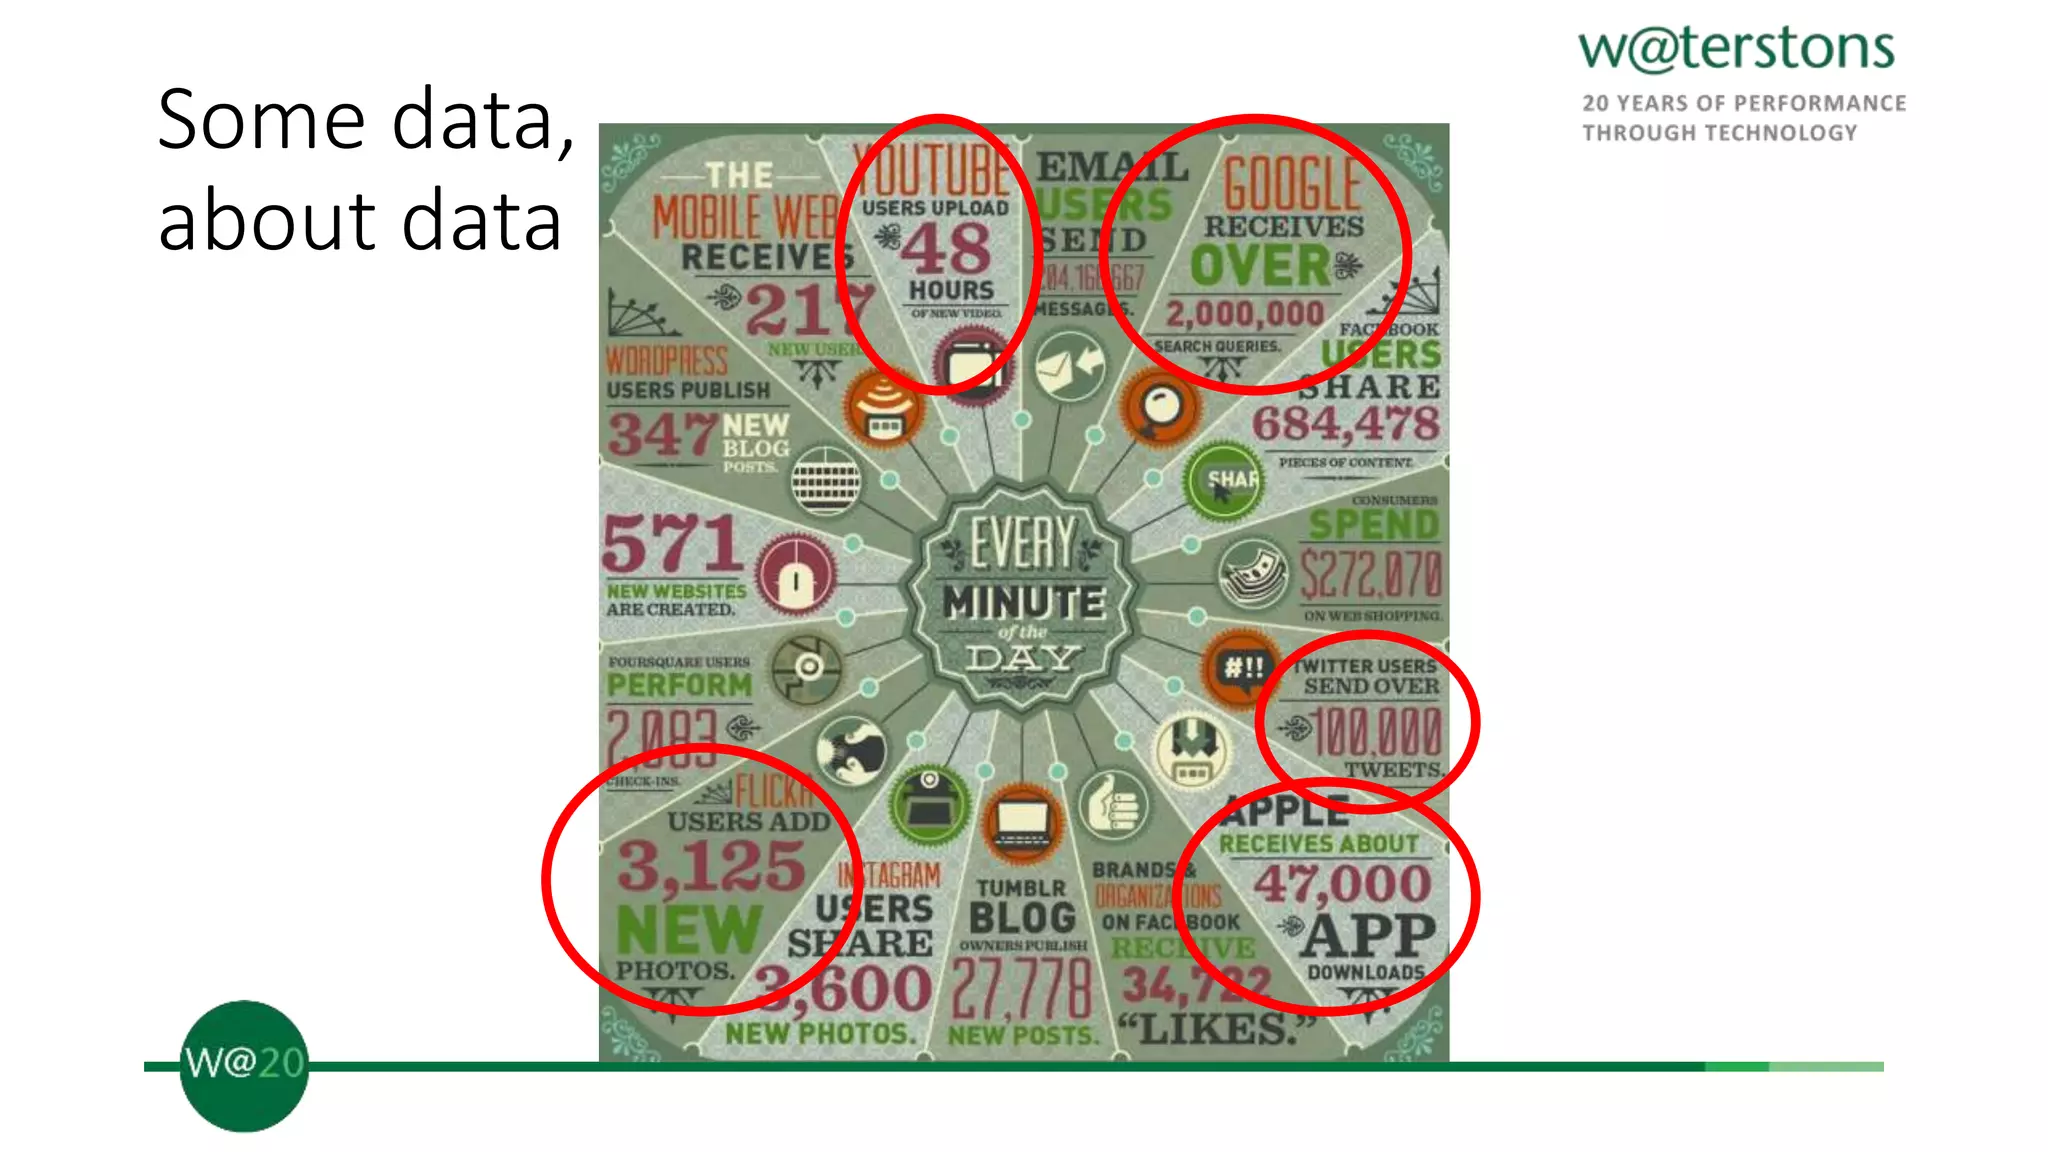
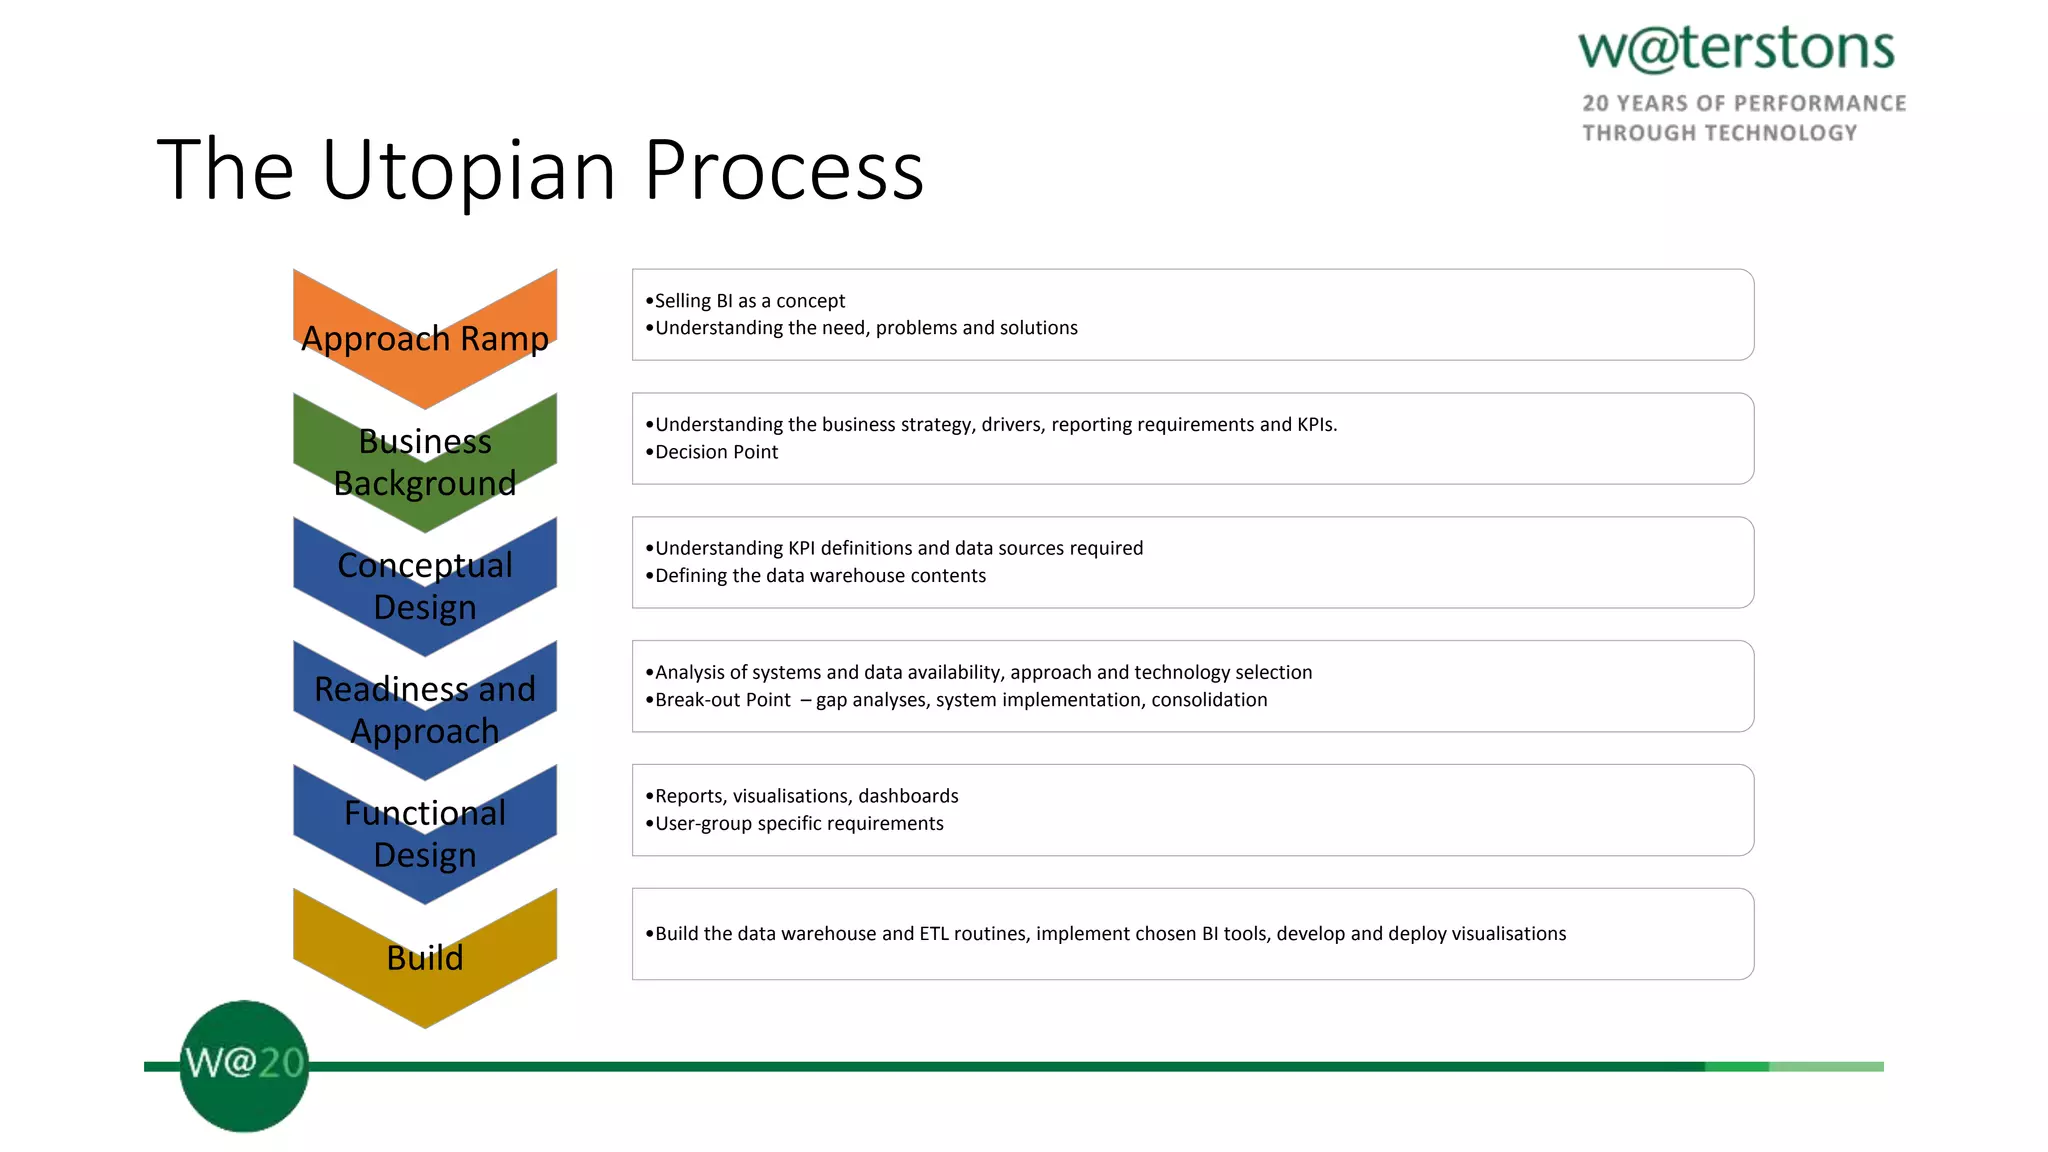
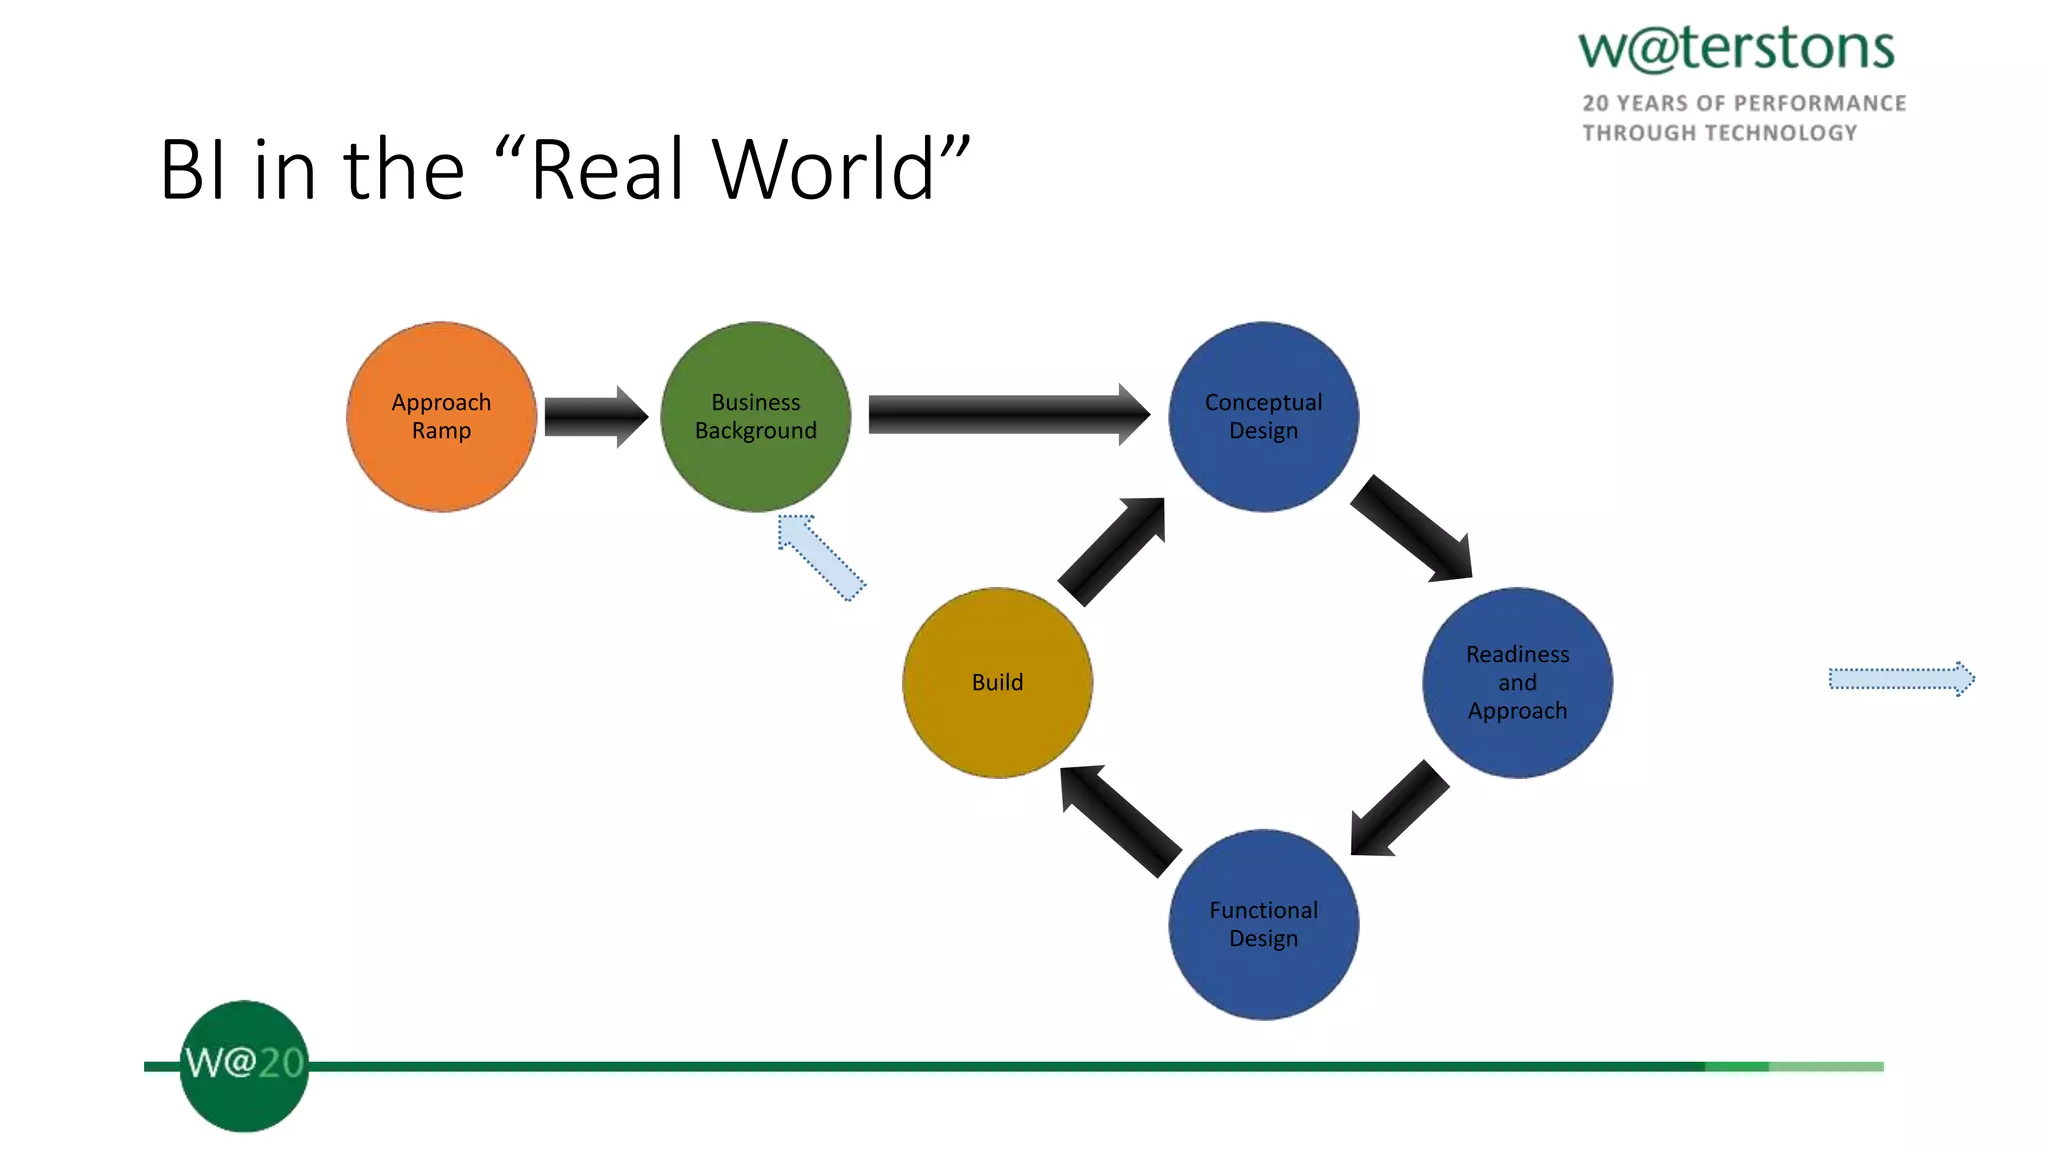
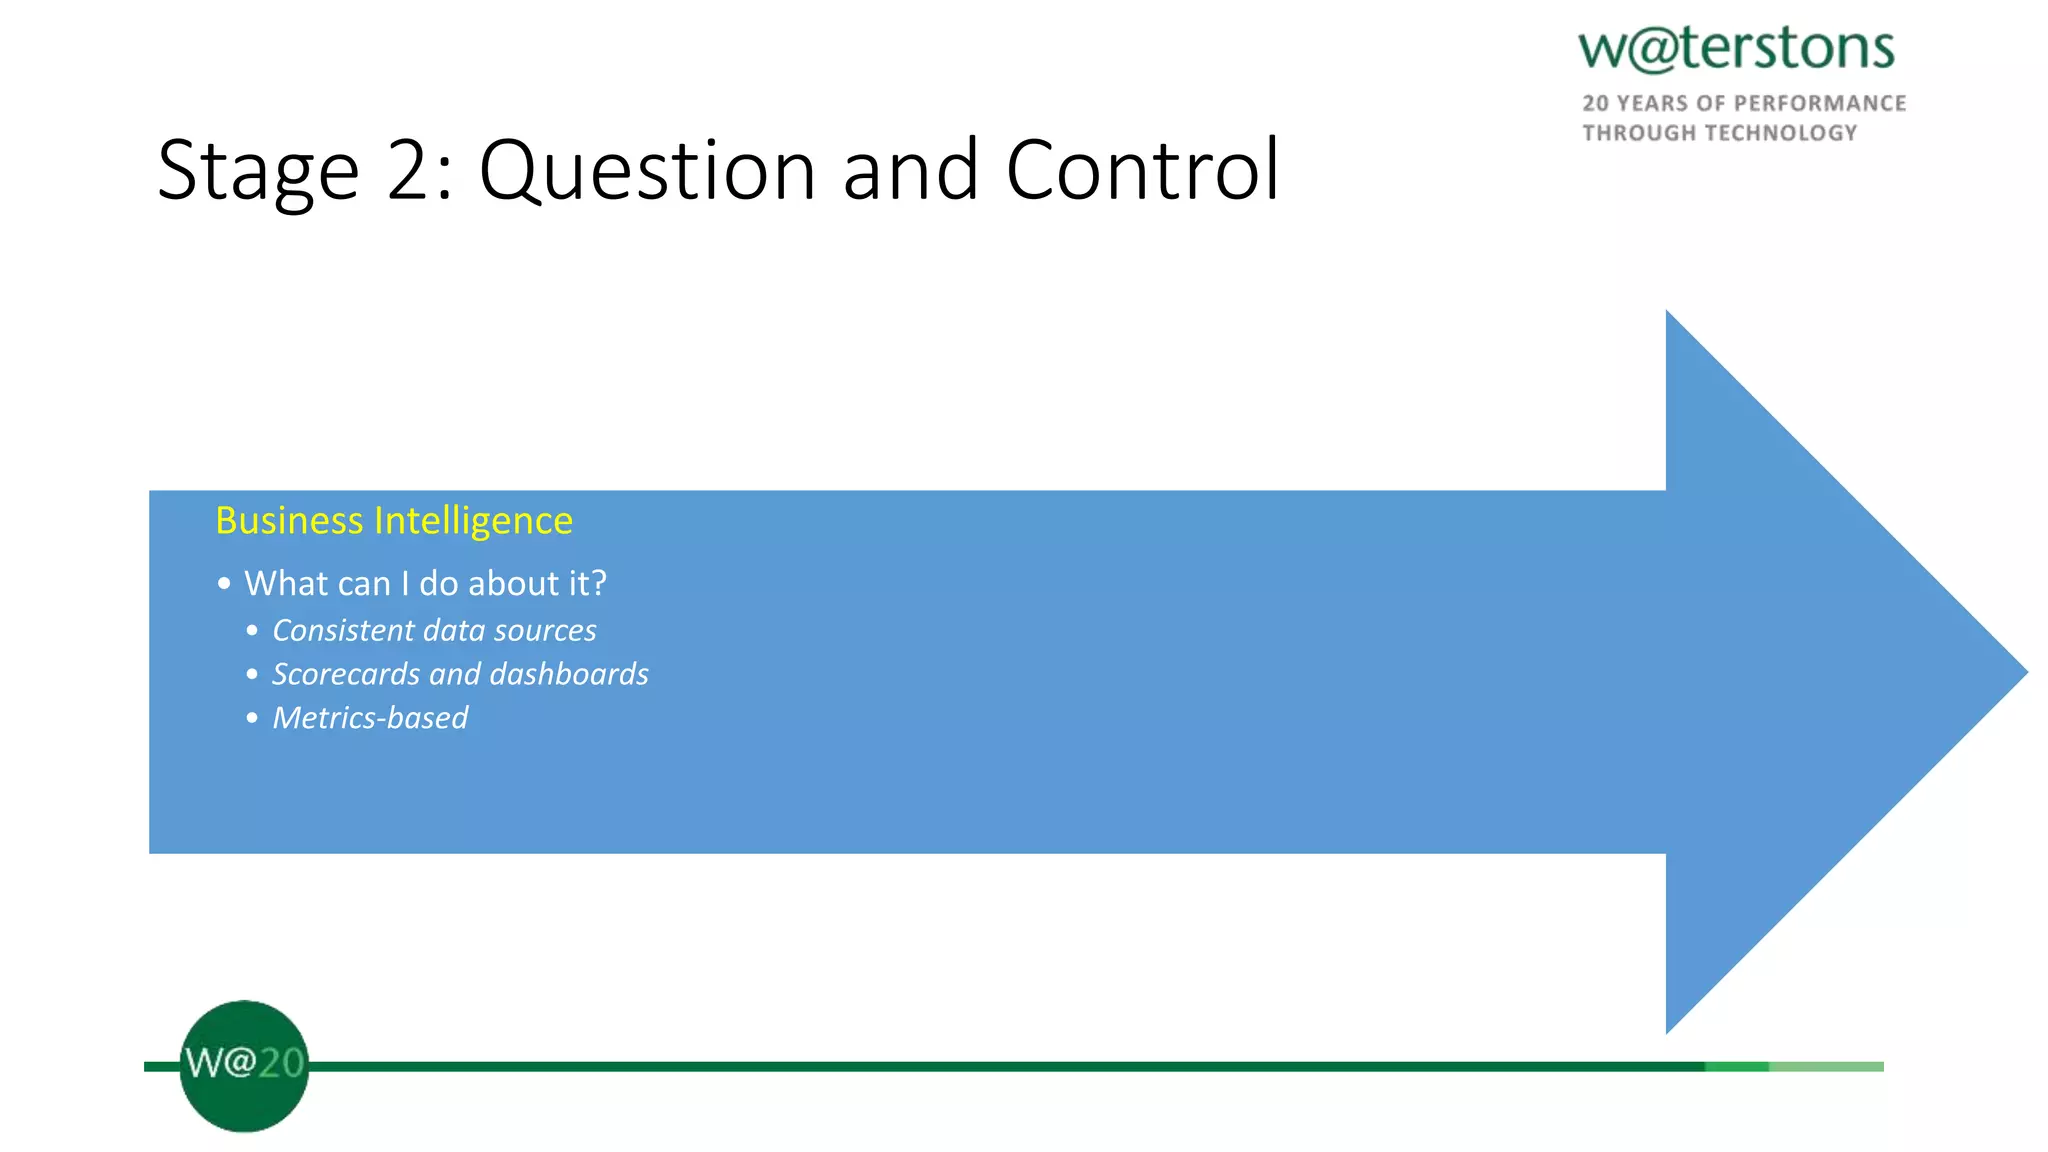
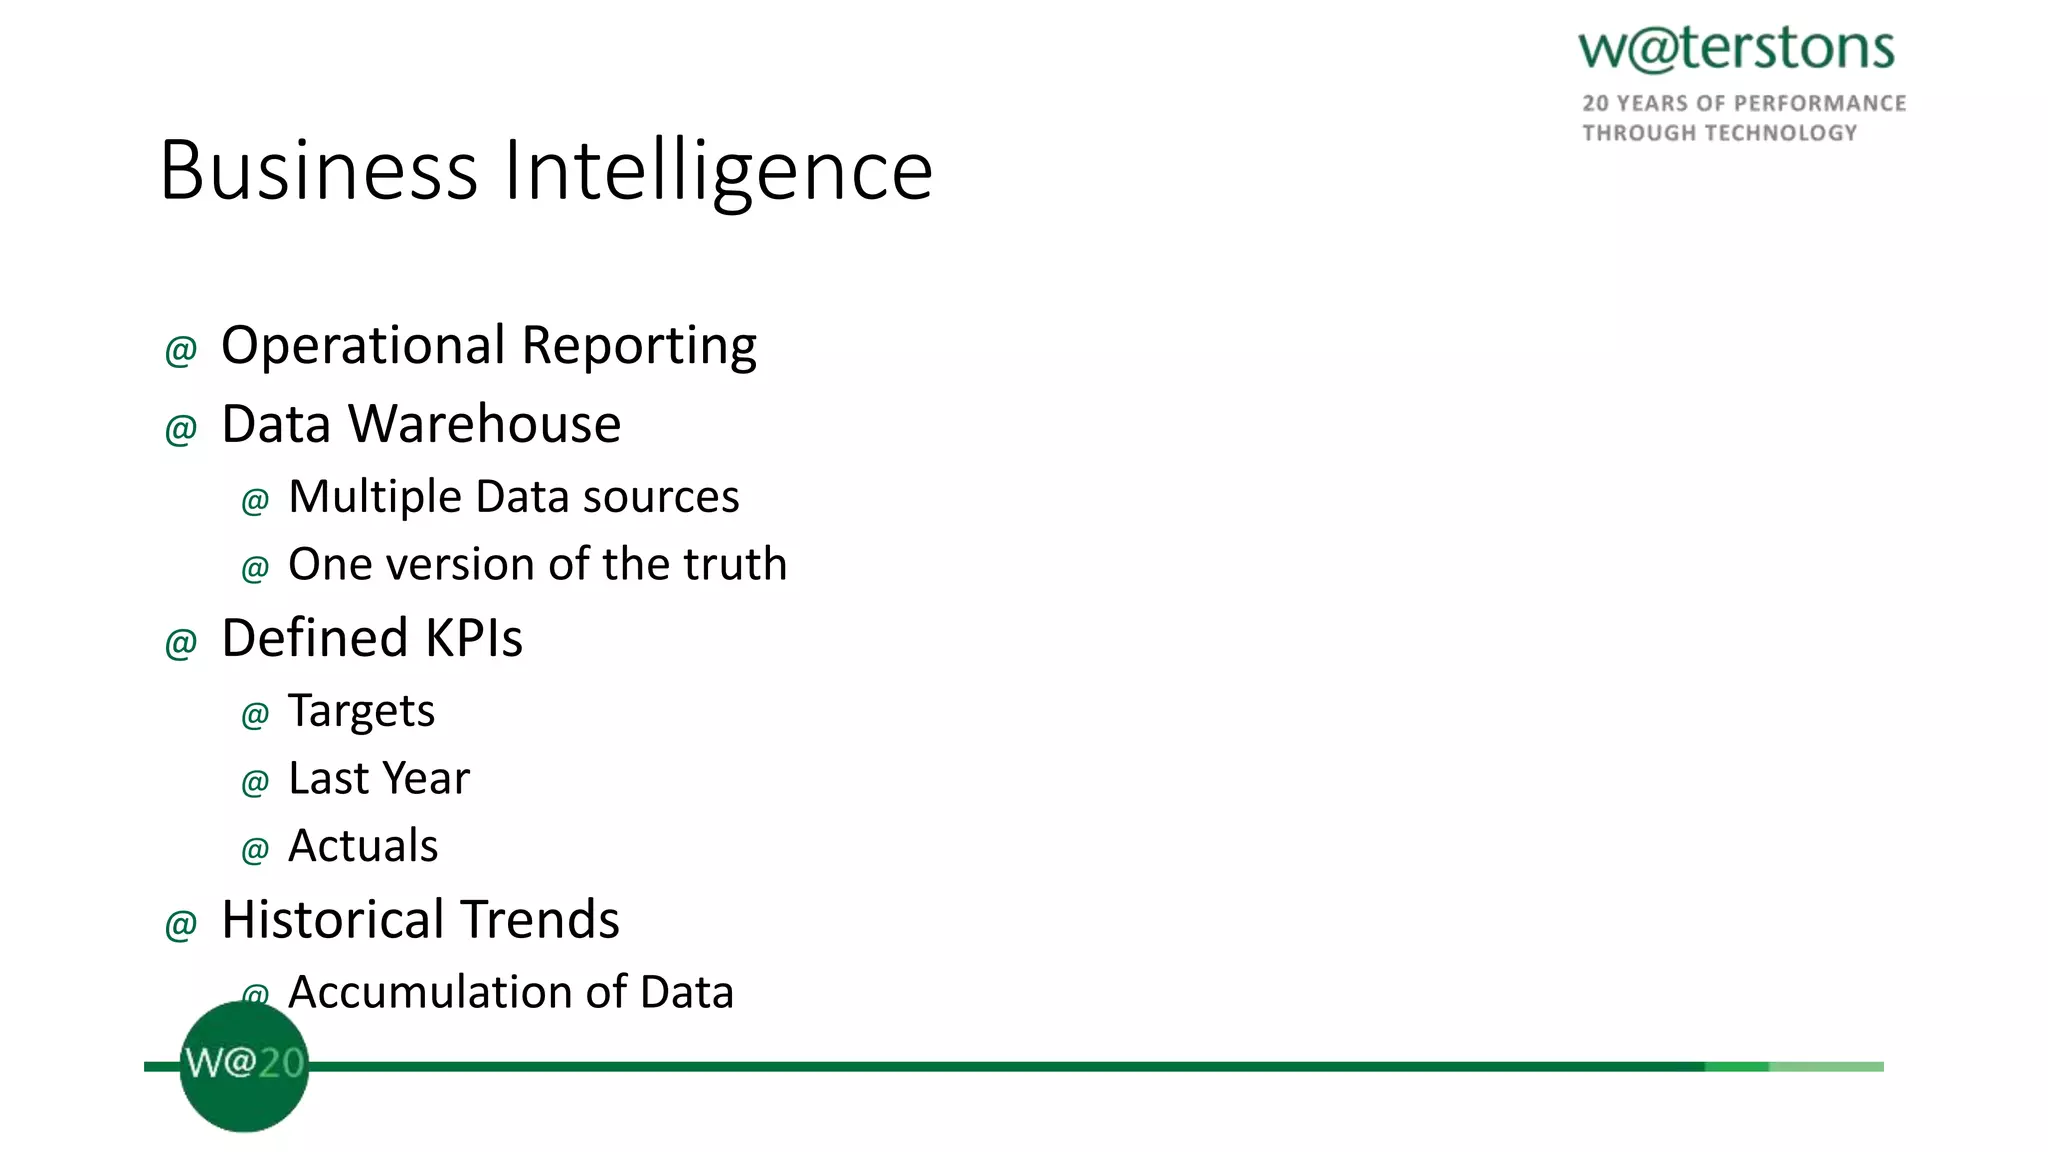
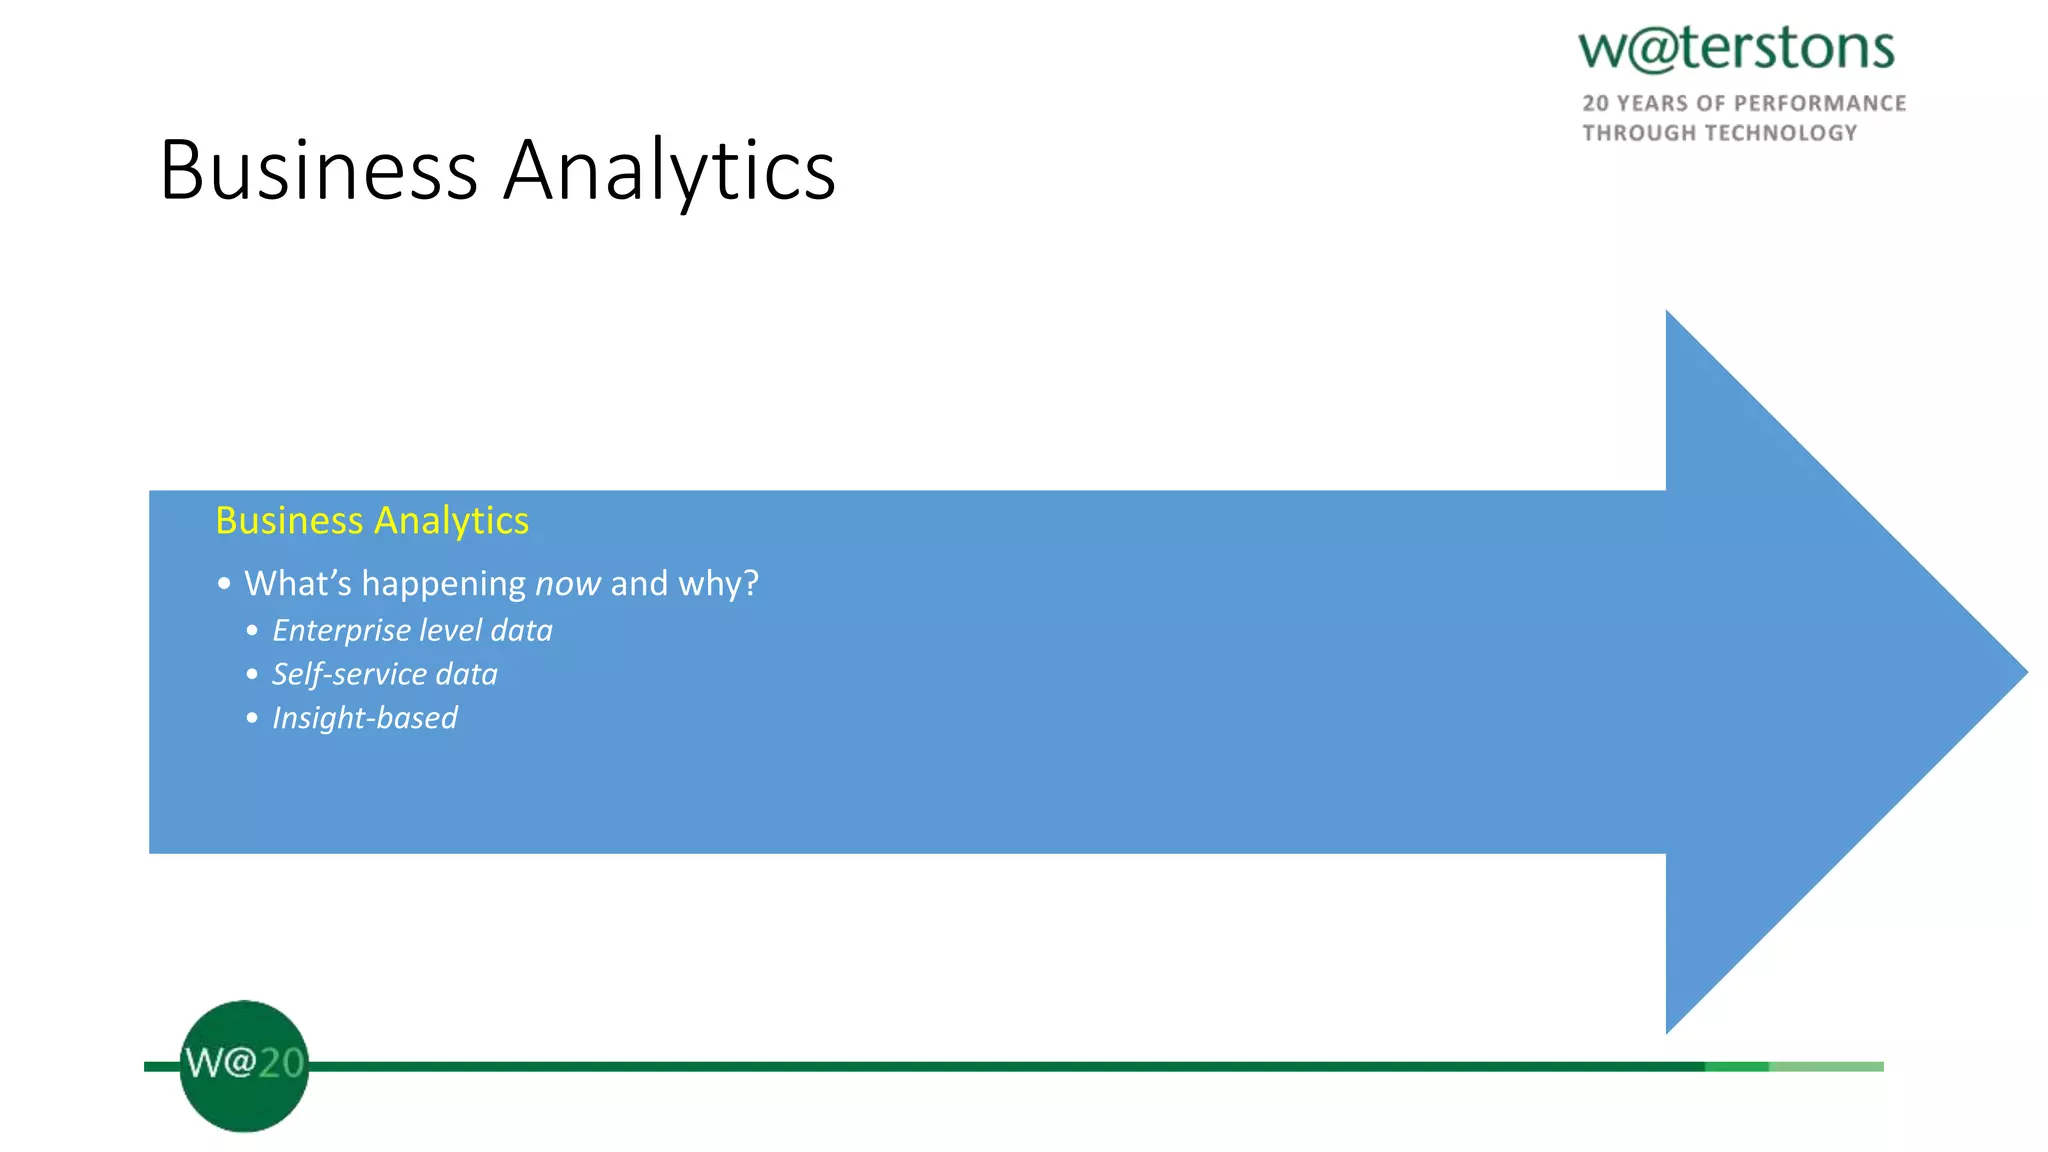
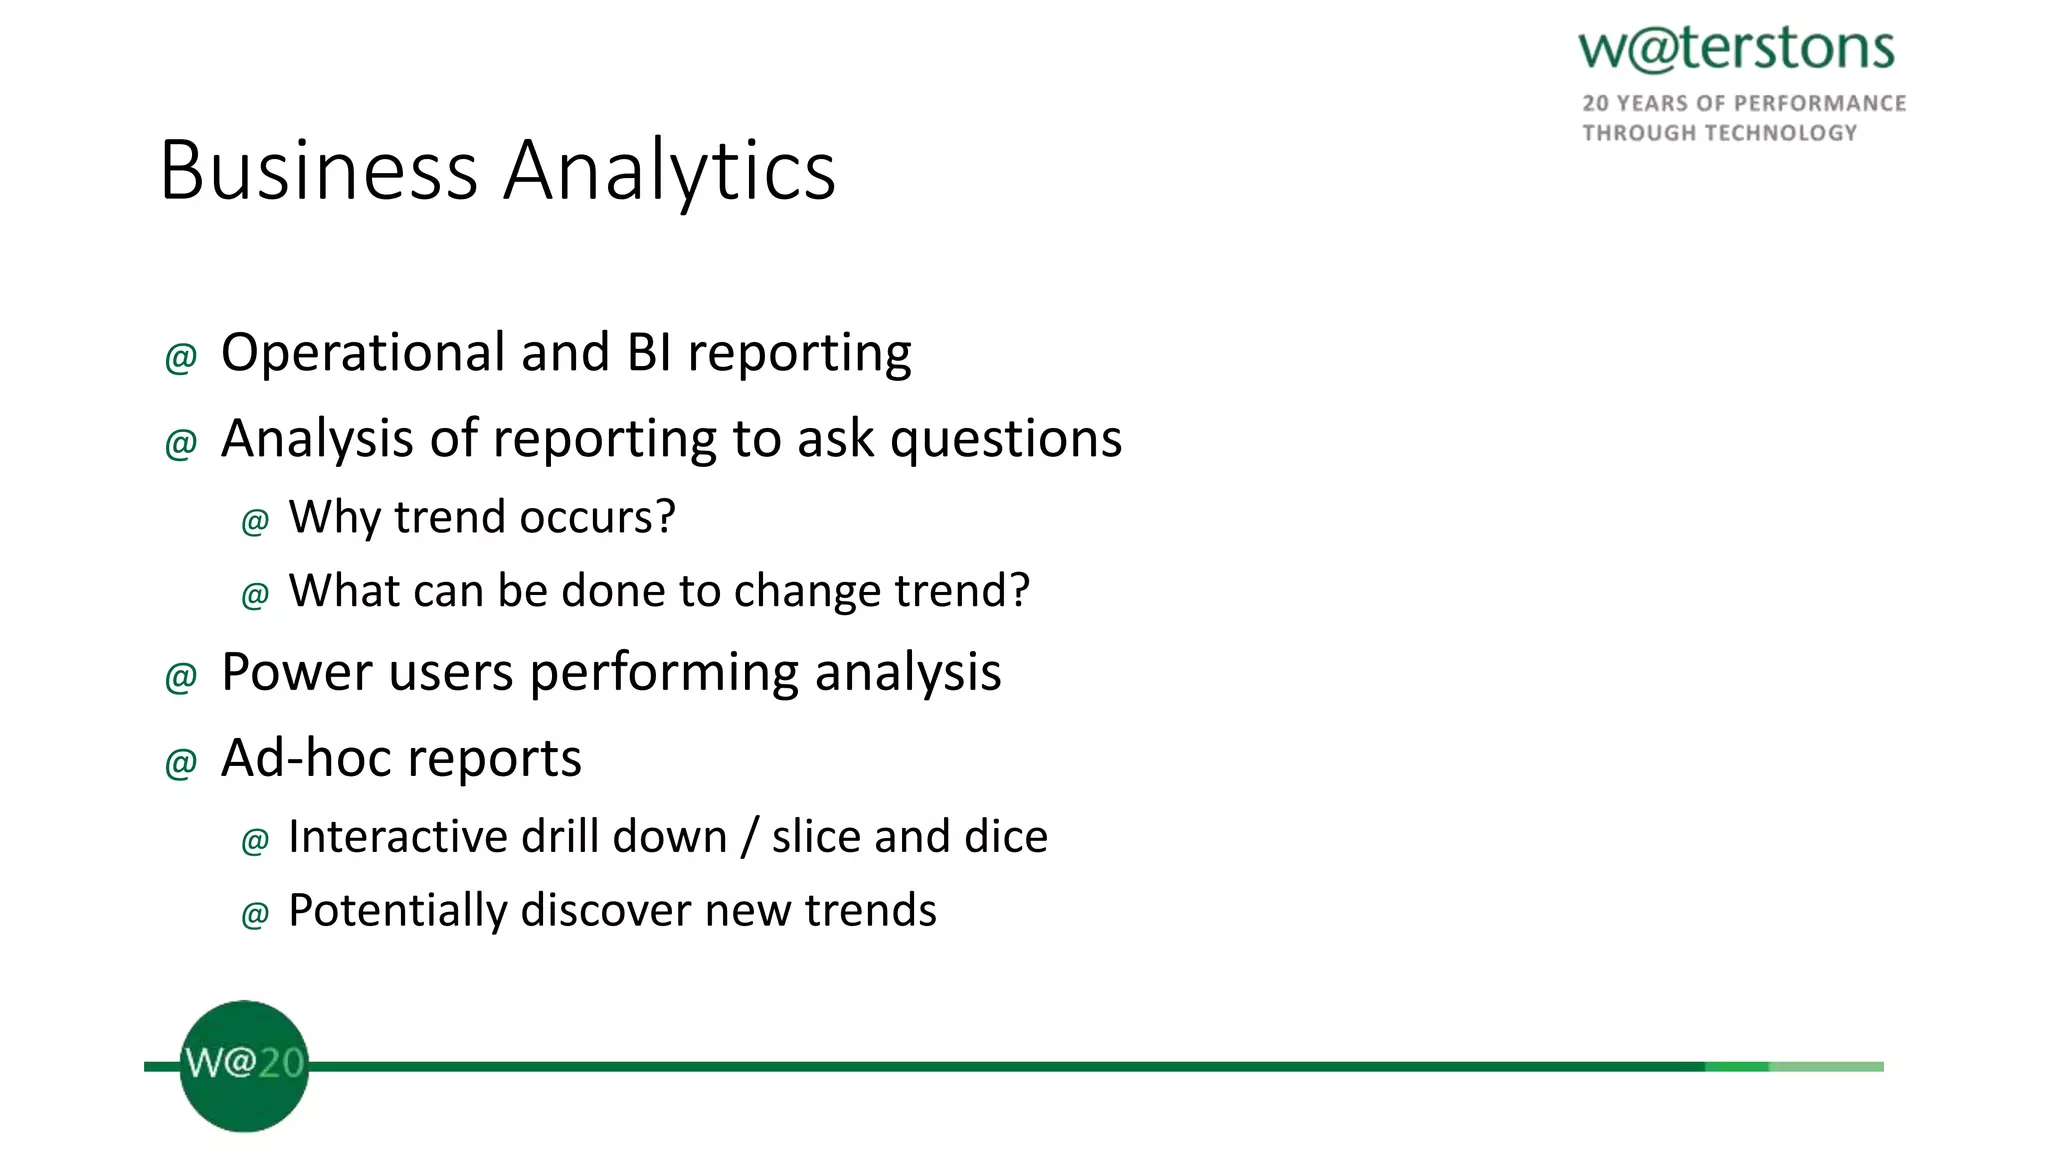
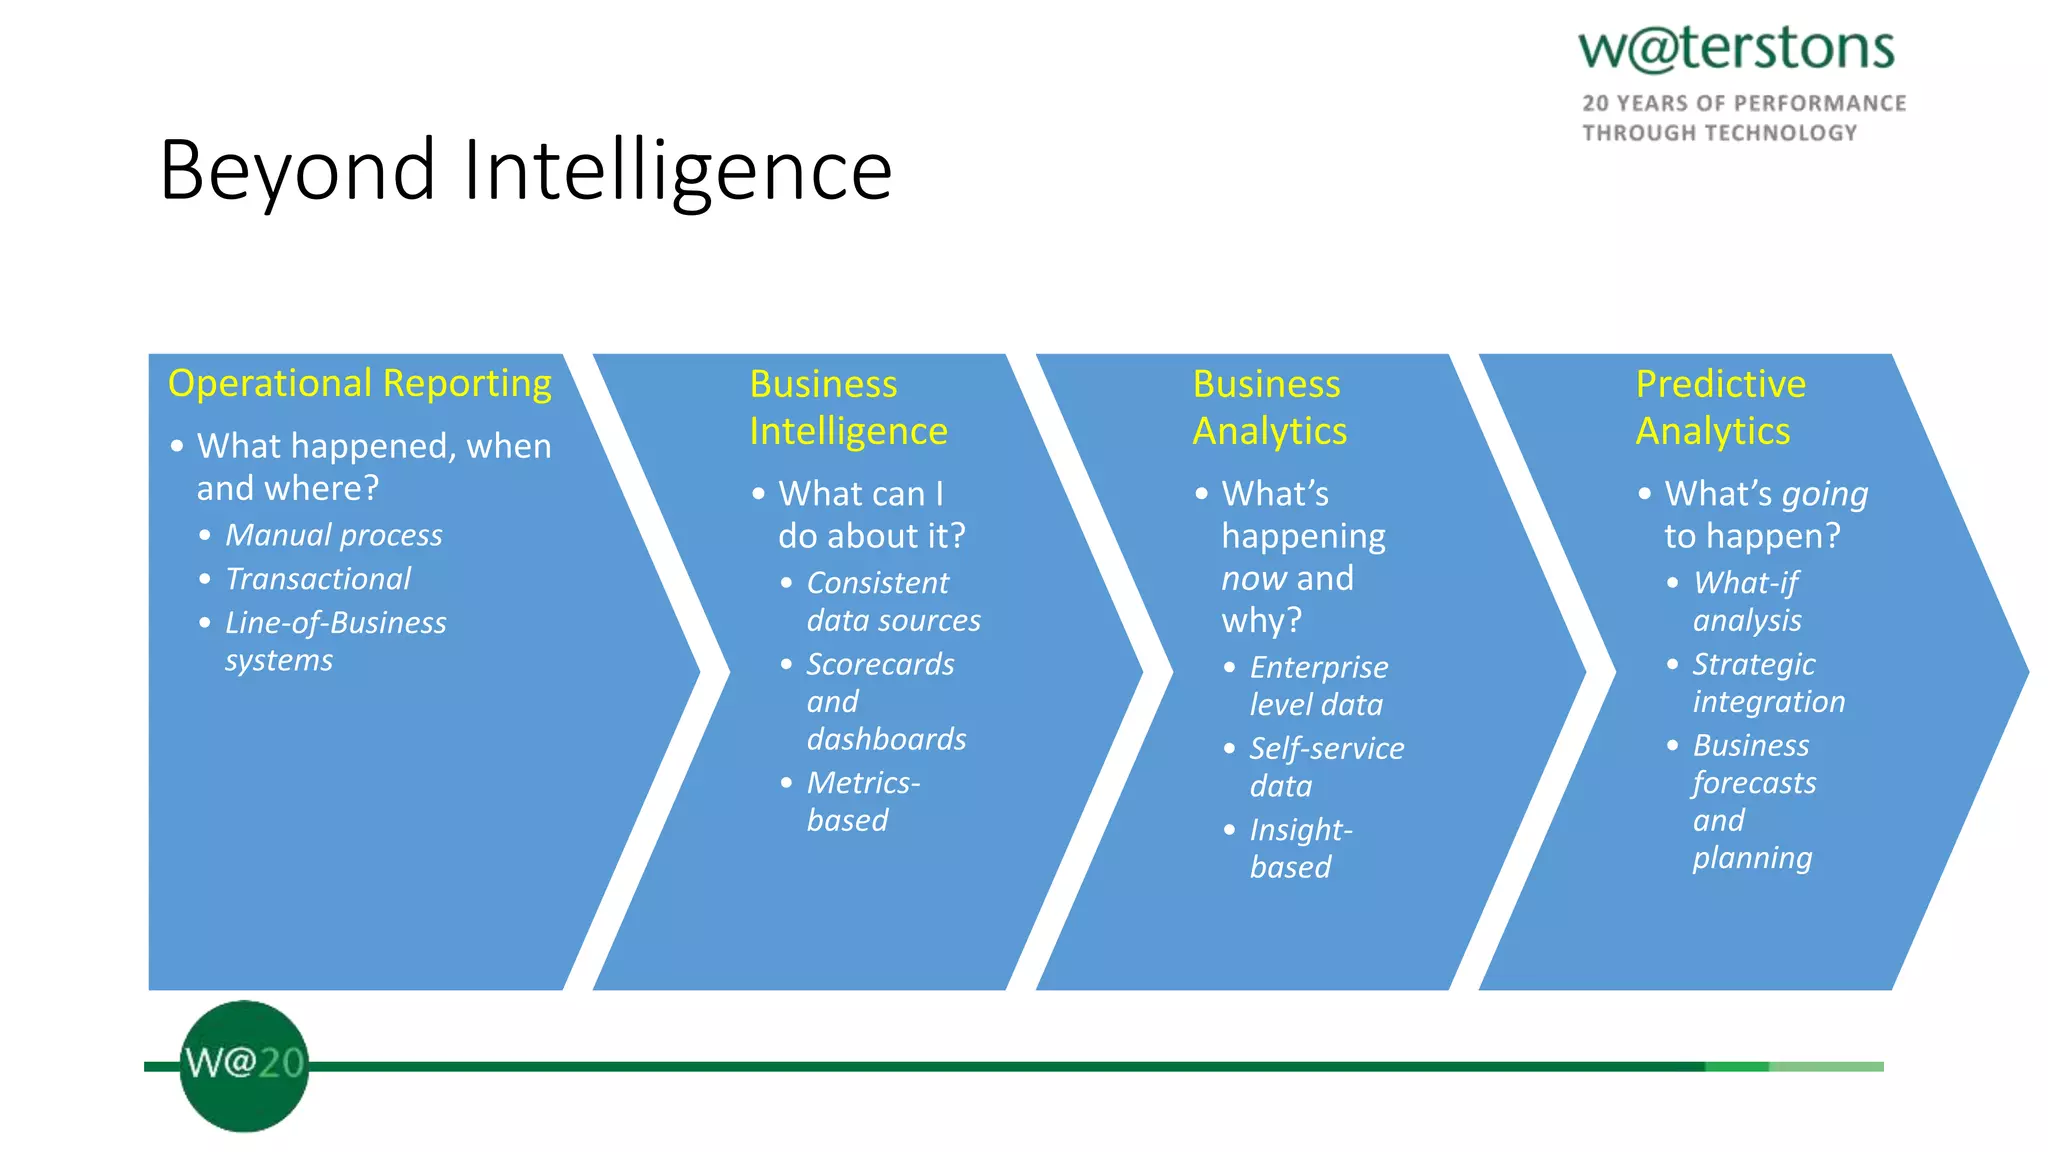
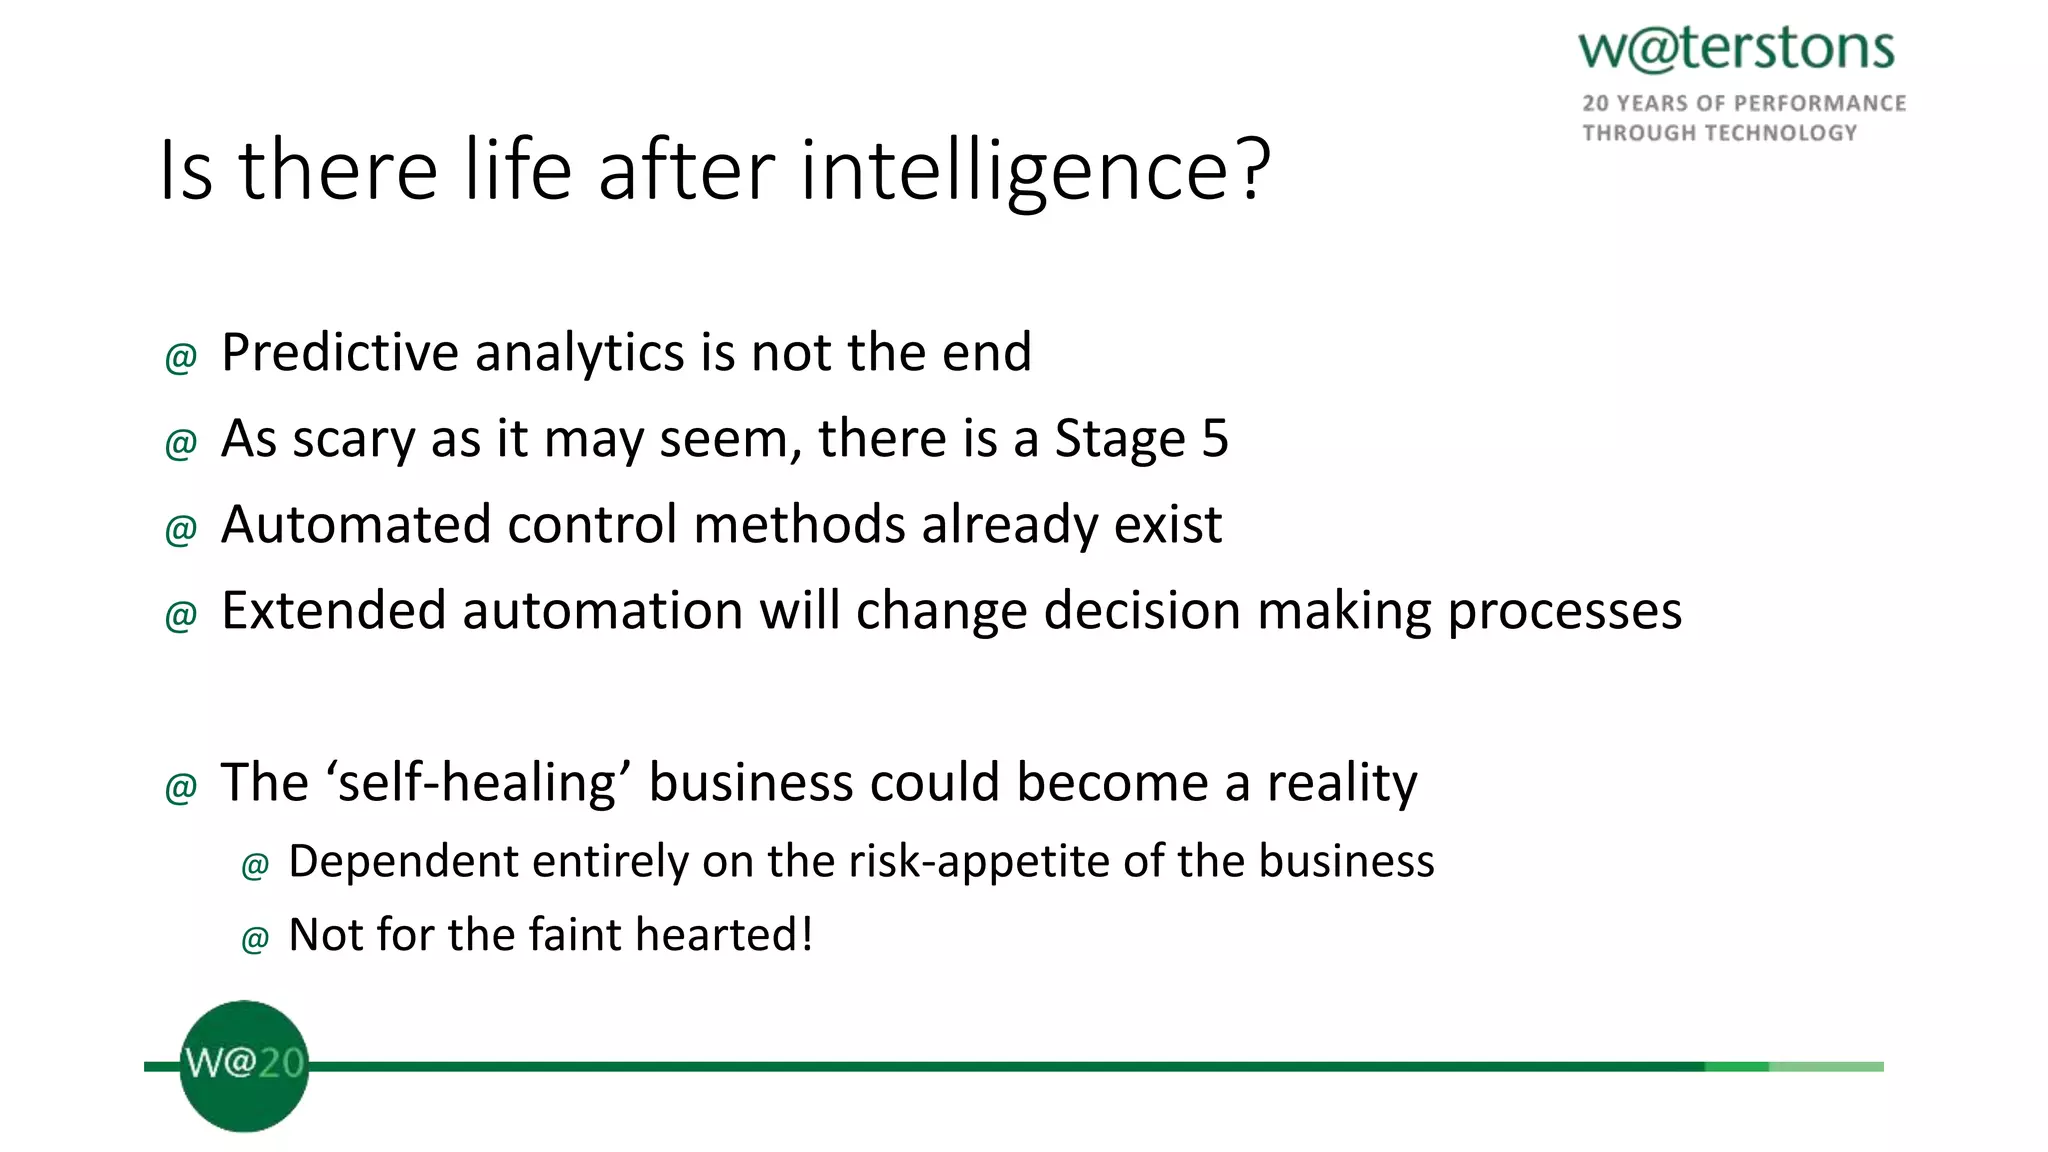

The document discusses Waterstons' roadmap for business intelligence (BI) and analytics, highlighting the importance of understanding and maximizing the value of business data. It outlines the evolution from operational reporting to advanced business analytics and predictive analytics, emphasizing iterative approaches that align with business needs. Additionally, the document touches on future trends like automation and the concept of a 'self-healing' business.


![Coded Agents – with UiPath SDK + LangGraph [Virtual Hands-on Workshop]](https://cdn.slidesharecdn.com/ss_thumbnails/codedagentsdeck-251215155422-5497c599-thumbnail.jpg?width=640&height=640&fit=bounds)


