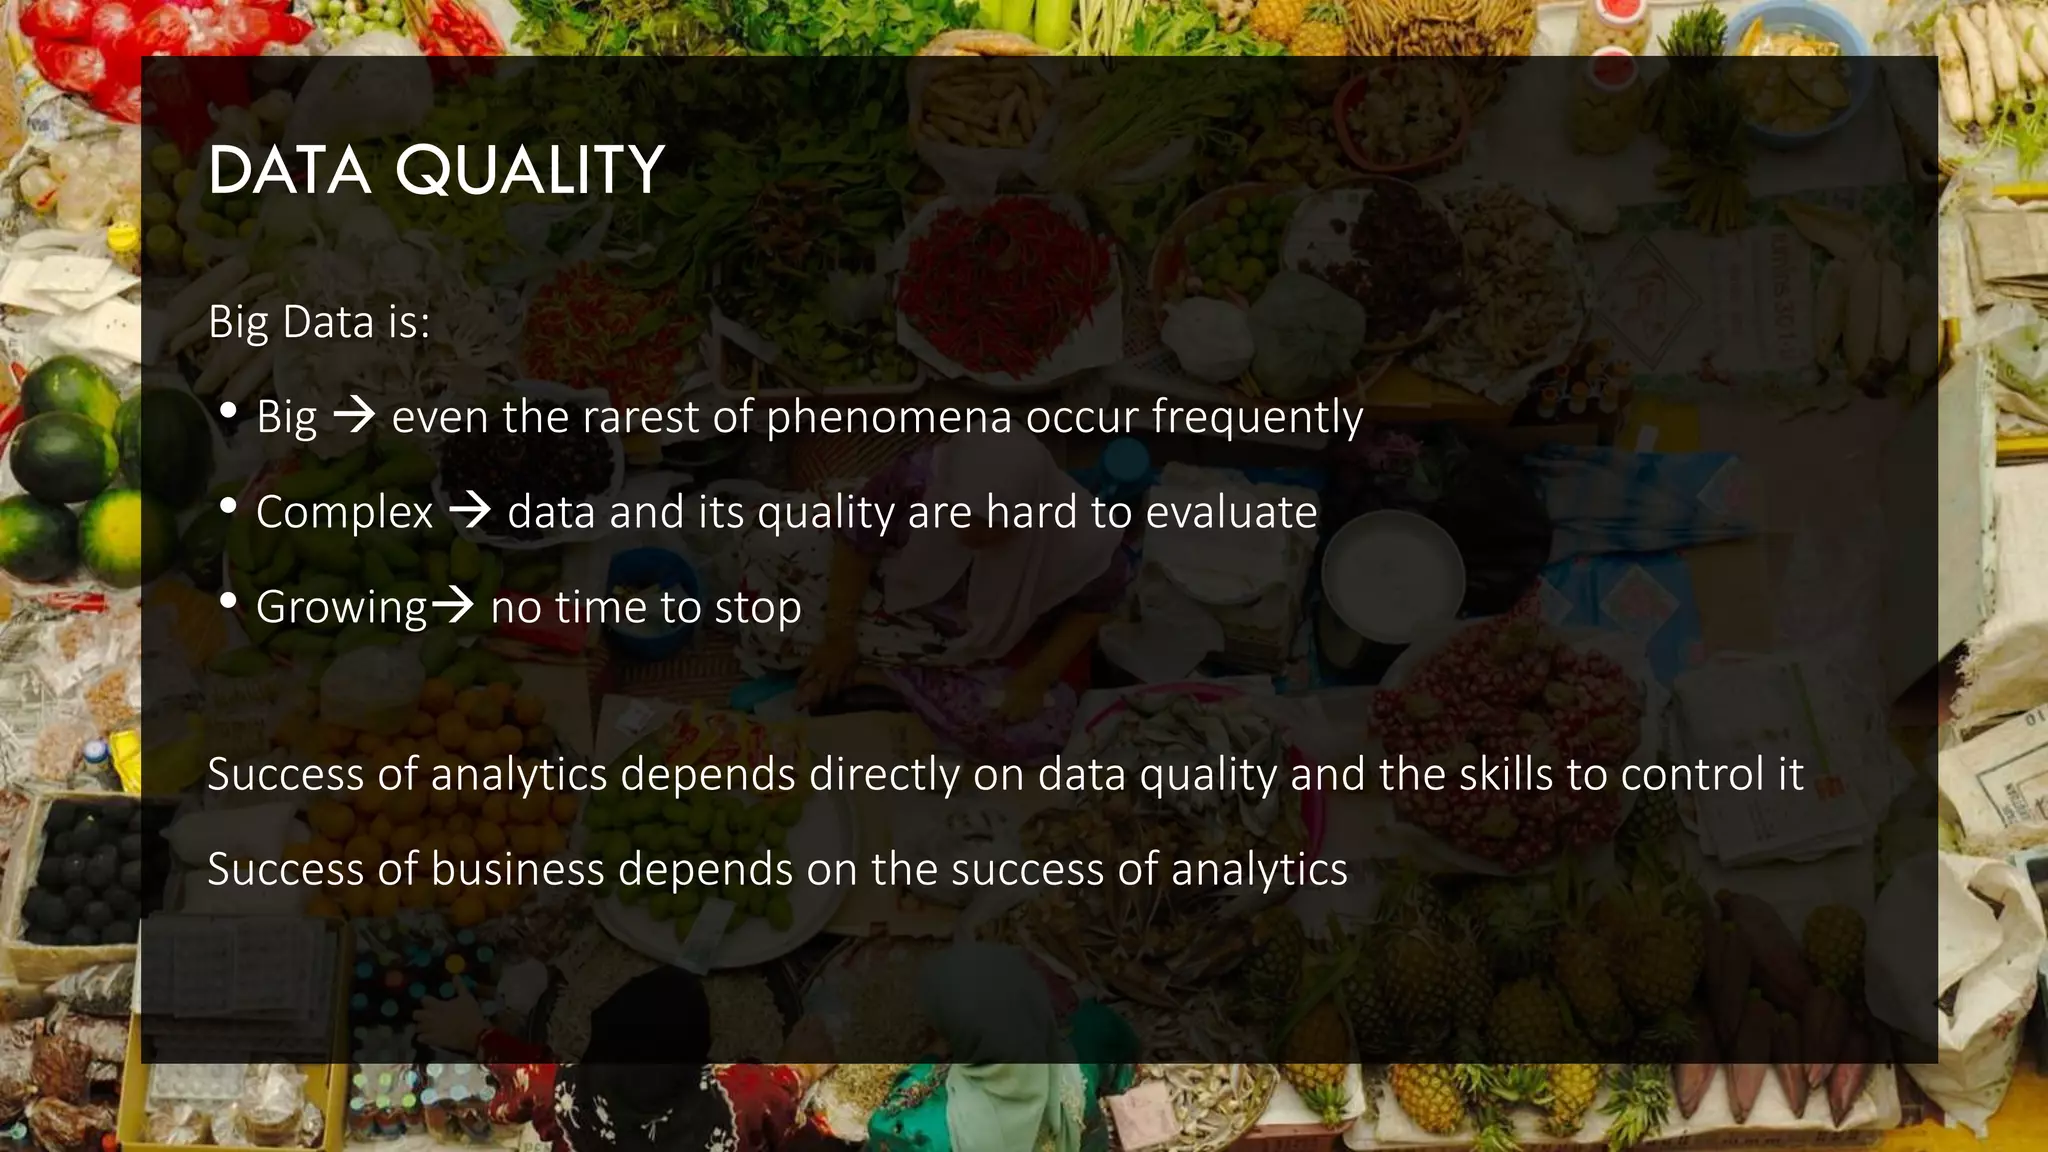
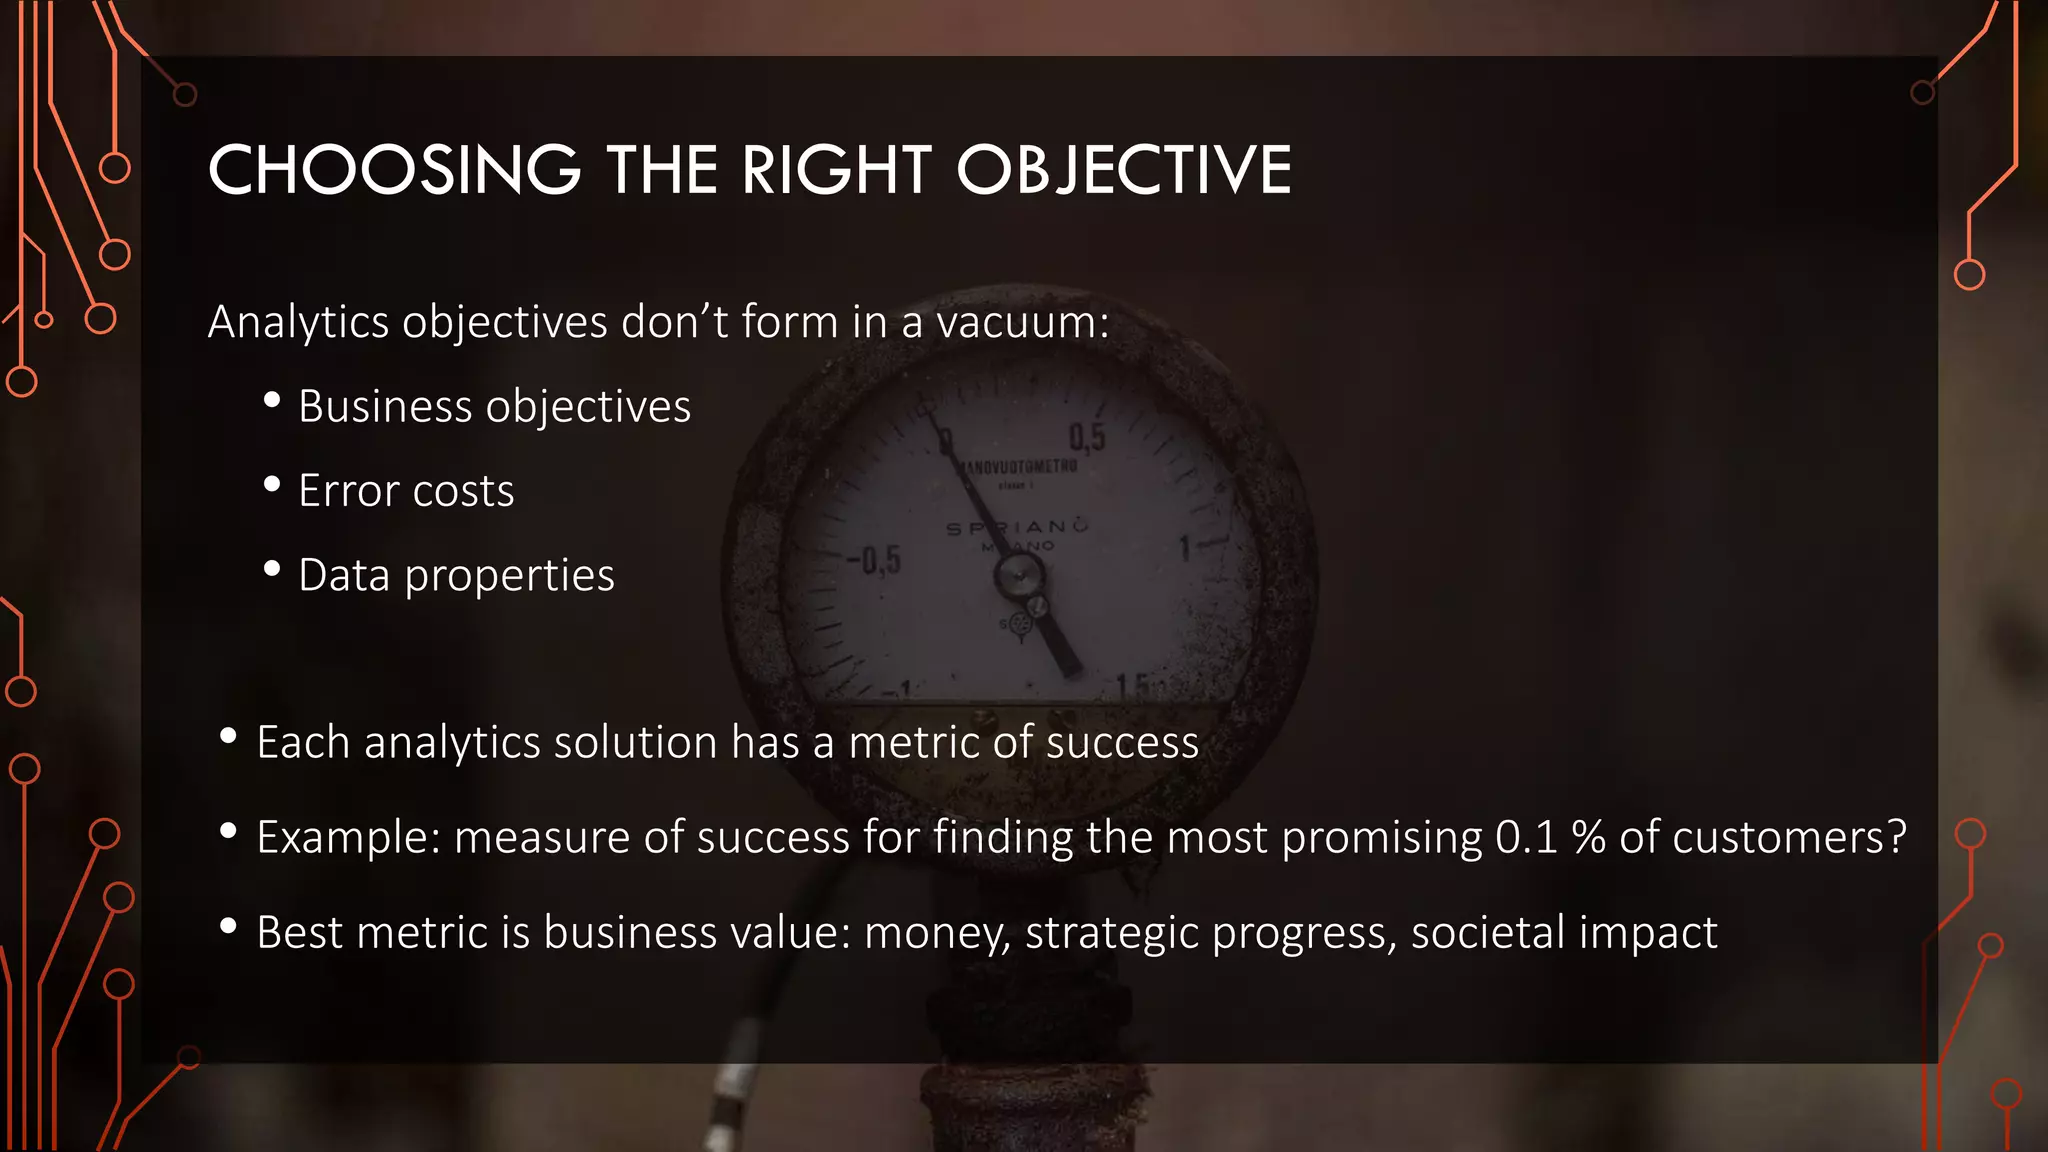
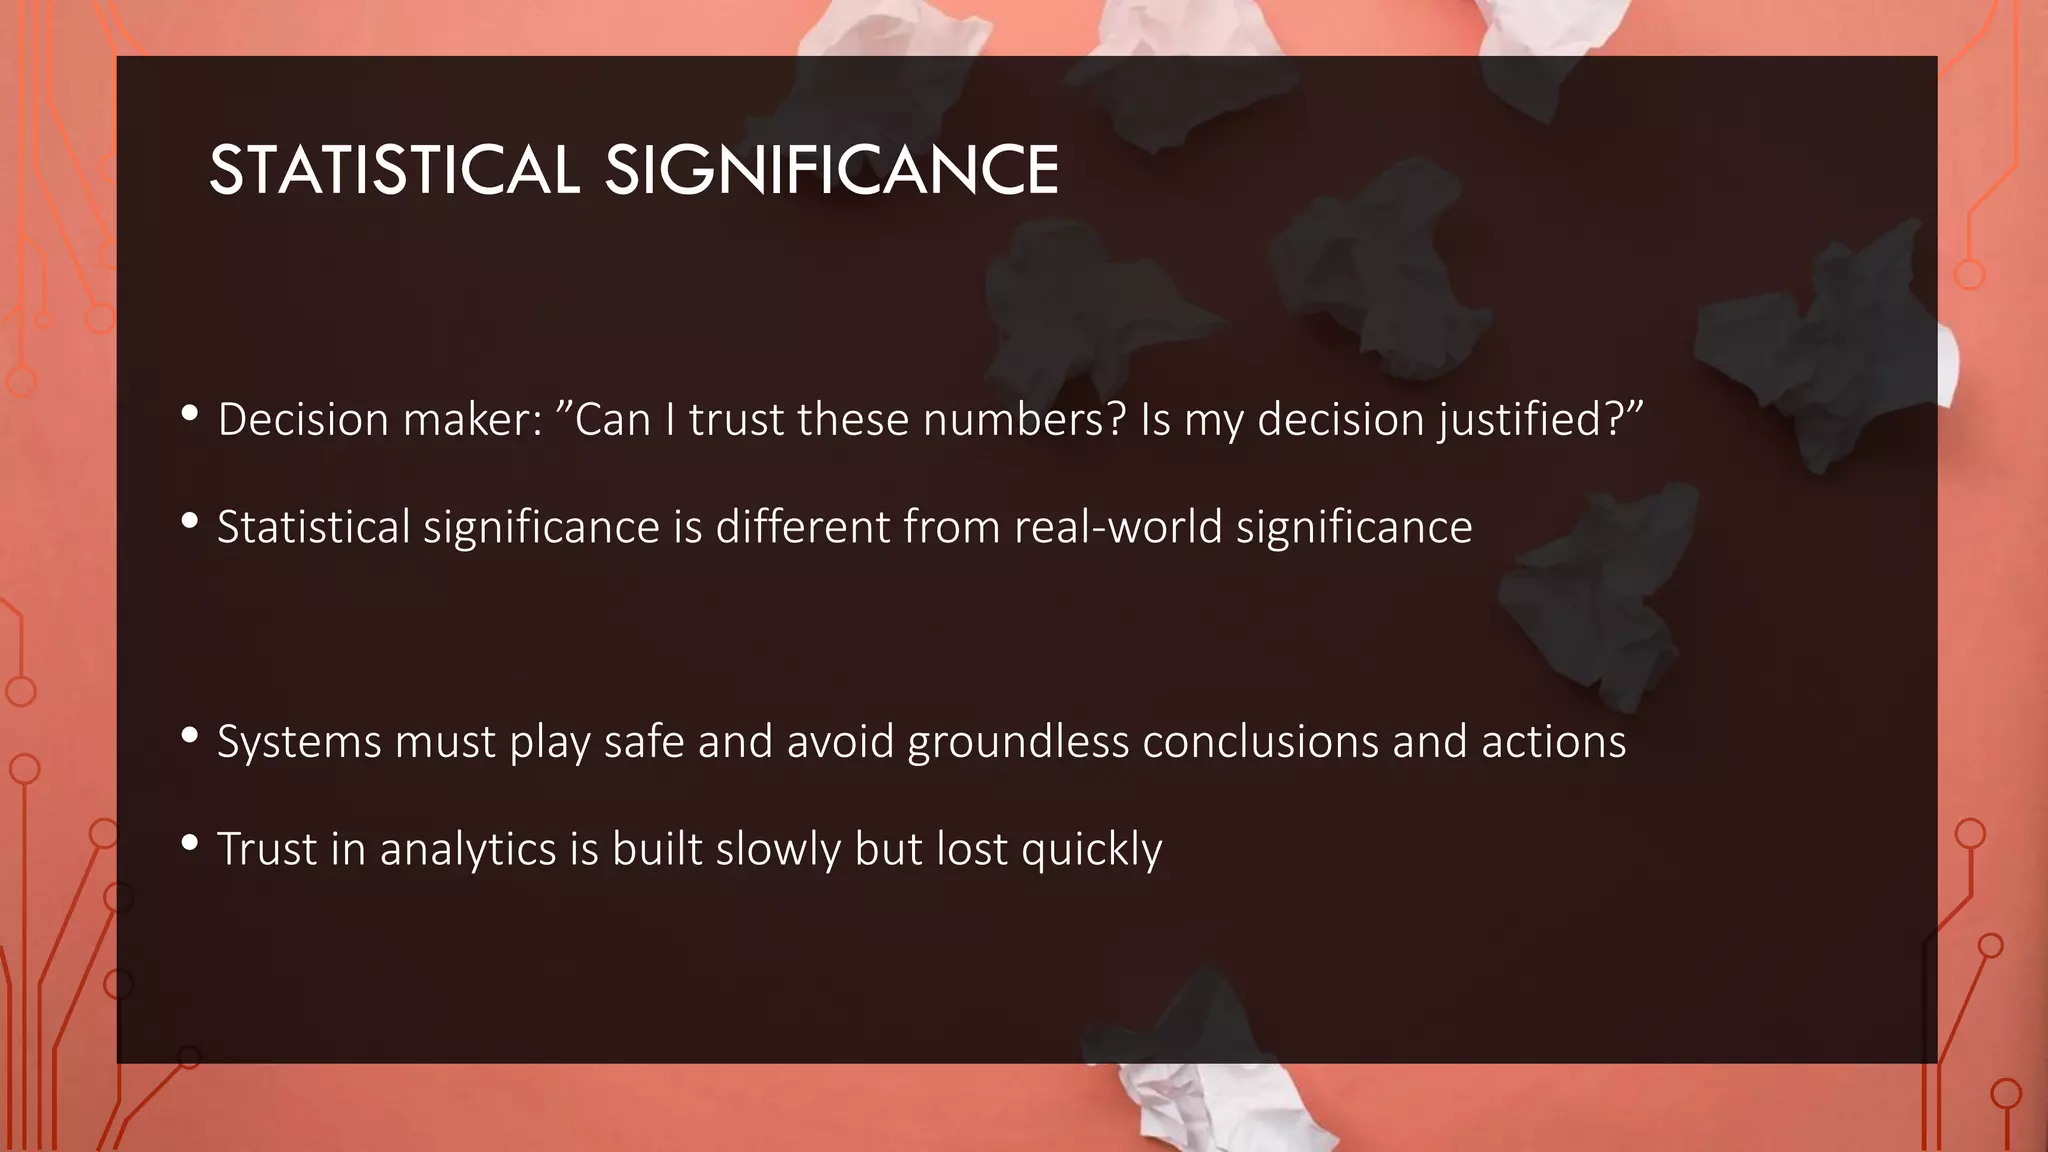
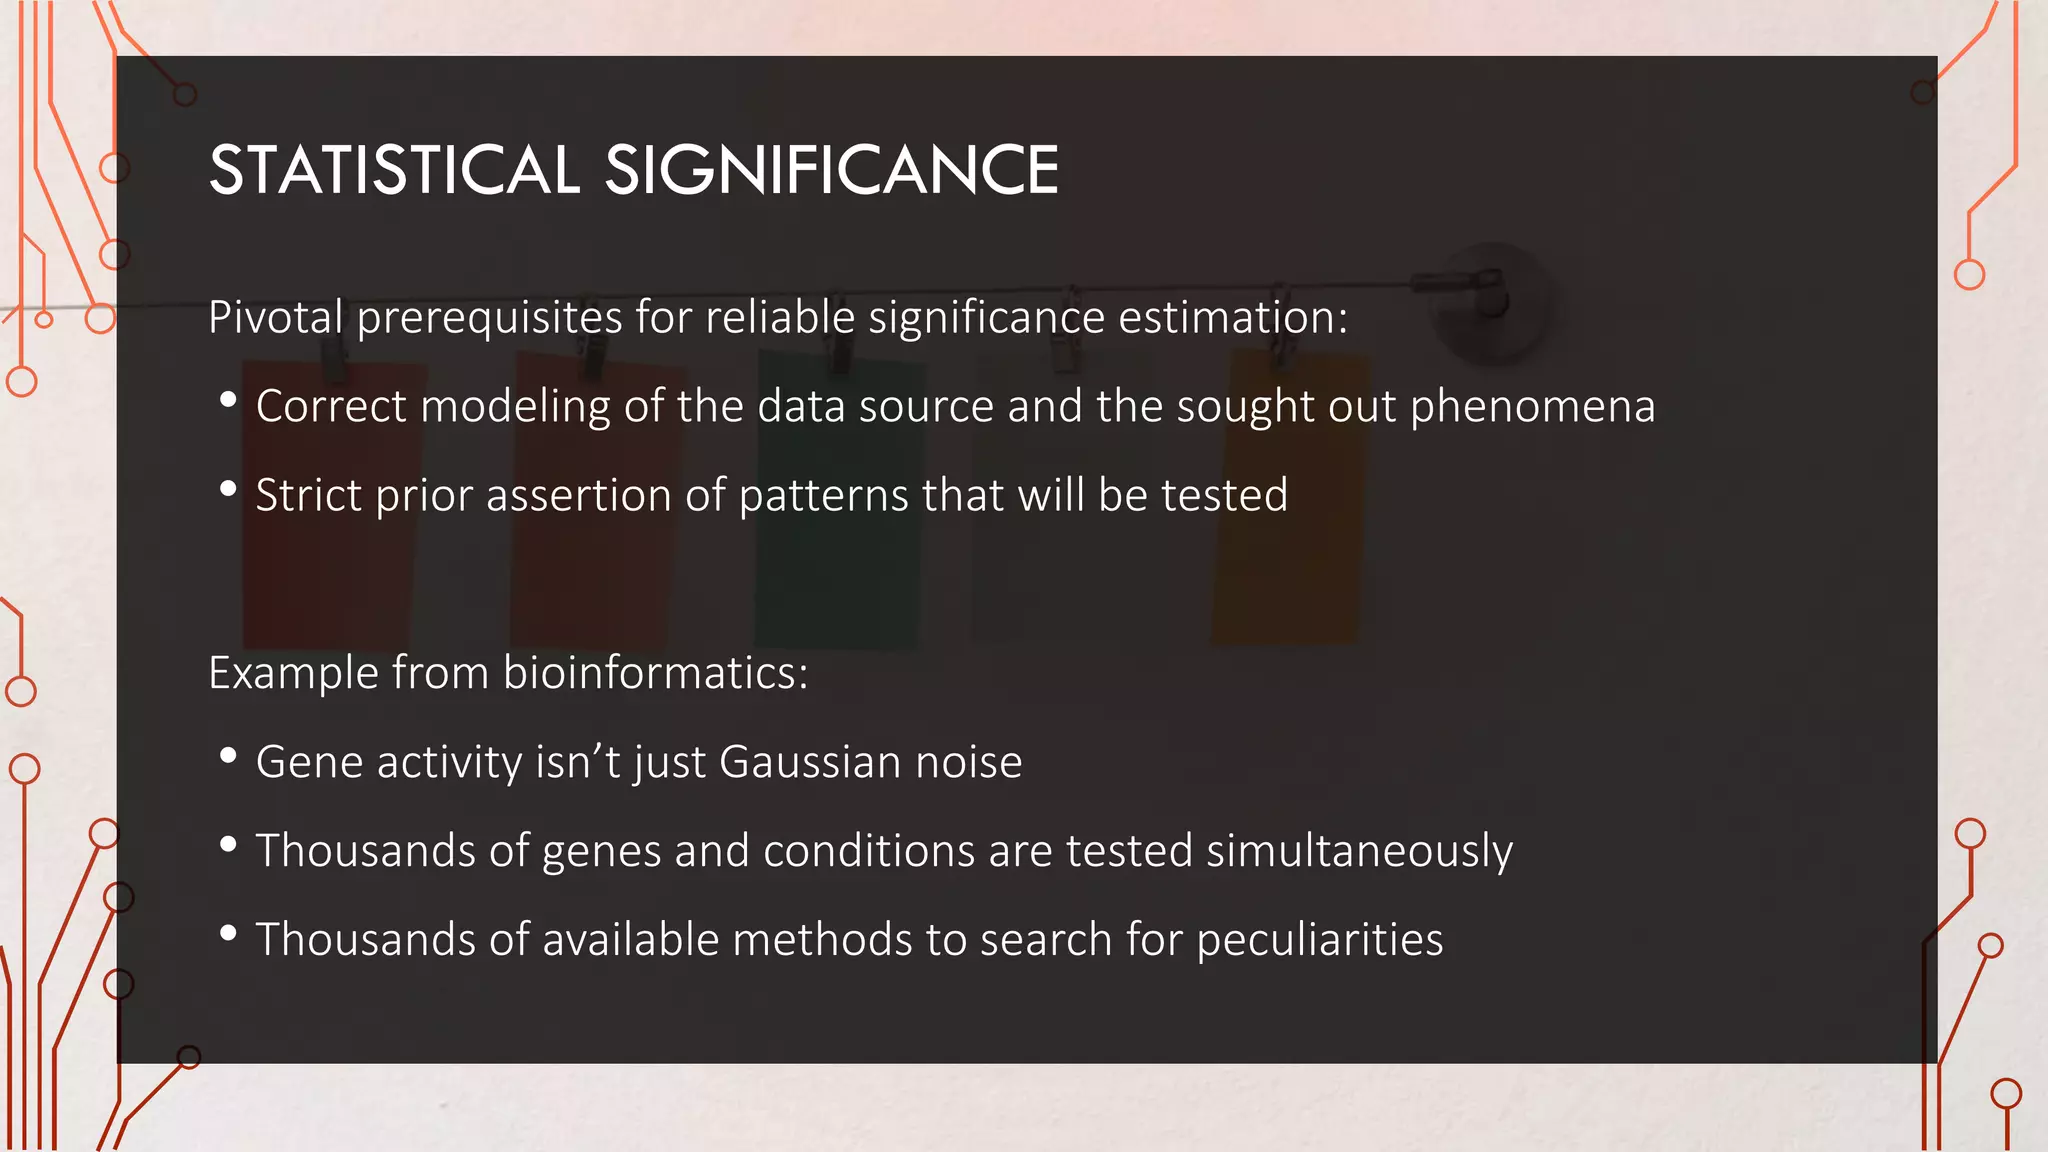
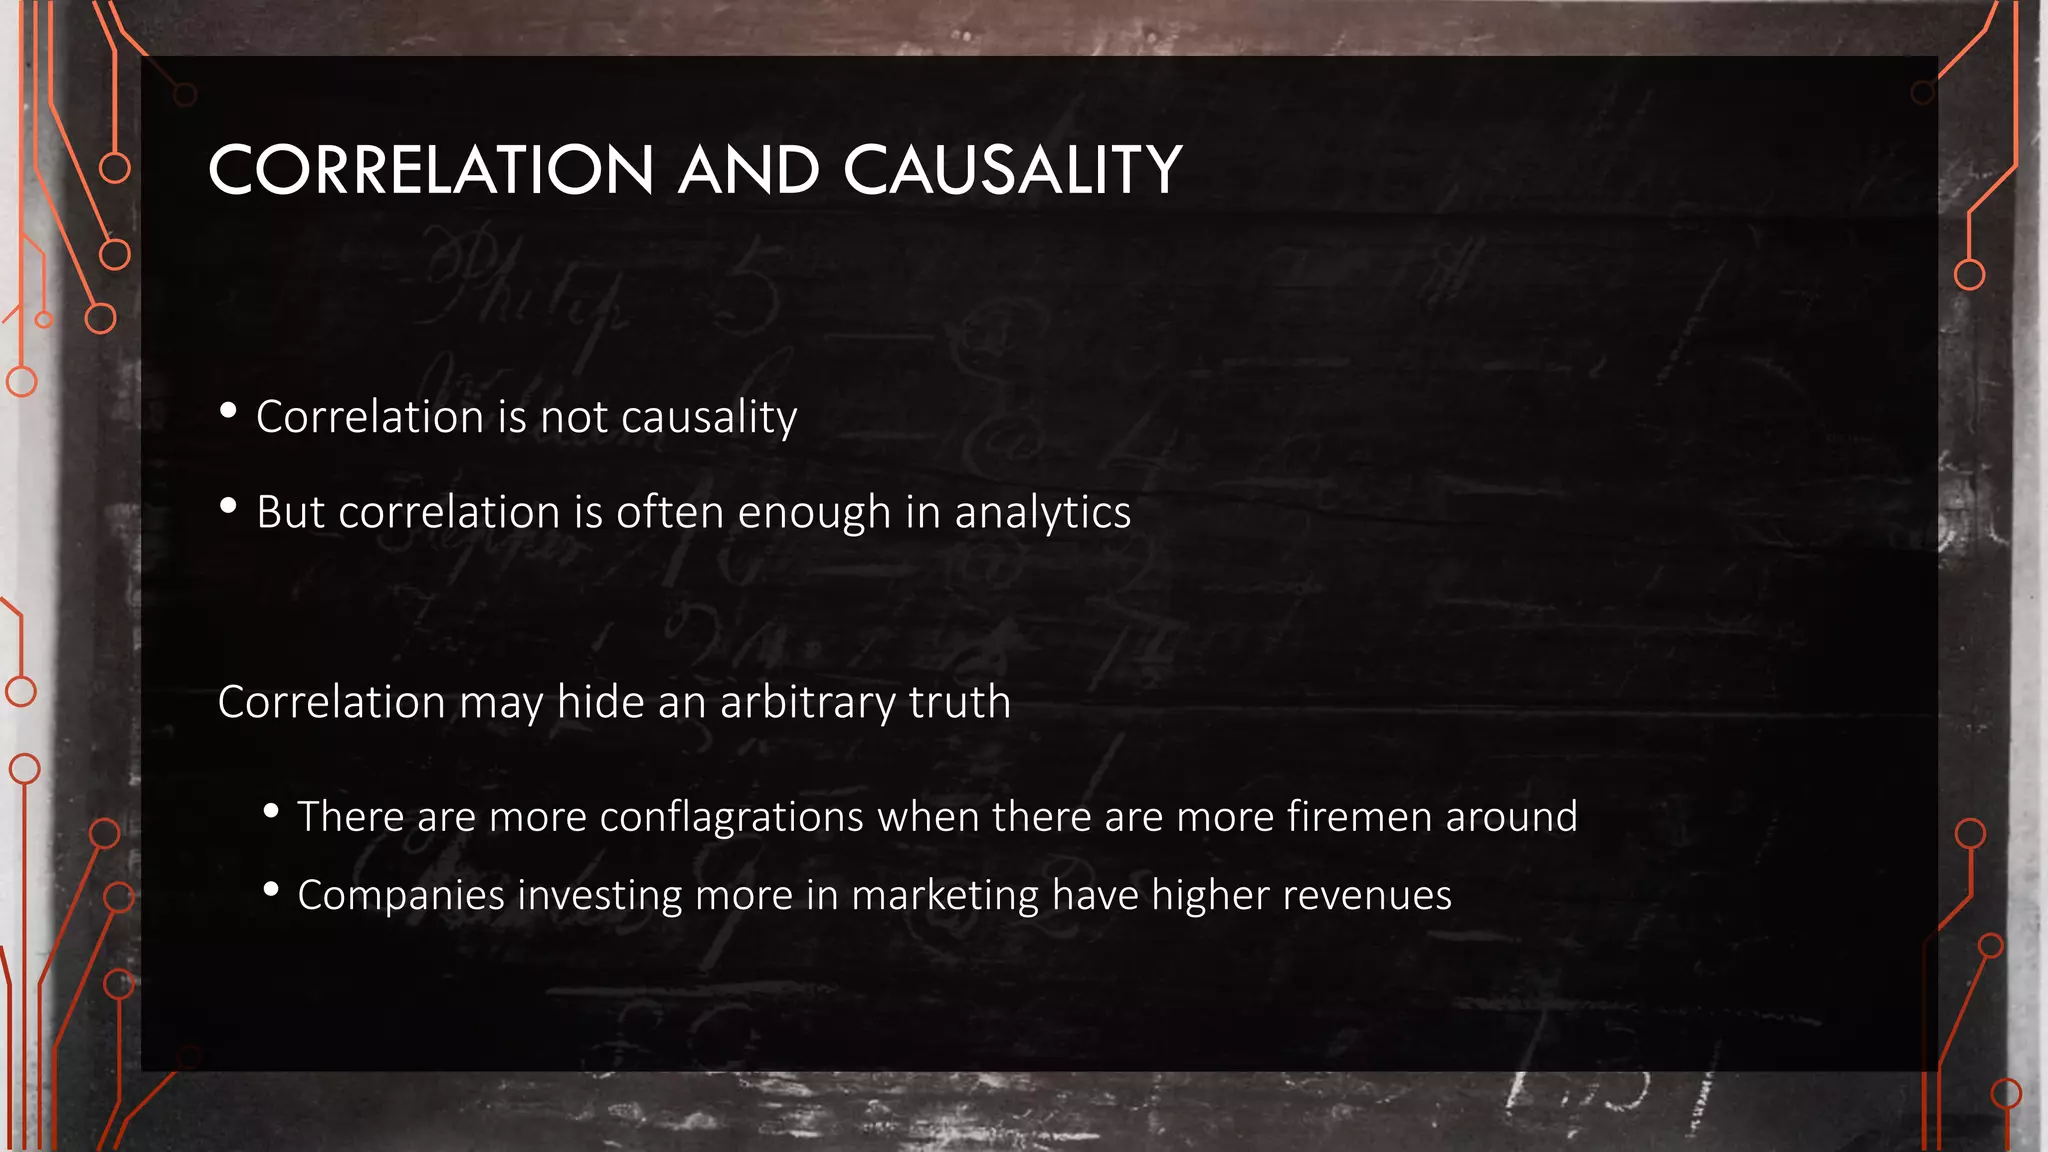
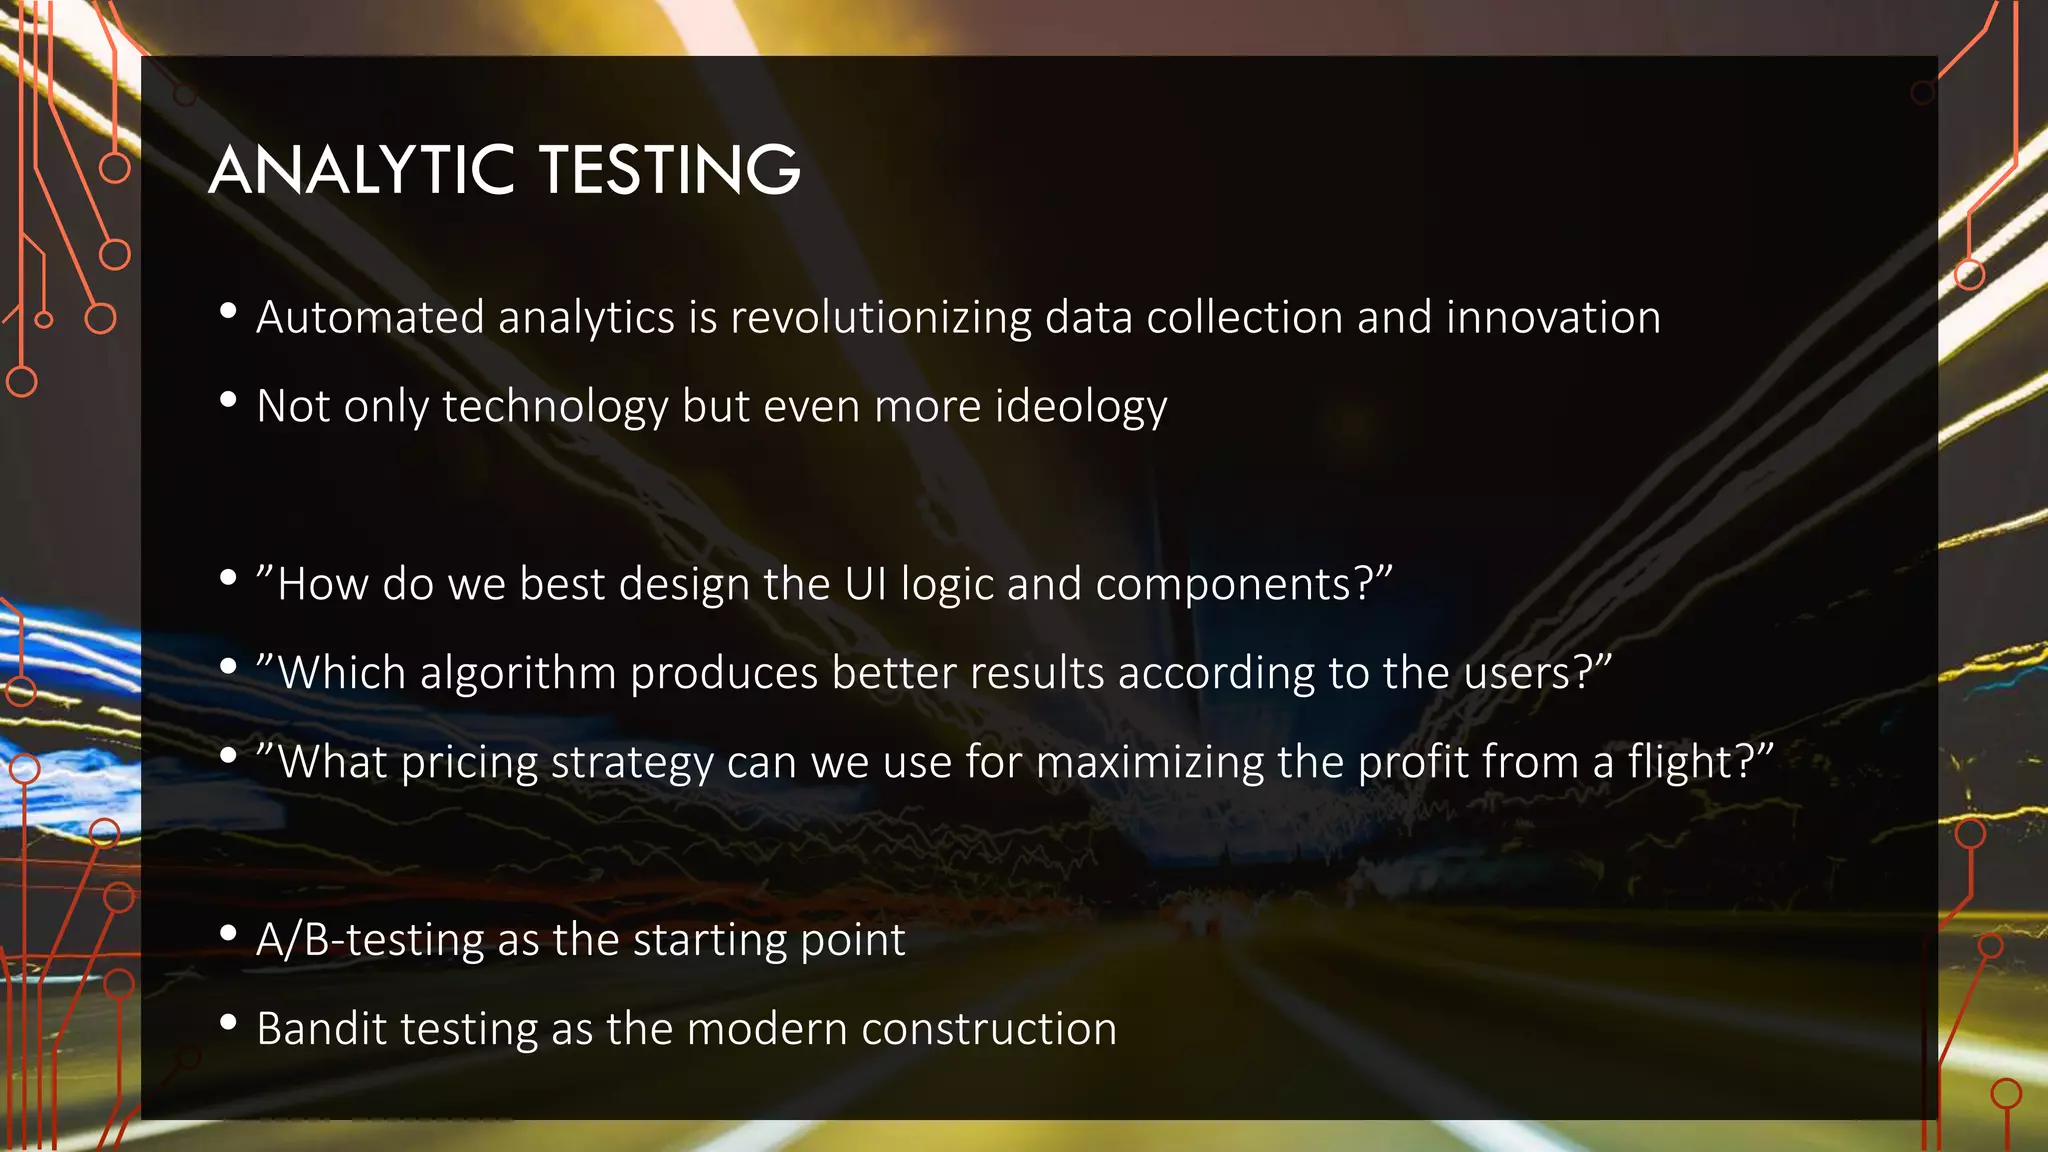
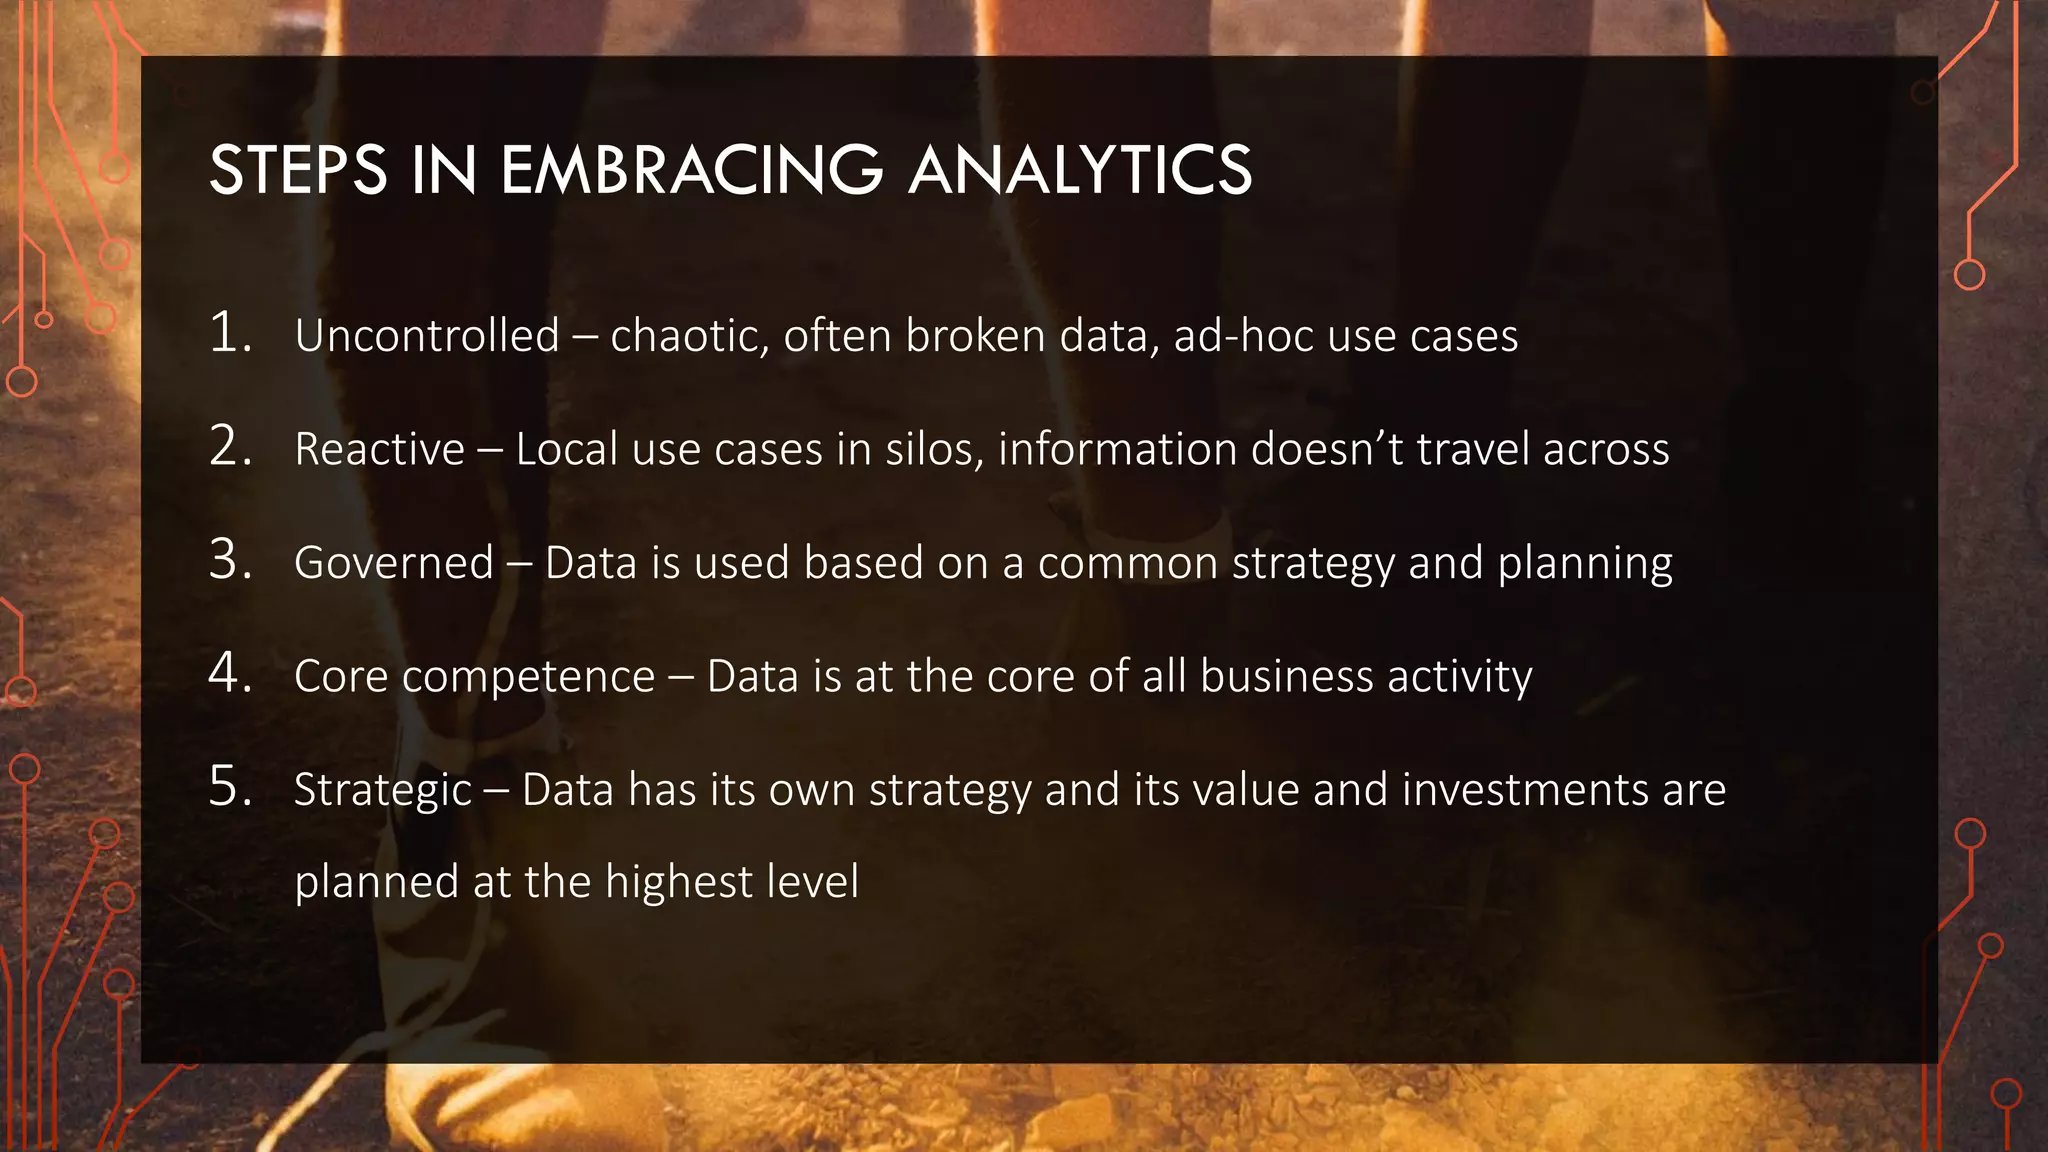
Material for the 26 Oct 2015 lecture I held for Aalto University business students. The lecture focuses on the high level topics in analytics and Big Data that are either central to the subject or just highly visible in the media.
The main messages of the lecture are:
- The purpose of analytics and of the data analyst is to solve business problems
- Big Data brings over some very special traits to doing analytics that don't exist when working working with smaller datasets. Understanding these traits is a must for successful analytics.
- Deploying analytics is more dependent on humans than on technology
- Data and analytics are nowadays significant assets to many companies. Therefore they need their own strategy and need to be managed just like any other business critical assets.
3. WHAT IS ANALYTICS?
Analytics are the eyes of the business
• ”Show me where I’m stepping”
• ”Help me decide where I want to go”
• Analytics is the core of digitalization
”Software is eating the world” – this has just begun…
4. WHERE DO ANALYTICS WORK?
Every department:
• From factory to logistics
• From marketing to HR
Every industry:
• From professional sports to medical research
• From mobile games to earthquake tracking
• From retail shelves to crime investigation
5. EXAMPLE: FREEMIUM GAME ANALYTICS
”We’re offering this in-app purchase to you at this time, at this price, at this location, at
this game situation with this wording and animation in this area of the screen”
”Why?”, you ask
”Well since there was a 23-year-old German-speaking Pokemon-hobbyist MIT student
playing another game at the same spot you’re right now. She identifies herself as
Canadian, went to Spain last month, checks the game’s friend rankings quite often,
spending an average of 2.3 seconds for that and uses Facebook particularly on Saturdays.
She’s also a quick typist, but keeps repeating a certain grammar mistake. That’s why.”
6. WHAT IS BIG DATA?
Big and complex
• Modern technology allows sifting very weak signals from very large data
• Big Data is essential for the most valuable analytics
• There’s a big shortage of experts to create and handle all the analytics that
we could and would want to deploy
• This mismatch explains the Big Data hype and its quick rise to the headlines
8. DATA QUALITY
Big Data is:
• Big even the rarest of phenomena occur frequently
• Complex data and its quality are hard to evaluate
• Growing no time to stop
Success of analytics depends directly on data quality and the skills to control it
Success of business depends on the success of analytics
9. DATA QUALITY
• Data is combined from a number of varied sources
• Variable definition depends on who’s asked and where data is read from
• Rapid data development makes it hard to grasp the current state of data
• New data is sought out at the expense of quality
• Detecting exceptions, errors and jumps from the big mass of data is hard
10. DATA QUALITY
Lack of documentation and
errors in it
Changes in variable
definition
New variables, old
variables disappear
Wrong or inconsistent
units of measure
Missing
values
Text and numbers
mixed together
Inconceivable
timestamps
Temporary, copied,
transient IDs without
counterparts
Broken IDs
Corrupted fields
Lies and fraud
11. CHOOSING THE RIGHT OBJECTIVE
Analytics objectives don’t form in a vacuum:
• Business objectives
• Error costs
• Data properties
• Each analytics solution has a metric of success
• Example: measure of success for finding the most promising 0.1 % of customers?
• Best metric is business value: money, strategic progress, societal impact
12. CHOOSING THE RIGHT QUALITY
Error costs vary greatly by application:
• Evaluating the possibility and risks of an earthquake
• Potential vs. patient safety in testing a new drug molecule
• Making an unpleasant product recommendation to a customer
• Recommending a product the customer already has
• Incorrect controls for a gas turbine
Analytics live in the balance of upside and downside
13. APPLICATIONS: UNSUPERVISED LEARNING
• Early detection of machine failure or network intrusion
• Determining the detailed movie taste of a consumer
• Identifying communities and emerging topics in a social network
• Search engine
• Zombie epidemic modeling
14. APPLICATIONS: SOURCE SEPARATION
• Language modeling
• Brain research
• Understanding the underlying reasons of climate change
• Controlling the dynamics of an industrial process
• Risk evaluation in a self-driving car
15. APPLICATIONS: SUPERVISED LEARNING
• Spam e-mail detection
• Predicting concrete strength
• Choosing the right ad to show and the right price for it
Semi-supervised learning
• Object detection in a video feed
• Sentiment analysis in web forums
16. POWER LAWS
• School teaches us that everything follows the normal distribution
• In reality very many data sources follow a power law – ”the long tail”
The world is full of power laws:
Customer value and activity
Brain activity
Earthquake size
Distribution of wealth
Size of sand grains
Human social behavior
Length of rivers
Activity and volatility of stock exchanges
Electric noise
City size
Humans don’t behave the way you think
17. POWER LAWS
• ”Whoever has will be given more” big network effects
• Example: popular websites get more new links
• Example: famous actors get more roles
• Extremely skewed distribution: huge top, but almost everyone at the bottom
• Averages are horribly bad metrics
• Most traditional analytic methods go crazy
• Different parts of the power law curve behave very differently
23. STATISTICAL SIGNIFICANCE
Big Data is
• Big any weird phenomenon can be found when sought out long enough
• Complex possibility to make lots of really complex questions
Humans are extraordinarily bad at interpreting statistics
You are not an exception
Big Data offers the perfect environment to prove this
24. STATISTICAL SIGNIFICANCE
• Decision maker: ”Can I trust these numbers? Is my decision justified?”
• Statistical significance is different from real-world significance
• Systems must play safe and avoid groundless conclusions and actions
• Trust in analytics is built slowly but lost quickly
25. STATISTICAL SIGNIFICANCE
Pivotal prerequisites for reliable significance estimation:
• Correct modeling of the data source and the sought out phenomena
• Strict prior assertion of patterns that will be tested
Example from bioinformatics:
• Gene activity isn’t just Gaussian noise
• Thousands of genes and conditions are tested simultaneously
• Thousands of available methods to search for peculiarities
26. CORRELATION AND CAUSALITY
• Correlation is not causality
• But correlation is often enough in analytics
Correlation may hide an arbitrary truth
• There are more conflagrations when there are more firemen around
• Companies investing more in marketing have higher revenues
27. ANALYTIC TESTING
• Automated analytics is revolutionizing data collection and innovation
• Not only technology but even more ideology
• ”How do we best design the UI logic and components?”
• ”Which algorithm produces better results according to the users?”
• ”What pricing strategy can we use for maximizing the profit from a flight?”
• A/B-testing as the starting point
• Bandit testing as the modern construction
29. WHAT ARE IMPORTANT METRICS?
Do not choose metrics, choose business problems
• Visible change in metrics visible change in business
• Business problems morph and change continuously
• Internet will not tell you your problem
Understanding is not enough, analytics must provide the tools for the solution
30. EXAMPLE: TWO MOBILE APPS, TWO METRIC SETS
New app
• Most effective user acquisition channel?
• Most effective means to organic growth?
• How to fix new user onboarding?
• What features are not used?
• Make a ”special offer” after 2 or 5 days?
Established app
• Which user segment is still under-
developed?
• What makes users to leave?
• What content is best for monetization?
• Are there saturated users with current
content?
31. THE TASK OF THE DATA SCIENTIST
Modeling business, not data
• Data scientists transform business problems into data solutions
• The world is full of problems and analytics is full of solutions
• How to build bridges from one side to the other?
32. WHAT SKILLS DOES DATA SCIENCE REQUIRE?
• Probabilities
• Programming and scripting
• Computational sciences
• Data systems
• Ability to overcome obstacles and manage complexity
• Intuition and experience
• Ability to notice small details while forming the general picture
• Business acumen
33. OPERATIVE ANALYTICS
• Analytics is often seen as pretty pictures on slides and lobby monitors
• The impact of analytics goes 1000x when automated as part of operations
• Operative analytics analyzes and reacts to data continuously, around the
clock, without any humans in the loop
34. OPERATIVE ANALYTICS: EXAMPLES
• Marketing budget is not reweighed once per week by analysts evaluating
past results, but every second by predictive algorithms
• Manufacturing network automatically reorganizes the production of
thousands of SKUs in all the different production units based on supply and
demand predictions
• Machines not only provide information about patient’s state, but
continuously evaluate risks of complications and recommend further actions
35. CHALLENGES IN OPERATIVE ANALYTICS
• Automated analytics is 10x harder
• Very high requirements for data quality, detailed understanding of algorithms
and system reliability
• ”Weird” data must not cause ”bad” reactions
• Data availability is business critical
• Analytics availability is business critical
• Analytics reliability is business critical
36. WHAT IS REAL-TIME ANALYTICS?
• Analyst: ”What’s the user count today? By source? Now? In France?”
• Sysadmin: ”Network traffic has a weird spike during the last 10 seconds, why?”
• Ad exchange: ”What do you offer for this ad placement? You have 50 ms”
• Engine controller: ”Data from these 12 sensors during the last 10 microseconds
shows that I should tell the control motors to change their state”
37. DOES ANALYTICS HAVE TO BE COMPLEX?
• An average company has a ton of problems solvable by very simple analytics
• Solving and automating solutions to these takes many many years
• Developing more extensive automated analytics takes always a lot longer
than anyone ever expects
• Developing complex analytics is useless (or worse) if the underlying
fundamentals are not already understood well enough
38. ANALYTICS USER INTERFACE
Analytics is not taken into use if it doesn’t make its users life
easier, higher quality and more efficient
Visualization is decisive both for reaping benefits and for acceptance in the
organization, from concepting up to final results
Majority of analytics investments goes to providing a good interface to the user,
this applies also to operative cases
39. ANALYTICS USER INTERFACE
• ”What information must these users see?”
• ”What information does this decision making require?”
• ”How to represent it with clarity, but showing every relevant detail?”
• ”How to represent it so that no wrong conclusions can be made?”
40. COMMON PROBLEMS IN USING ANALYTICS
• Lacking focus on data quality and its compensation
• Poor understanding and choice of metrics
• Wrong interpretation of metrics
• Wrong simplification (e.g. using means)
• Forgetting the significance of discoveries
• Deficient identification of error sources
• Deficient initial objectives
• Missing essential data (sometimes very hard to fix)
• Key finds are left disregarded and not automated as part of operations
• Doing too complicated things
42. MACHINE- AND HUMAN-GENERATED DATA
Human-generated:
• 6K tweets / s
• 40K events / s from a mobile game (~200 GB / day)
• 50K Google searches / s
Machine-generated:
• 5M quotes / s in the US options market
• 120 MB / s diagnostics from a gas turbine
• 1 PB / s peaking from CERN LHC accelerator
43. MACHINE- AND HUMAN-GENERATED DATA
• Human-generated data will grow, but mostly in detail level
• Almost all human-generated data is ”small”
• Machine-generated data is vast, limited mainly by storage capacity
• Internet of Things will again totally change the way machine-generated data
is collected and managed
44. DATA VERSUS ALGORITHM
”Simple models and a lot of data trump
more elaborate models based on less data” – Peter Norvig
Reasons:
• More variables reduces bias, more data points reduces variance
• Simple methods are easy to control, especially in operations
• Time of computation does matter in large scale
Lately an exception to the rule has emerged
45. DEEP LEARNING
• In essence just regular neural networks, but with large and complex layer structure
• A long string of small breakthroughs made this method extremely effective
• An exception where ”huge amounts of data and a very complex model” wins
Special properties:
• Works especially well for human cognitive tasks (vision, sound, language)
• Automates away a big part of the need for subject matter expertise
• Requires vast amounts of both data and computation
• A good platform for integrating supervised and unsupervised learning
46. EXAMPLE: GOOGLENET
• 27 layers, 5M parameters, 7 of these in ensemble
• Learning takes a week of (fast) GPU time
• Image recognition exceeding human skills
Husky
vs.
Malamute
48. DATA SYSTEMS IN TRANSITION
• Traditional systems work well for transactions but not for analytics
• Different data and different objectives need a very different system
Data must be
• Always and immediately available around the world
• Available concurrently to a myriad of users
• Open to free combination with other data sources
49. NEW DATA SYSTEMS – HADOOP
• Hadoop brought cheap and reliable data storage and the at least theoretical
ability to process huge data
• There is no The Hadoop – it’s a general platform for heterogeneous
computing and a collection of systems and applications
Hadoop is the right answer only for the very few
51. NEW DATA SYSTEMS - CLOUD
Old methods of storing and using data fit poorly to the new requirements
Cloud fixes several problems
• Reliability and durability
• Scalability, distribution, concurrency
• Equivalent simple access from everywhere
The cloud is the only right choice for most people
52. NEW DATA SYSTEMS – DATA STREAMS
• Previously data was seen as a static state that was updated
• Now data is seen as a continuous stream of small changes
• No data ever gets lost, it just accumulates
Data needs to be analyzed as it arrives
The ”best before” period of data is getting shorter:
• ”Why look at month-old data when there’s 10 GB more arriving today?”
• ”Yesterday’s data must be used now before it becomes useless”
53. INTERNET OF THINGS
• We understand very little about all our surroundings
• Internet of Things will totally change this, for both humans and machines
• Vast amounts of very complex data
• Possibilities are huge, but still quite unclear
• Technology exists, but is far from mature
• Who will analyze all this data and take it into use?
55. WHAT DOES BIG DATA MEAN FOR BUSINESS?
Value is not measured only in money, but also in data
• Paying customers are always a small minority
• Non-paying customers provide valuable data
Example: Google makes $15B in profit although it offers ”free” e-mail, office
tools, cloud storage, video library, search engine, etc.
56. STEPS IN EMBRACING ANALYTICS
1. Uncontrolled – chaotic, often broken data, ad-hoc use cases
2. Reactive – Local use cases in silos, information doesn’t travel across
3. Governed – Data is used based on a common strategy and planning
4. Core competence – Data is at the core of all business activity
5. Strategic – Data has its own strategy and its value and investments are
planned at the highest level
57. ANALYTICS AND COMPANY CULTURE
The biggest challenge in analytics is not the technology but the people
• How to get the organization to trust data instead of status, consensus, experience,
intuition or prejudice?
• How to get the organization to demand data and question the old truths?
• The transformation must start from the top, but the changes come from the bottom
• Collaboration between analytics pros and amateurs helps gain support for the change
• Success requires a big initial bet spearhead projects are pivotal
58. ANALYTICS AND COMPANY ORGANIZATION
• How to build an organization and its processes to employ data at every step?
• Centralized management and development of data and high level analytics
expertise is crucial
• Option 1: Strong centralized unit co-operating with business units
• Option 2: Centralized unit provides technology and specialized expertise to
analysts with use case knowledge dispersed to the business units
59. DATA STRATEGY
Data is an asset
• What is the capex, depreciation and amortization of data?
• How to invest in data and analytics assets?
• How to turn data into income?
• Can you buy and sell data?
• How to book data assets?
• Any key technology requires its own strategy, what is the data strategy?
60. ANALYTICS AND COMPANY STRATEGY
”What game do we play?”
• The right analytics brings major competitive advantages
• Many companies base their strategy on what exclusive data they have
”How do we keep the score?”
• Analytics evaluates the progress and success of company strategy
• Analytics not only tells the score, but provides tools to improve it