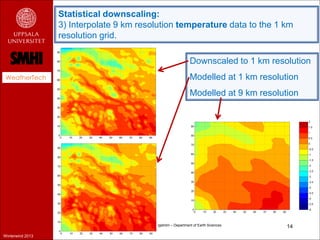
Creating an icing climatology
 WeatherTech             using downscaling techniques
                              Results from Vindforsk project V-313


                      Hans Bergström and Petra Thorsson, Uppsala universitet
                               Esbjörn Olsson and Per Undén, SMHI
                  Stefan Söderberg, Magnus Baltscheffsky, Weathertech Scandinavia


                                      Hans Bergström – Department of Earth Sciences   1
Winterwind 2013
What do we mean by an ”icing climatology”?

                  A mapping of icing should give answers to questions as:
 WeatherTech
                  •   How often icing occurs
                  •   How long the icing persists
                  •   How large the amounts of ice are

                  The most important questions may be:

                  •   How often do active icing occur?
                  •   How is the production affected?


                                      Hans Bergström – Department of Earth Sciences   2
Winterwind 2013
An icing climatology could be based upon todays NWP models
                  (Numerical Weather Prediction) or upon meteorological
                  observations.

                  Data from weather              Data from meteorological
                  models (NWP)         or        observations
 WeatherTech


                    Model of ice load                  dM
                                                            E  w V  D  Q
                      (Makkonen)                        dt
                                                    dM/dt=ice growth (M = ice mass, t = time)
                                                    E = accretion efficiency
                     Modelled ice load              w = liquid water content
                     Comparisons with               V = wind speed
                   observations of ice load         D = diameter
                                                    Q = melting, sublimation
                                                    Gives ice growth on a 0.5 m long cylinder
                                                    with 30 mm diameter.
                                       Hans Bergström – Department of Earth Sciences      3
Winterwind 2013
Icing modelling - what do we know today?

                  • Models catch the icing events quite well
                  • But sometimes large differences between modelled and
 WeatherTech        measured ice amounts
                  • Measuring ice loads very difficult


                                      Measured                                       Modelled


                                     Hans Bergström – Department of Earth Sciences              4
Winterwind 2013
Icing climatology:
                  Two problems to balance:
                  • The need for period length to get a representative
                    estimate of the climate
 WeatherTech
                  • The need for resolution to get a result accurately
                    reproducing the geographical variations


                  Our options
                  • A long period (30 years) is dynamically modelled using low
                    resolution (9 km) – the results are then dowscaled to
                    desired resolution (1 km).
                  • A limited number of periods is modelled with high
                    resolution – the periods are chosen to be representative
                    for the icing cimate.

                                     Hans Bergström – Department of Earth Sciences   5
Winterwind 2013
Icing climatology: Is 30 years really needed?
                  This example shows variability between seasons.
                  Monthly numbers of icing hours according to measurements at a
                  site in northern Sweden
                  How representative is a single year? Not at all!
 WeatherTech
                  Or 10 or 30 years?


                                      Hans Bergström – Department of Earth Sciences   6
Winterwind 2013
Icing climatology: Downscaling

                  Step 1: Downscale to 9 km resolution from reanalysis data
                  (ERA-Interim, NCEP/NCAR, GFS) using a mesoscale NWP.
 WeatherTech
                  Here WRF & COAMPS have been used.
                  Result is a 30 year climatology.


                  Step 2: Statistical downscaling from 9 km to 1 km resolution.
                  What is needed?
                  Icing is dependent on wind speed, temperature and liquid
                  water content (also precipitation).
                  Thus all must be included in the downscaling.
                  To take account of seasonal (and annual) variations, the
                  statistical downscaling is made on a monthly basis.
                                     Hans Bergström – Department of Earth Sciences   7
Winterwind 2013
Model domains – COAMPS/WRF: Outer mesh forced by GFS
                  Grid resolutions: 27x27, 9x9, 3x3, 1x1 km2


 WeatherTech


                  Winter seasons 2010/2011 and 2011/2012.


                                      Hans Bergström – Department of Earth Sciences   8
Winterwind 2013
Statistical downscaling:
                  1) Interpolate 9 km resolution topography data to the 1 km
                  resolution grid.


 WeatherTech
                  1 km resolution topography                              9 km resolution topography


                                       Hans Bergström – Department of Earth Sciences          9
Winterwind 2013
Statistical downscaling:
                  2) Interpolate 9 km resolution wind speed data to the 1 km
                  resolution grid.
                  Wind speed versus height – monthly averages at each 1 km grid
                  point.
 WeatherTech


                                       Hans Bergström – Department of Earth Sciences   10
Winterwind 2013
Statistical downscaling:
                  2) Interpolate 9 km resolution wind speed data to the 1 km
                  resolution grid.

                                                                 Downscaled to 1 km resolution
 WeatherTech                                                     Modelled at 1 km resolution
                                                                 Modelled at 9 km resolution


                                       Hans Bergström – Department of Earth Sciences     11
Winterwind 2013
Statistical downscaling:
                  3) Interpolate 9 km resolution temperature data to the 1 km
                  resolution grid.
                  Temperature versus height – monthly averages at each 1 km grid
                  point. A month with typical decrease of temperature with height.
 WeatherTech


                                      Hans Bergström – Department of Earth Sciences   12
Winterwind 2013
Statistical downscaling:
                  3) Interpolate 9 km resolution temperature data to the 1 km
                  resolution grid.
                  Temperature versus height – monthly averages at each 1 km grid
                  point. A month with temperature inversions.
 WeatherTech


                                       Hans Bergström – Department of Earth Sciences   13
Winterwind 2013
Statistical downscaling:
                  3) Interpolate 9 km resolution temperature data to the 1 km
                  resolution grid.

                                                                 Downscaled to 1 km resolution
 WeatherTech                                                     Modelled at 1 km resolution
                                                                 Modelled at 9 km resolution


                                       Hans Bergström – Department of Earth Sciences     14
Winterwind 2013
Statistical downscaling:
                  4) Interpolate 9 km resolution liquid water content (LWC) data
                  to the 1 km resolution grid.
                  LWC versus height – monthly averages at each 1 km grid point.
                  Poor relation – NOT USED!
 WeatherTech


                                       Hans Bergström – Department of Earth Sciences   15
Winterwind 2013
Statistical downscaling:
                  4) Interpolate 9 km resolution liquid water content (LWC) data
                  to the 1 km resolution grid.
                  Alternative: Use 9 km temperature and specific humidity.
                  Assume specific humidity is preserved:
 WeatherTech
                  Lift temperature from 9 km terrain height to 1 km height
                                            ↓
                  Gives new temperatures at corrected height
                                            ↓
                  Determine specific humidity at saturation
                                            ↓
                  If super-saturated, increase LWC until 100 % rel.humidity
                                            ↓
                  Use Makkonen’s equation to estimate icing
                                            ↓
                  If ice accretion > 10 g/h count as ”icing hour”


                                       Hans Bergström – Department of Earth Sciences   16
Winterwind 2013
Statistical downscaling:
                  4) Number of icing hours interpolate from 9 km resolution to 1 km
                  resolution grid.

                                                                 Downscaled to 1 km resolution
 WeatherTech                                                     Modelled at 1 km resolution
                                                                 Modelled at 9 km resolution


                                       Hans Bergström – Department of Earth Sciences     17
Winterwind 2013
Statistical downscaling:
                  Domain averages of seasonal number of icing hours.
                  Larger differences between models than from using statistical
                  downscaling.

 WeatherTech


                                       Hans Bergström – Department of Earth Sciences   18
Winterwind 2013
Statistical downscaling:
                  Domain maximum of seasonal number of icing hours.
                  Differences between models not so large.
                  9 km resolution results underestimate the maximum.
                  Statistical downscaling in reasonable agreement with 1 km
 WeatherTech
                  resolution results.


                                       Hans Bergström – Department of Earth Sciences   19
Winterwind 2013
Summary and conclusions

 WeatherTech
                  Statistical downscaling possible to use.
                  Comparing 1 km resolution model results to statistically
                  downscaled results:
                  • Advantage: We gain accuracy as regards climatological
                    representativity – possible to use long enough periods
                  • Drawback: We may loose accuracy as regards local
                    terrain response.


                                                                             20
Winterwind 2013
Summary and conclusions

 WeatherTech
                  Alternative to statistical downscaling: Model representative
                  periods with high resolution?
                  • Advantage: We directly model with 1 km resolution – no
                    downscaling needed.
                  • Drawback: We loose some accuracy as regards
                    climatological representativity.
                    How representative are the chosen periods?


                                      Hans Bergström – Department of Earth Sciences   21
Winterwind 2013
Future work
                  What method to use for a climatology:
                  Statistical downscaling or representative periods?
                  • Statistical downscaling: Needs less computer time but a
                    larger amount of man months.
 WeatherTech
                  • Representative periods: Not so many man months needed
                    but large amounts of computer time as at least five years
                    are needed for a reasonable accurate climatology.


                  Regarding the final accuracy of the results it is difficult to say
                  which method is to be recommended – uncertainties due to a
                  shorter period length has to be weighed against statistical
                  uncertainties with the downscaling,
                  AND – the differences are sometimes large between the
                  models used – maybe this is the largest uncertainty.
                  MORE RESEARCH IS NEEDED to increase the accuracy!
                                       Hans Bergström – Department of Earth Sciences   22
Winterwind 2013
Thank you for yout attention


 WeatherTech      Hans Bergström
                  hans.bergstrom@met.uu.se


                  V-313 Windpower in cold climates
                  Report will be published here (likely in March 2013):
                  http://www.elforsk.se/Programomraden/El--
                  Varme/Vindforsk/reports/reports_area_1_2/


                                       Hans Bergström – Department of Earth Sciences   23
Winterwind 2013

Bergström hans

  • 1.
    Creating an icingclimatology WeatherTech using downscaling techniques Results from Vindforsk project V-313 Hans Bergström and Petra Thorsson, Uppsala universitet Esbjörn Olsson and Per Undén, SMHI Stefan Söderberg, Magnus Baltscheffsky, Weathertech Scandinavia Hans Bergström – Department of Earth Sciences 1 Winterwind 2013
  • 2.
    What do wemean by an ”icing climatology”? A mapping of icing should give answers to questions as: WeatherTech • How often icing occurs • How long the icing persists • How large the amounts of ice are The most important questions may be: • How often do active icing occur? • How is the production affected? Hans Bergström – Department of Earth Sciences 2 Winterwind 2013
  • 3.
    An icing climatologycould be based upon todays NWP models (Numerical Weather Prediction) or upon meteorological observations. Data from weather Data from meteorological models (NWP) or observations WeatherTech Model of ice load dM  E  w V  D  Q (Makkonen) dt dM/dt=ice growth (M = ice mass, t = time) E = accretion efficiency Modelled ice load w = liquid water content Comparisons with V = wind speed observations of ice load D = diameter Q = melting, sublimation Gives ice growth on a 0.5 m long cylinder with 30 mm diameter. Hans Bergström – Department of Earth Sciences 3 Winterwind 2013
  • 4.
    Icing modelling -what do we know today? • Models catch the icing events quite well • But sometimes large differences between modelled and WeatherTech measured ice amounts • Measuring ice loads very difficult Measured Modelled Hans Bergström – Department of Earth Sciences 4 Winterwind 2013
  • 5.
    Icing climatology: Two problems to balance: • The need for period length to get a representative estimate of the climate WeatherTech • The need for resolution to get a result accurately reproducing the geographical variations Our options • A long period (30 years) is dynamically modelled using low resolution (9 km) – the results are then dowscaled to desired resolution (1 km). • A limited number of periods is modelled with high resolution – the periods are chosen to be representative for the icing cimate. Hans Bergström – Department of Earth Sciences 5 Winterwind 2013
  • 6.
    Icing climatology: Is30 years really needed? This example shows variability between seasons. Monthly numbers of icing hours according to measurements at a site in northern Sweden How representative is a single year? Not at all! WeatherTech Or 10 or 30 years? Hans Bergström – Department of Earth Sciences 6 Winterwind 2013
  • 7.
    Icing climatology: Downscaling Step 1: Downscale to 9 km resolution from reanalysis data (ERA-Interim, NCEP/NCAR, GFS) using a mesoscale NWP. WeatherTech Here WRF & COAMPS have been used. Result is a 30 year climatology. Step 2: Statistical downscaling from 9 km to 1 km resolution. What is needed? Icing is dependent on wind speed, temperature and liquid water content (also precipitation). Thus all must be included in the downscaling. To take account of seasonal (and annual) variations, the statistical downscaling is made on a monthly basis. Hans Bergström – Department of Earth Sciences 7 Winterwind 2013
  • 8.
    Model domains –COAMPS/WRF: Outer mesh forced by GFS Grid resolutions: 27x27, 9x9, 3x3, 1x1 km2 WeatherTech Winter seasons 2010/2011 and 2011/2012. Hans Bergström – Department of Earth Sciences 8 Winterwind 2013
  • 9.
    Statistical downscaling: 1) Interpolate 9 km resolution topography data to the 1 km resolution grid. WeatherTech 1 km resolution topography 9 km resolution topography Hans Bergström – Department of Earth Sciences 9 Winterwind 2013
  • 10.
    Statistical downscaling: 2) Interpolate 9 km resolution wind speed data to the 1 km resolution grid. Wind speed versus height – monthly averages at each 1 km grid point. WeatherTech Hans Bergström – Department of Earth Sciences 10 Winterwind 2013
  • 11.
    Statistical downscaling: 2) Interpolate 9 km resolution wind speed data to the 1 km resolution grid. Downscaled to 1 km resolution WeatherTech Modelled at 1 km resolution Modelled at 9 km resolution Hans Bergström – Department of Earth Sciences 11 Winterwind 2013
  • 12.
    Statistical downscaling: 3) Interpolate 9 km resolution temperature data to the 1 km resolution grid. Temperature versus height – monthly averages at each 1 km grid point. A month with typical decrease of temperature with height. WeatherTech Hans Bergström – Department of Earth Sciences 12 Winterwind 2013
  • 13.
    Statistical downscaling: 3) Interpolate 9 km resolution temperature data to the 1 km resolution grid. Temperature versus height – monthly averages at each 1 km grid point. A month with temperature inversions. WeatherTech Hans Bergström – Department of Earth Sciences 13 Winterwind 2013
  • 14.
    Statistical downscaling: 3) Interpolate 9 km resolution temperature data to the 1 km resolution grid. Downscaled to 1 km resolution WeatherTech Modelled at 1 km resolution Modelled at 9 km resolution Hans Bergström – Department of Earth Sciences 14 Winterwind 2013
  • 15.
    Statistical downscaling: 4) Interpolate 9 km resolution liquid water content (LWC) data to the 1 km resolution grid. LWC versus height – monthly averages at each 1 km grid point. Poor relation – NOT USED! WeatherTech Hans Bergström – Department of Earth Sciences 15 Winterwind 2013
  • 16.
    Statistical downscaling: 4) Interpolate 9 km resolution liquid water content (LWC) data to the 1 km resolution grid. Alternative: Use 9 km temperature and specific humidity. Assume specific humidity is preserved: WeatherTech Lift temperature from 9 km terrain height to 1 km height ↓ Gives new temperatures at corrected height ↓ Determine specific humidity at saturation ↓ If super-saturated, increase LWC until 100 % rel.humidity ↓ Use Makkonen’s equation to estimate icing ↓ If ice accretion > 10 g/h count as ”icing hour” Hans Bergström – Department of Earth Sciences 16 Winterwind 2013
  • 17.
    Statistical downscaling: 4) Number of icing hours interpolate from 9 km resolution to 1 km resolution grid. Downscaled to 1 km resolution WeatherTech Modelled at 1 km resolution Modelled at 9 km resolution Hans Bergström – Department of Earth Sciences 17 Winterwind 2013
  • 18.
    Statistical downscaling: Domain averages of seasonal number of icing hours. Larger differences between models than from using statistical downscaling. WeatherTech Hans Bergström – Department of Earth Sciences 18 Winterwind 2013
  • 19.
    Statistical downscaling: Domain maximum of seasonal number of icing hours. Differences between models not so large. 9 km resolution results underestimate the maximum. Statistical downscaling in reasonable agreement with 1 km WeatherTech resolution results. Hans Bergström – Department of Earth Sciences 19 Winterwind 2013
  • 20.
    Summary and conclusions WeatherTech Statistical downscaling possible to use. Comparing 1 km resolution model results to statistically downscaled results: • Advantage: We gain accuracy as regards climatological representativity – possible to use long enough periods • Drawback: We may loose accuracy as regards local terrain response. 20 Winterwind 2013
  • 21.
    Summary and conclusions WeatherTech Alternative to statistical downscaling: Model representative periods with high resolution? • Advantage: We directly model with 1 km resolution – no downscaling needed. • Drawback: We loose some accuracy as regards climatological representativity. How representative are the chosen periods? Hans Bergström – Department of Earth Sciences 21 Winterwind 2013
  • 22.
    Future work What method to use for a climatology: Statistical downscaling or representative periods? • Statistical downscaling: Needs less computer time but a larger amount of man months. WeatherTech • Representative periods: Not so many man months needed but large amounts of computer time as at least five years are needed for a reasonable accurate climatology. Regarding the final accuracy of the results it is difficult to say which method is to be recommended – uncertainties due to a shorter period length has to be weighed against statistical uncertainties with the downscaling, AND – the differences are sometimes large between the models used – maybe this is the largest uncertainty. MORE RESEARCH IS NEEDED to increase the accuracy! Hans Bergström – Department of Earth Sciences 22 Winterwind 2013
  • 23.
    Thank you foryout attention WeatherTech Hans Bergström hans.bergstrom@met.uu.se V-313 Windpower in cold climates Report will be published here (likely in March 2013): http://www.elforsk.se/Programomraden/El-- Varme/Vindforsk/reports/reports_area_1_2/ Hans Bergström – Department of Earth Sciences 23 Winterwind 2013