Downloaded 27 times

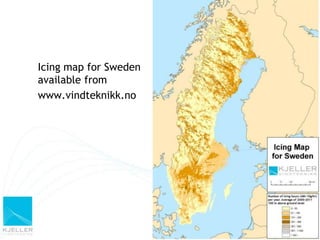


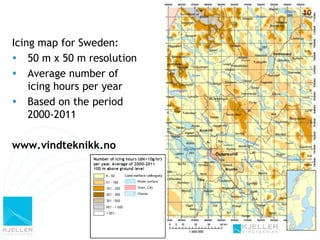

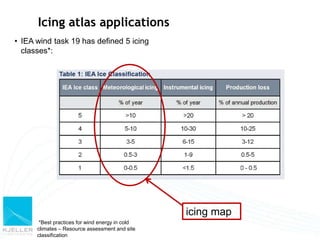
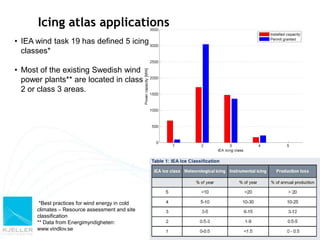
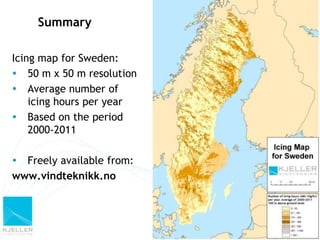

The document describes an icing map of Sweden created using a mesoscale weather model. The map shows the average number of icing hours per year from 2000-2011 at a resolution of 50m x 50m grid cells. The map is available online and can help with siting new wind farms by analyzing potential icing conditions and estimated production losses at different locations. It also categorizes areas into 5 icing classes defined by the IEA to aid in site classification for wind energy projects.


