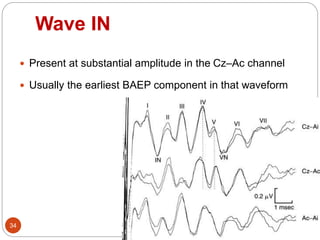
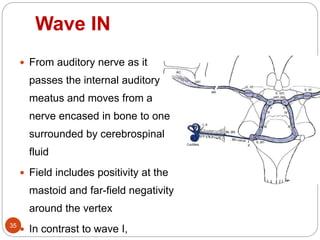
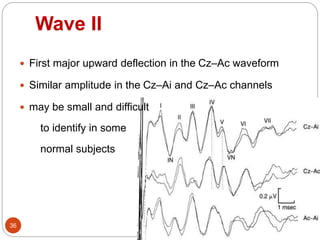
Downloaded 791 times

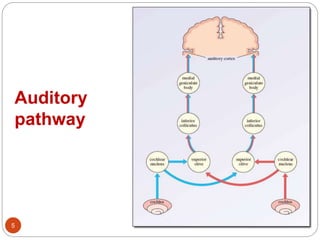
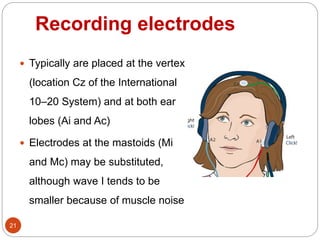
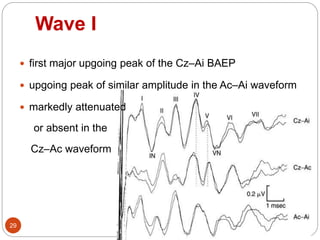
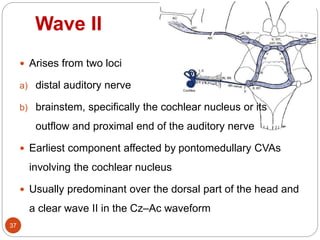
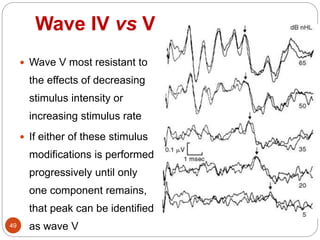
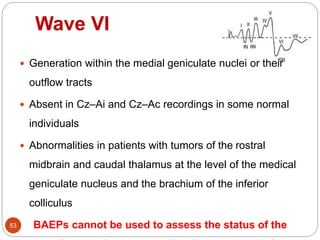
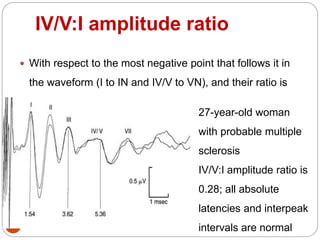
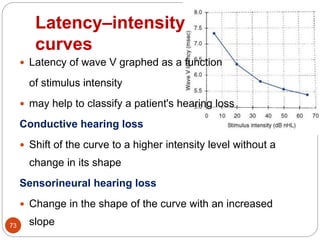
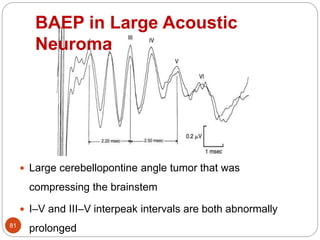


This document provides an overview of brainstem auditory evoked potentials (BAEPs). It discusses the history and development of BAEPs, the auditory pathway, stimulation and recording techniques, waveform identification, and clinical interpretation. Some key points: - BAEPs evaluate the ear, auditory nerve, and brainstem pathways using electrodes on the scalp to record responses to click stimuli. - Short-latency waves I-V arise from specific structures along the ascending auditory pathway from cochlear nerve to inferior colliculus. - Stimulation is typically with clicks at 10-20 Hz through headphones, with masking of the contralateral ear. Recordings analyze responses over 10 ms. -