History
2
Sohmer and Feinmesser
Signal-averaged ECochG studies
Jewett and co-workers
Identified the short-latency scalp-recorded AEPs as far-field potentials
volume-conducted from the brainstem, described the components and
their properties
Established the Roman numeral labeling of the peaks
3.
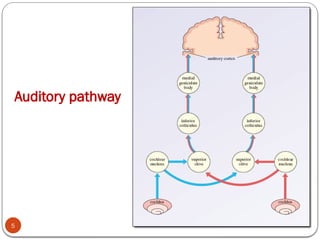
Brainstem Auditory EvokedPotentials
Following a transient acoustic stimulus, ear and parts of the nervous
system generate a series of electrical signals with latencies ranging
from milliseconds to hundreds of milliseconds
Recorded from electrodes placed on the skin
To evaluate noninvasively the function of the ear and portions of the
nervous system activated by the acoustic stimulation
3
4.
BAEPs
4
Generated byan anatomically distinguishable neuronal subsystem for
sound localization within the brainstem
BAEPs can be used only to assess the status of the ear, auditory nerve,
and brainstem auditory pathways up through the level of the
mesencephalon
BAEPs
6
Ascending projectionsfrom the cochlear nucleus are bilateral but are
more extensive contralaterally than ipsilaterally
Despite this anatomic asymmetry, the BAEPs appear to reflect
predominantly activity in the ipsilateral ascending pathways
7.
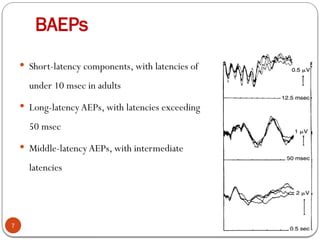
BAEPs
7
Short-latency components,with latencies of
under 10 msec in adults
Long-latency AEPs, with latencies exceeding
50 msec
Middle-latencyAEPs, with intermediate
latencies
8.
Long-latency AEPs
8
Affectedprofoundly by the degree to which the subject is attending to
the stimuli and analyzing stimulus features
Used as probes of cognitive processes
Their variability, as well as uncertainty about the precise identity of
their cortical generators, limits their utility for neurologic diagnosis
Middle- and Long-latencyAEP
10
generated predominantly by postsynaptic potentials within areas of
cerebral cortex that are activated by the acoustic stimulus
affected increasingly by the state of the subject and by anesthesia as
their latency increases
11.
Short-latency AEPs
11
Greatest clinicalutility because
Relatively easy to record
Waveforms and latencies are highly consistent across normal subjects
Unaffected by the subject's degree of attention to the stimuli and are
almost identical in the waking and sleeping states
Minor differences related to changes in body temperature
12.
12
Although short-latency AEPscommonly are called brainstem auditory
evoked potentials, this term is not completely accurate because the
roster of generators clearly includes the distal (with respect to the
brainstem) cochlear nerve and may also include the thalamocortical
auditory radiations, neither of which is within the brainstem
13.
Stimulation
13
Brief acousticclick stimuli that are produced by delivering
monophasic square pulses of 100- sec duration to headphones or
μ
other electromechanical transducers at a rate of about 10 hz
A rate of exactly 10 hz or another submultiple of the power line
frequency should be avoided because of line frequency artifact
Stimulus intensity of 60 to 65 db HL is a typical level
If hearing loss is present, stimulus intensity may be adjusted
accordingly
14.
Stimulation
14
Stimuli aredelivered monaurally
To prevent contralateral ear stimulation it is masked with continuous
white noise at an intensity 30 to 40 dB below that of the BAEP
stimulus
Activate region of the cochlea (base) responding to 2,000- to 4,000-
Hz sounds
15.
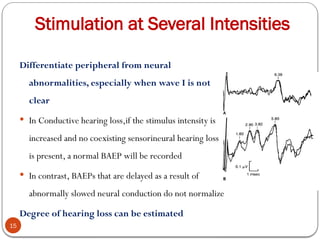
Stimulation at SeveralIntensities
15
Differentiate peripheral from neural
abnormalities, especially when wave I is not
clear
In Conductive hearing loss,if the stimulus intensity is
increased and no coexisting sensorineural hearing loss
is present, a normal BAEP will be recorded
In contrast, BAEPs that are delayed as a result of
abnormally slowed neural conduction do not normalize
Degree of hearing loss can be estimated
16.
Rapid Stimulation
16
Approximately10 Hz is used for routine clinical testing
As the stimulus rate is increased above approximately 10 per sec,
component amplitudes decrease and the peaks tend to become less
well defined
WaveV is most resistant to these effects
More rapid rates may be used to facilitate recordings to measure the
waveV threshold
17.
Stimulus clicks accordingto polarity
17
Compression click (condensation click)
If the electrical square pulse causes the diaphragm of the acoustic
transducer to move toward the patient's ear
Rarefaction click
Reversing the polarity of the electrical square pulse
Generally preferable because BAEP peaks tend to be clearer
18.
Alternative Auditory Stimuli
18
Stimulationwith brief tone pips
To probe specific parts of the cochlea
Acoustic masking
Used to obtain frequency-specific information from BAEPs
Relatively poor signal-to-noise ratios
19.
BAEPs by bone-conductedstimuli
19
Most useful in assessing patients who may have conductive hearing
losses, such as neonates in whom BAEPs performed with air-
conducted stimuli are suggestive of a hearing loss
20.
BAEPs to ElectricalStimuli
20
Electrical stimulation of eighth nerve fibers through the electrodes of
a cochlear prosthesis
Used to assess the proximity of these electrodes to the spiral ganglion
during implantation and the adequacy of eighth nerve stimulation
during programming of the processor
Correlate well with auditory outcomes, and may prove to be useful in
guiding therapy in young children with questionable auditory nerve
integrity
21.
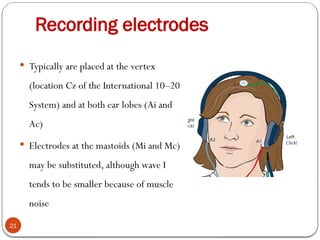
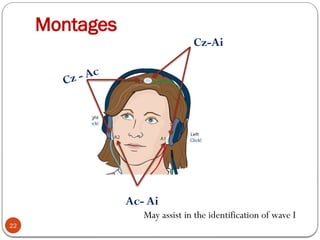
Recording electrodes
21
Typicallyare placed at the vertex
(location Cz of the International 10–20
System) and at both ear lobes (Ai and
Ac)
Electrodes at the mastoids (Mi and Mc)
may be substituted, although wave I
tends to be smaller because of muscle
noise
Patient relaxation
23
Patientsusually are tested while lying comfortably so that their neck
musculature is relaxed
Patients should be requested to let their mouth hang open if the
muscles of mastication are tensed
encouraged to sleep during testing
If the patient cannot relax sufficiently, sedation can be induced with
agents such as chloral hydrate (little or no effect on BAEPs in the usual
sedative doses)
24.
Data analysis
24
Amplifierfilters out all of the delta, theta, alpha, and beta bands of the
EEG
Biologically derived noise in the recordings is derived predominantly
from muscle activity
Therefore, patient relaxation during the recording session is essential
to obtain “clean” waveforms with a good signal-to-noise ratio
25.
Data analysis
25
Datatypically are digitized over an epoch duration or analysis time of
approximately 10 msec
Longer analysis time of 15 msec may be required for recording
pathologically delayed BAEPs, BAEPs to lowered stimulus intensities
(as when recording a latency–intensity study), BAEPs in children, and
BAEPs during intraoperative monitoring
Signal averaging is required for improvement in the signal-to-noise
ratio
26.
Waveform Identification
26
Cz–AiBAEP typically is displayed so that positivity at the vertex
relative to the stimulated ear is displayed as an upward deflection
Upward-pointing peaks are labeled with Roman numerals
Downward-pointing peaks are labeled with the suffix N according to
the peak that they follow
27.
BAEP waveform
27
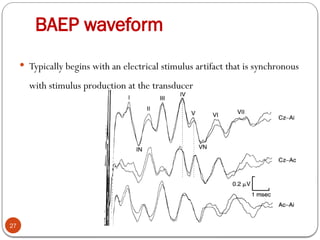
Typicallybegins with an electrical stimulus artifact that is synchronous
with stimulus production at the transducer
28.
Reducing the StimulusArtifact
28
May overlap with wave I and impair the identification and measurement
Using shielded headphones and headphones with piezoelectric
transducers instead of voice coil transducers
Transducers that are connected to an ear insert by flexible plastic
tubing several centimeters in length
29.
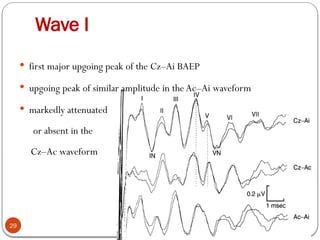
Wave I
29
firstmajor upgoing peak of the Cz–Ai BAEP
upgoing peak of similar amplitude in the Ac–Ai waveform
markedly attenuated
or absent in the
Cz–Ac waveform
30.
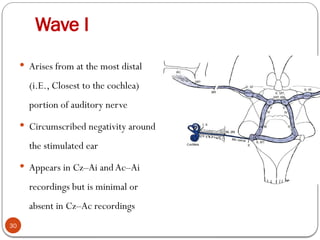
Wave I
30
Arisesfrom at the most distal
(i.E., Closest to the cochlea)
portion of auditory nerve
Circumscribed negativity around
the stimulated ear
Appears in Cz–Ai and Ac–Ai
recordings but is minimal or
absent in Cz–Ac recordings
31.
Cochlear microphonic VsWave I
31
Visible as a separate peak preceding wave I, especially if the stimulus
artifact is small
Distinguished by reversing the stimulus polarity, which will reverse
the polarity of the cochlear microphonic;Wave I may show a latency
shift, but will not reverse polarity
32.
Bifid wave I
32
Represents contributions to wave I from different portions of the
cochlea
Earlier of the two peaks, which reflects activation of the base of the
cochlea, corresponds to the single wave I that is typically present in
the Cz–Ai waveform
Reversal of stimulus polarity can be used to distinguish a bifid wave I
from a cochlear microphonic followed by (a single) wave I
33.
Techniques to obtaina clearer wave I
33
Electrode within the external auditory canal
Ac–Ai recording channel can yield a somewhat larger and clearer wave
I than that in the standard Cz–Ai recording
Reduction in the stimulus repetition rate
Increasing the stimulus intensity
34.
Wave IN
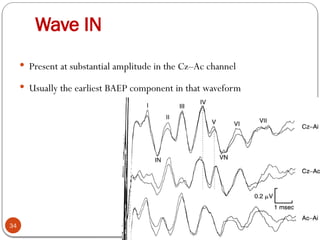
34
Presentat substantial amplitude in the Cz–Ac channel
Usually the earliest BAEP component in that waveform
35.
Wave IN
35
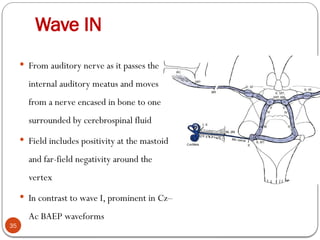
Fromauditory nerve as it passes the
internal auditory meatus and moves
from a nerve encased in bone to one
surrounded by cerebrospinal fluid
Field includes positivity at the mastoid
and far-field negativity around the
vertex
In contrast to wave I, prominent in Cz–
Ac BAEP waveforms
36.
Wave II
36
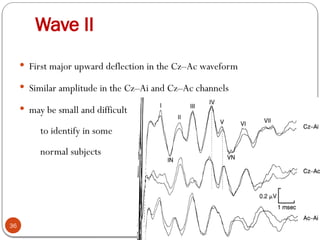
Firstmajor upward deflection in the Cz–Ac waveform
Similar amplitude in the Cz–Ai and Cz–Ac channels
may be small and difficult
to identify in some
normal subjects
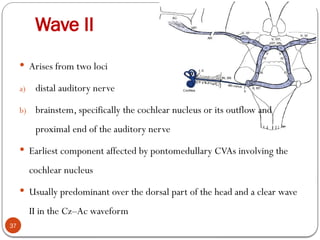
37.
Wave II
37
Arisesfrom two loci
a) distal auditory nerve
b) brainstem, specifically the cochlear nucleus or its outflow and
proximal end of the auditory nerve
Earliest component affected by pontomedullary CVAs involving the
cochlear nucleus
Usually predominant over the dorsal part of the head and a clear wave
II in the Cz–Ac waveform
38.
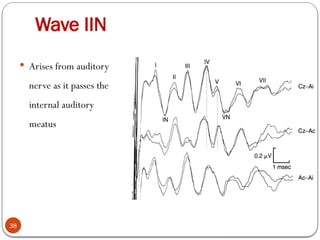
Wave IIN
38
Arisesfrom auditory
nerve as it passes the
internal auditory
meatus
39.
wave III
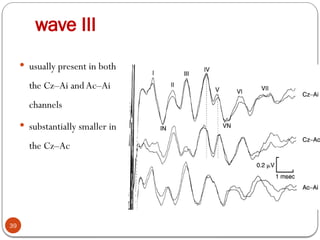
39
usuallypresent in both
the Cz–Ai and Ac–Ai
channels
substantially smaller in
the Cz–Ac
40.
Wave III
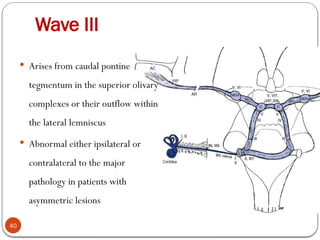
40
Arisesfrom caudal pontine
tegmentum in the superior olivary
complexes or their outflow within
the lateral lemniscus
Abnormal either ipsilateral or
contralateral to the major
pathology in patients with
asymmetric lesions
41.
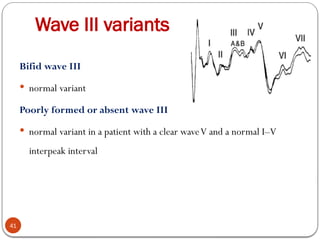
Wave III variants
41
Bifidwave III
normal variant
Poorly formed or absent wave III
normal variant in a patient with a clear waveV and a normal I–V
interpeak interval
42.
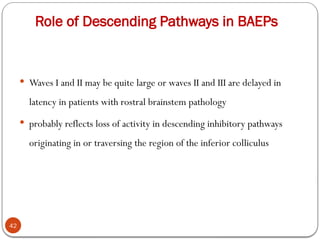
Role of DescendingPathways in BAEPs
42
Waves I and II may be quite large or waves II and III are delayed in
latency in patients with rostral brainstem pathology
probably reflects loss of activity in descending inhibitory pathways
originating in or traversing the region of the inferior colliculus
43.
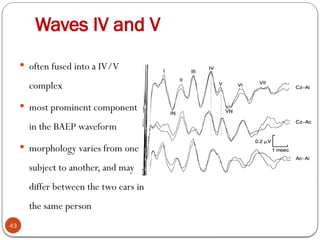
Waves IV andV
43
often fused into a IV/V
complex
most prominent component
in the BAEP waveform
morphology varies from one
subject to another, and may
differ between the two ears in
the same person
44.
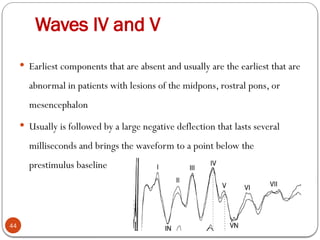
Waves IV andV
44
Earliest components that are absent and usually are the earliest that are
abnormal in patients with lesions of the midpons, rostral pons, or
mesencephalon
Usually is followed by a large negative deflection that lasts several
milliseconds and brings the waveform to a point below the
prestimulus baseline
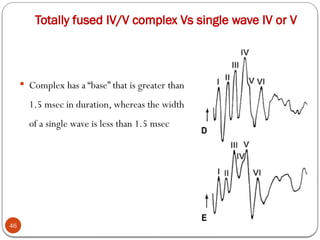
Totally fused IV/Vcomplex Vs single wave IV or V
46
Complex has a “base” that is greater than
1.5 msec in duration, whereas the width
of a single wave is less than 1.5 msec
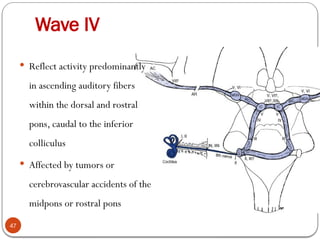
47.
Wave IV
47
Reflectactivity predominantly
in ascending auditory fibers
within the dorsal and rostral
pons, caudal to the inferior
colliculus
Affected by tumors or
cerebrovascular accidents of the
midpons or rostral pons
48.
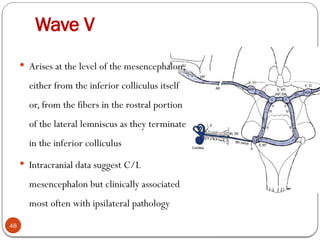
Wave V
48
Arisesat the level of the mesencephalon,
either from the inferior colliculus itself
or, from the fibers in the rostral portion
of the lateral lemniscus as they terminate
in the inferior colliculus
Intracranial data suggest C/L
mesencephalon but clinically associated
most often with ipsilateral pathology
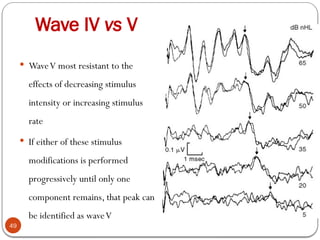
49.
Wave IV vsV
49
WaveV most resistant to the
effects of decreasing stimulus
intensity or increasing stimulus
rate
If either of these stimulus
modifications is performed
progressively until only one
component remains, that peak can
be identified as waveV
50.
Wave V identification
50
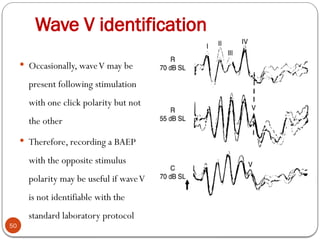
Occasionally, waveV may be
present following stimulation
with one click polarity but not
the other
Therefore, recording a BAEP
with the opposite stimulus
polarity may be useful if waveV
is not identifiable with the
standard laboratory protocol
51.
Differential affection ofwaves IV and V
51
Multilevel demyelination
Brainstem infarct
Small brainstem hemorrhage in the lateral lemniscus
52.
Wave VN
52
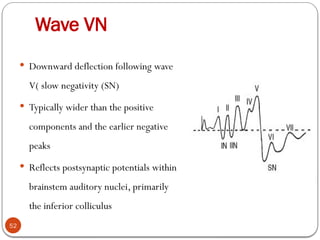
Downwarddeflection following wave
V( slow negativity (SN)
Typically wider than the positive
components and the earlier negative
peaks
Reflects postsynaptic potentials within
brainstem auditory nuclei, primarily
the inferior colliculus
53.
Wave VI
53
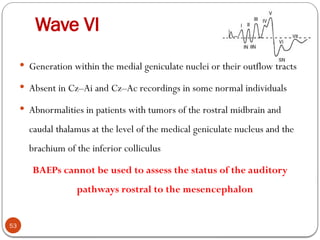
Generationwithin the medial geniculate nuclei or their outflow tracts
Absent in Cz–Ai and Cz–Ac recordings in some normal individuals
Abnormalities in patients with tumors of the rostral midbrain and
caudal thalamus at the level of the medical geniculate nucleus and the
brachium of the inferior colliculus
BAEPs cannot be used to assess the status of the auditory
pathways rostral to the mesencephalon
54.
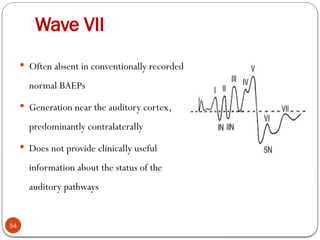
Wave VII
54
Oftenabsent in conventionally recorded
normal BAEPs
Generation near the auditory cortex,
predominantly contralaterally
Does not provide clinically useful
information about the status of the
auditory pathways
55.
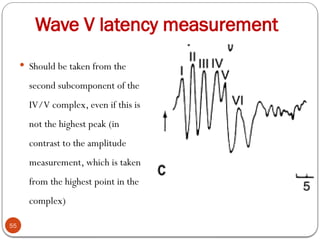
Wave V latencymeasurement
55
Should be taken from the
second subcomponent of the
IV/V complex, even if this is
not the highest peak (in
contrast to the amplitude
measurement, which is taken
from the highest point in the
complex)
56.
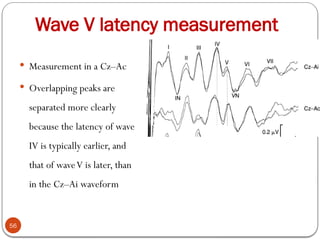
Wave V latencymeasurement
56
Measurement in a Cz–Ac
Overlapping peaks are
separated more clearly
because the latency of wave
IV is typically earlier, and
that of waveV is later, than
in the Cz–Ai waveform
57.
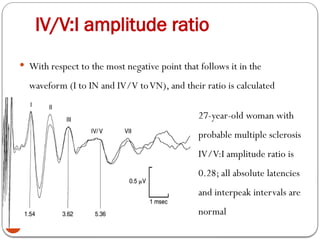
IV/V:I amplitude ratio
57
With respect to the most negative point that follows it in the
waveform (I to IN and IV/V toVN), and their ratio is calculated
27-year-old woman with
probable multiple sclerosis
IV/V:I amplitude ratio is
0.28; all absolute latencies
and interpeak intervals are
normal
58.
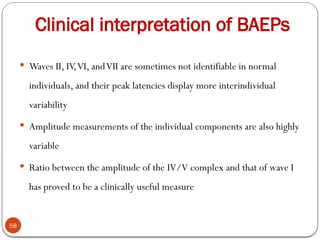
Clinical interpretation ofBAEPs
58
Waves II, IV,VI, andVII are sometimes not identifiable in normal
individuals, and their peak latencies display more interindividual
variability
Amplitude measurements of the individual components are also highly
variable
Ratio between the amplitude of the IV/V complex and that of wave I
has proved to be a clinically useful measure
59.
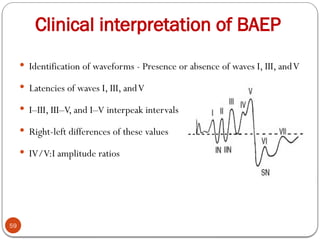
Clinical interpretation ofBAEP
59
Identification of waveforms - Presence or absence of waves I, III, andV
Latencies of waves I, III, andV
I–III, III–V, and I–V interpeak intervals
Right-left differences of these values
IV/V:I amplitude ratios
60.
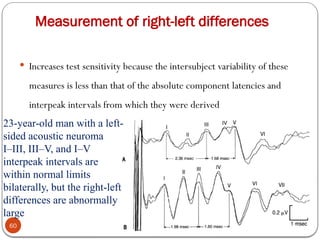
Measurement of right-leftdifferences
60
Increases test sensitivity because the intersubject variability of these
measures is less than that of the absolute component latencies and
interpeak intervals from which they were derived
23-year-old man with a left-
sided acoustic neuroma
I–III, III–V, and I–V
interpeak intervals are
within normal limits
bilaterally, but the right-left
differences are abnormally
large
61.
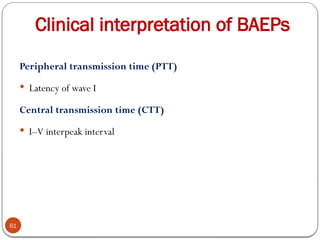
Clinical interpretation ofBAEPs
61
Peripheral transmission time (PTT)
Latency of wave I
Central transmission time (CTT)
I–V interpeak interval
62.
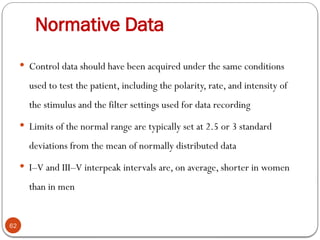
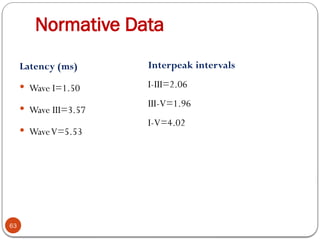
Normative Data
62
Controldata should have been acquired under the same conditions
used to test the patient, including the polarity, rate, and intensity of
the stimulus and the filter settings used for data recording
Limits of the normal range are typically set at 2.5 or 3 standard
deviations from the mean of normally distributed data
I–V and III–V interpeak intervals are, on average, shorter in women
than in men
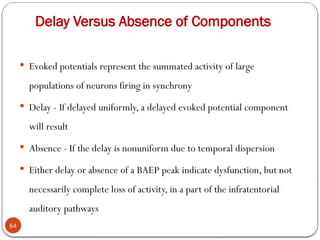
Delay Versus Absenceof Components
64
Evoked potentials represent the summated activity of large
populations of neurons firing in synchrony
Delay - If delayed uniformly, a delayed evoked potential component
will result
Absence - If the delay is nonuniform due to temporal dispersion
Either delay or absence of a BAEP peak indicate dysfunction, but not
necessarily complete loss of activity, in a part of the infratentorial
auditory pathways
65.
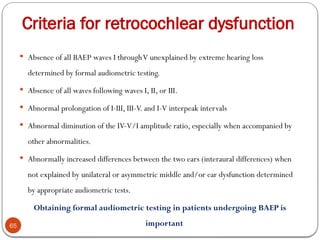
Criteria for retrocochleardysfunction
65
Absence of all BAEP waves I throughV unexplained by extreme hearing loss
determined by formal audiometric testing.
Absence of all waves following waves I, II, or III.
Abnormal prolongation of I-III, III-V. and I-V interpeak intervals
Abnormal diminution of the IV-V/I amplitude ratio, especially when accompanied by
other abnormalities.
Abnormally increased differences between the two ears (interaural differences) when
not explained by unilateral or asymmetric middle and/or ear dysfunction determined
by appropriate audiometric tests.
Obtaining formal audiometric testing in patients undergoing BAEP is
important
66.
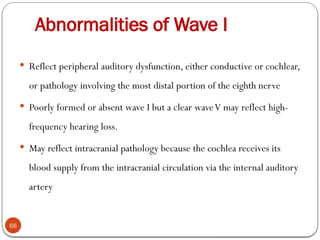
Abnormalities of WaveI
66
Reflect peripheral auditory dysfunction, either conductive or cochlear,
or pathology involving the most distal portion of the eighth nerve
Poorly formed or absent wave I but a clear waveV may reflect high-
frequency hearing loss.
May reflect intracranial pathology because the cochlea receives its
blood supply from the intracranial circulation via the internal auditory
artery
67.
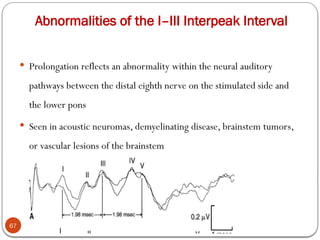
Abnormalities of theI–III Interpeak Interval
67
Prolongation reflects an abnormality within the neural auditory
pathways between the distal eighth nerve on the stimulated side and
the lower pons
Seen in acoustic neuromas, demyelinating disease, brainstem tumors,
or vascular lesions of the brainstem
68.
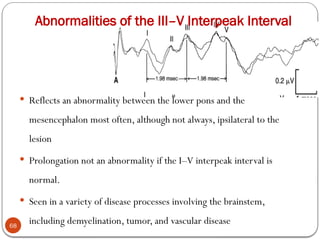
Abnormalities of theIII–V Interpeak Interval
68
Reflects an abnormality between the lower pons and the
mesencephalon most often, although not always, ipsilateral to the
lesion
Prolongation not an abnormality if the I–V interpeak interval is
normal.
Seen in a variety of disease processes involving the brainstem,
including demyelination, tumor, and vascular disease
69.
Abnormalities of theIV/V:I Amplitude Ratio
69
Reflects dysfunction within the auditory pathways between the distal
eighth nerve and the mesencephalon
False increase in ratio in
Decreasing the stimulus intensity
Suboptimal placement of theAi recording electrode (may decrease the
amplitude of wave I )
70.
BAEPs and HearingLoss
70
can detect subtle neuronal dysfunction that is not clinically apparent
on the neurologic and audiologic examination
Relatively insensitive to isolated low-frequency hearing losses
71.
BAEPs and HearingLoss
71
Central pattern
CTT (I–V interpeak interval) is prolonged
Peripheral pattern
Wave I is delayed
A single waveform may contain both abnormalities
72.
Classification of HearingLoss
72
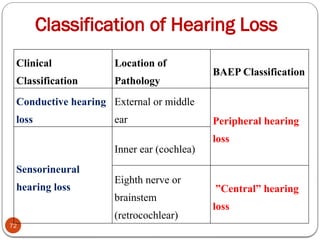
Clinical
Classification
Location of
Pathology
BAEP Classification
Conductive hearing
loss
External or middle
ear Peripheral hearing
loss
Sensorineural
hearing loss
Inner ear (cochlea)
Eighth nerve or
brainstem
(retrocochlear)
”Central” hearing
loss
73.
Latency–intensity curves
73
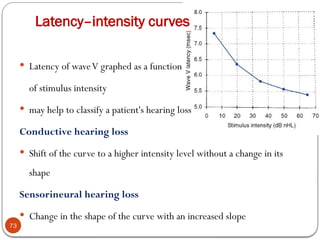
Latencyof waveV graphed as a function
of stimulus intensity
may help to classify a patient's hearing loss
Conductive hearing loss
Shift of the curve to a higher intensity level without a change in its
shape
Sensorineural hearing loss
Change in the shape of the curve with an increased slope
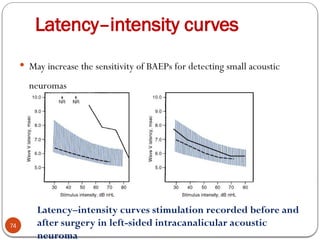
74.
Latency–intensity curves
74
Mayincrease the sensitivity of BAEPs for detecting small acoustic
neuromas
Latency–intensity curves stimulation recorded before and
after surgery in left-sided intracanalicular acoustic
neuroma
75.
BAEPs abnormal butnormal hearing
75
Unilateral brainstem lesions because the ascending projections from
each ear are bilateral
Lesions of subsystem involved in sound localization sparing other
portions of the brainstem auditory pathways
Absence of a component may reflect temporal dispersion rather than
conduction block, so hearing may even be present when there is no
identifiable waveV
76.
BAEPs and functionalhearing loss
76
Abnormal BAEP study demonstrates the existence of pathology within
the auditory system
Normal study does not prove that the symptoms are psychogenic
If they maintain a degree of tension in their cranial and neck muscles,
the EMG activity picked up by the recording electrodes may be
sufficient to prevent recording of an interpretable BAEP study
77.
BAEP in AcousticNeuroma
77
Abnormal BAEPs in more than 95 % with acoustic neuromas
Abnormal BAEPs is less in patients with small (less than 1 cm) tumors
Small, intracanalicular tumors in whom BAEPs to standard high-
intensity stimuli are normal, latency–intensity studies may reveal
abnormal cochlear function resulting from compression of the internal
auditory artery
78.
BAEP in AcousticNeuroma
78
Typically originate from the distal vestibular nerve at the vestibular
ganglion, and the auditory portion of the nerve may be unaffected
early in the course of the disease.
↓ As it enlarges, compress the auditory nerve
Prolongation of the I–III interpeak interval
↓
Complete eradication of wave III and subsequent BAEP components
79.
BAEP in AcousticNeuroma
79
Wave II may be relatively spared, a reflection of the contribution to
that component originating in the distal eighth nerve
Wave I may become delayed as the degree of cochlear ischemia
increases
80.
BAEP in LargeAcoustic Neuroma
80
Infarction of the cochlea may cause elimination of all BAEPs
Prolongation of the III–V interpeak interval in response to stimulation
of the ear contralateral to the tumor due to compression of brainstem
81.
BAEP in LargeAcoustic Neuroma
81
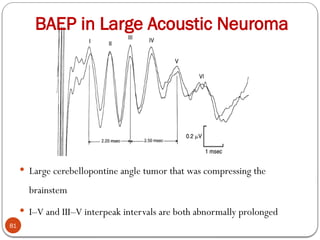
Large cerebellopontine angle tumor that was compressing the
brainstem
I–V and III–V interpeak intervals are both abnormally prolonged
82.
BAEP in OtherPosterior Fossa Tumors
82
Almost always abnormal in brainstem gliomas and other intrinsic
brainstem tumors except that within the medulla
Abnormalities in the I–III or III–V interpeak interval, or a
combination of both
Serial recordings may show deterioration of the BAEPs because of
tumor growth
Response to treatment can be demonstrated as an improvement in
conduction within the brainstem auditory pathways
83.
BAEP in CerebrovascularDisease
83
Usually normal in medullary infarcts or lesions confined to the basis
pontis, cerebral peduncles, and cerebellar hemispheres
Presence of BAEP abnormalities is associated with an adverse clinical
outcome
Abnormalities in the I–III or III–V interpeak interval, or a
combination of both, may be seen
If a cochlear stroke accompanies the brainstem stroke, all BAEP
components will be absent following stimulation of that ear
84.
BAEP in vertebrobasilarTIA
84
Abnormalities present in most cases
Findings tend to resolve over time
Yield lower if recorded after more than a week
Persistent BAEP changes may represent small infarcts that are
clinically silent
85.
BAEP in DemyelinatingDisease
85
Can demonstrate a residual abnormality related to a prior symptom
that has cleared
Abnormality rate higher in definite MS and with brainstem lesion.
Abnormalities in the I–III and/or III–V interpeak interval
Abnormally small IV/V:I amplitude ratio in the presence of normal
component latencies and interpeak intervals
Prolongations of the PTT (wave I latency) without any otologic cause
86.
BAEP in MS
86
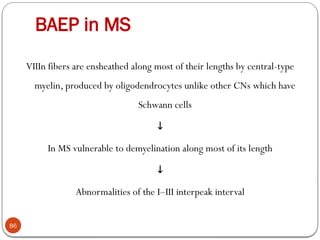
VIIInfibers are ensheathed along most of their lengths by central-type
myelin, produced by oligodendrocytes unlike other CNs which have
Schwann cells
↓
In MS vulnerable to demyelination along most of its length
↓
Abnormalities of the I–III interpeak interval
87.
BAEP in Coma
87
Markedly abnormal BAEPs are likely to have poor neurologic
outcomes attributable to the brainstem damage
Typically normal in patients with coma caused entirely by
supratentorial disease
May deteriorate subsequently because of transtentorial herniation
Abnormal BAEPs in patients with supratentorial infarctions or
hemorrhages are correlated with poor clinical outcomes
88.
BAEP in Coma
88
Normal-appearing BAEPs in a patient whose examination shows
widespread brainstem dysfunction should prompt suspicion of a
metabolic etiology such as a drug overdose
BAEPs are highly resistant to central nervous system depressant drugs
89.
BAEP in drugoverdose
89
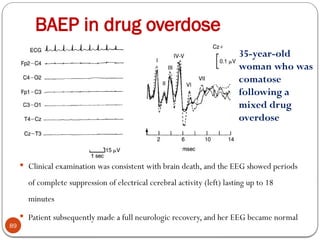
Clinical examination was consistent with brain death, and the EEG showed periods
of complete suppression of electrical cerebral activity (left) lasting up to 18
minutes
Patient subsequently made a full neurologic recovery, and her EEG became normal
35-year-old
woman who was
comatose
following a
mixed drug
overdose
90.
BAEP in Locked-insyndrome
90
BAEPs may be either normal or abnormal, depending on the extent to
which the lesion extends outside the ventral pons and involves the
auditory pathways
91.
BAEP in braindeath
91
Contains no identifiable components, or consists of wave I alone, or
contains only a wave I followed by a wave IN
Rarely, waves II and IIN may also be present and reflect the
contribution to these components from the auditory nerve
Although consistent with brain death, negative BAEP cannot be used
as evidence that the brainstem is nonfunctional
92.
Intra operative BAEPmonitoring
92
esp during surgery in the cerebellopontine angle with the goal of
preserving auditory nerve function
bulky earphone replaced by a small insertable earphone
faster stimulation rate typically about 30 Hz compared with 10 Hz
which allows more rapid signal acquisition
Stable, robust BAEPs are recorded readily in the presence of general
anesthetic agents
93.
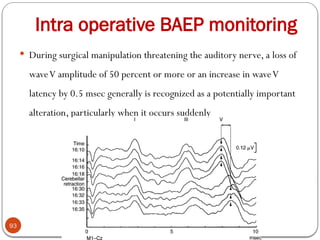
Intra operative BAEPmonitoring
93
During surgical manipulation threatening the auditory nerve, a loss of
waveV amplitude of 50 percent or more or an increase in waveV
latency by 0.5 msec generally is recognized as a potentially important
alteration, particularly when it occurs suddenly
94.
BAEPs in infantsand children
94
To detect and measure hearing loss in children who cannot be tested
behaviorally
To evaluate the auditory brainstem pathways in children who may have
neurologic problems
Requires close cooperation between audiologists and neurologists
because it is impossible to interpret these responses correctly without
paying careful attention to both the ear and the brain.