Downloaded 1,152 times
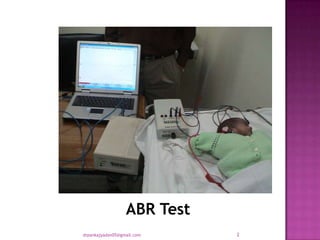

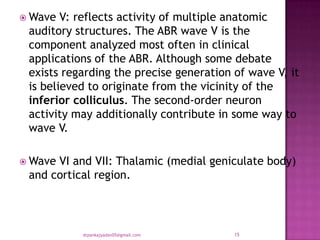
![ ABR audiometry refers to an evoked potential generated
by a brief click or tone pip transmitted from an acoustic
transducer in the form of an insert earphone or
headphone. The elicited waveform response is
measured by surface electrodes typically placed at the
vertex of the scalp and ear lobes.
The amplitude (microvoltage) of the signal is averaged
and charted against the time (millisecond), much like
an EEG.
The waveform peaks are labeled I-VII.
These waveforms normally occur within a 10-millisecond
time period after a click stimulus presented at high
intensities (70-90 dB normal hearing level [nHL]).
7drpankajyadav05@gmail.com](https://image.slidesharecdn.com/bera-130618101512-phpapp01/85/Auditory-brainstem-response-ABR-7-320.jpg)


The document discusses auditory brainstem response (ABR) testing, which is used to evaluate hearing in newborns. ABR testing uses electrodes to measure electrical activity in the brainstem in response to auditory clicks or tones. It is an effective screening tool for detecting hearing loss, with a high sensitivity and specificity. ABR testing can identify abnormalities in the auditory nerve or brainstem that may indicate conditions like acoustic neuromas. It provides objective information about hearing thresholds and neural conduction in the auditory pathway.