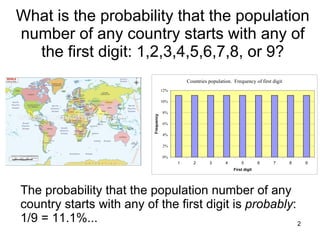
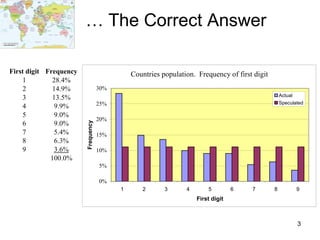
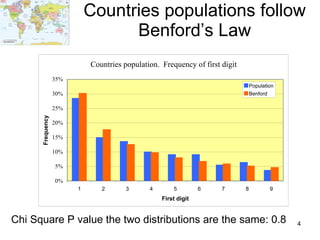
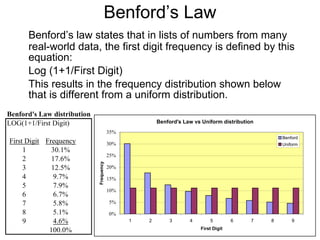
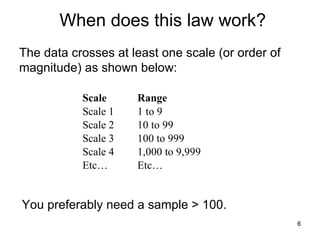
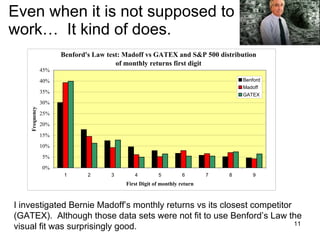
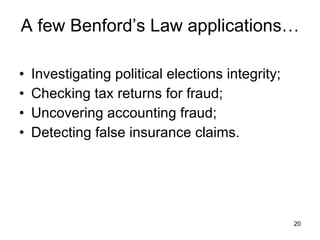
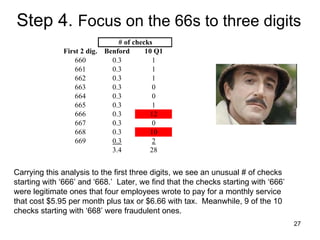
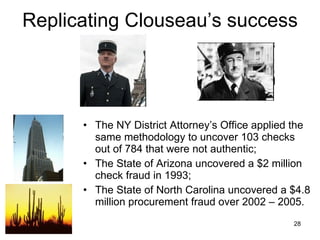
Benford's law states that in many real-world data sets, the distribution of first digits is not uniform, but rather follows a specific logarithmic pattern. This document discusses how Benford's law can be applied to detect anomalies and potential fraud in data sets involving areas like political elections, tax returns, insurance claims, and financial records. Specific examples are given showing how analyzing deviations from Benford's law helped uncover cases of electoral fraud, accounting fraud, and check fraud involving millions of dollars. The key is that Benford's law helps identify unexpected patterns within data that are worth further investigation for potential fraudulent activities.
These are the slides for a 5-minute lightning talk at the Bloomberg Quant Seminar on September 6, 2016. The talk provided a brief introduction to Benford's Law and its use in fraud detection to an audience of quantitative finance professionals.
Using Benford's Law for Fraud Detection and AuditingCaseWare IDEA
Ā
This presentation will explain the theory behind Benford's law and how it can be used to find errors or potential fraud .
SLIDESHARE: www.slideshare.net/CaseWare_Analytics
WEBSITE: www.casewareanalytics.com
BLOG: www.casewareanalytics.com/blog
TWITTER: www.twitter.com/CW_Analytic
Using Benfordās Law for Fraud Detection & Auditing
Referred to as the First-Digit Law, Benfordās Law is a mathematical theory conceived over 70 years ago that has aided numerous anti-fraud professionals in solving embezzlement, insurance claims and money laundering cases. Benford's Law gives the expected patterns of the digits in unaltered data, and explains there is a large bias towards the lower digits, so much so that nearly one-half of all numbers are expected to start with the digits 1 or 2.
In this webinar, we will explain the theory behind the law and how it can be used to find potential fraud and errors to help turn your internal audit or fraud investigation into a revenue generating center.
In this session, you will learn:
ā¢ How to apply Benfordās law analysis to find outliers in processes such as cash disbursement, general ledger, insurance claims, tax assessments, etc.
ā¢ The types of data that do and do not conform to Benfordās Law
ā¢ A practical guide to apply Benfordās tests using IDEA software (1st digit, 2nd digit testing, advanced analytics ā fuzzy logic, etc.)
Benford's Law: How to Use it to Detect Fraud in Financial DataFraudBusters
Ā
Webinar series from FraudResourceNet LLC on Preventing and Detecting Fraud Using Data Analytics. Recordings of these Webinars are available for purchase from our Website fraudresourcenet.com
This Webinar focused on fraud detection using data analytic software (Excel, ACL, IDEA)
FraudResourceNet (FRN) is the only searchable portal of practical, expert fraud prevention, detection and audit information on the Web.
FRN combines the high quality, authoritative anti-fraud and audit content from the leading providers, AuditNet Ā® LLC and White-Collar Crime 101 LLC/FraudAware.
The two entities designed FRN as the āgo-toā, easy-to-use source of āhow-toā fraud prevention, detection, audit and investigation templates, guidelines, policies, training programs (recorded no CPE and live with CPE) and articles from leading subject matter experts.
FRN is a continuously expanding and improving resource, offering auditors, fraud examiners, controllers, investigators and accountants a content-rich source of cutting-edge anti-fraud tools and techniques they will want to refer to again and again.
LVA 6.50 is a security level voice analysis technology, adapted to meet the needs and expected emotional scenarios encountered in security use, such as formal police investigations, security clearances, secured area access control, intelligence source questioning, hostage negotiation, and more.
Brain Fingerprinting is scientific technique to determine whether or not specific information is stored in an individual's brain.
Ruled Admissible in one US Court as scientific evidence.
It has a record of 100% Accuracy.
In this new Accenture Finance & Risk presentation we explore machine learning as a solution to some of the most important challenges faced by the banking sector today. To learn more, read our blog on Machine Learning in Banking: https://accntu.re/2oTVJiX
process of report writing and submission to the court
This ppt will help forensic students
A forensic report means a report prepared in the course of an investigation into an alleged offense by a person with specialized knowledge or training, setting out the results of a forensic examination in the form of facts or opinions or a combination of both e.g. an autopsy report.
Brain fingerprinting is based on finding that the brain generates a unique brain wave pattern when a person encounters a familiar stimulus use of functional magnetic resonance imaging in lie detection derives from studies suggesting that persons asked to lie show different patterns of brain activity than they do being truthful. Issue related to the use of such evidence in courtsare discussed.The author concludes that neither approach is currently supported by enough data regarding its accuracy in detecting deception to warrant use in court. In the field of criminology a new lie detector has been developed in USA. This is called āBRAIN FINGERPRINTINGā.The invention is supposed to be the best lie detector even smooth criminals who paas the polygraph Test with ease.The new method employs brainwaves ,which are useful in detecting whether the person is subjected to test remember finer details of crime,even if the person willingly suppressesthe necessary information,the brain wave is sure to trap him ,according to the experts who are very excited about the new kid on the block.
This is a presentation intended to give basic training for counterfeit currency. Most of the content has been obtained from the Secret Service website.
Presentation on Financial Crimes. Money is one of the most important reasons behind all forms of crime whether Cyber or Internet crimes, Physical or Theft crimes. With the advancement of technology the crime has not decelerated but only esteemed and many more new techniques were by people and they were popularly called as Blackhat hackers. In this presentations we give an over view of the whole scenario.
Modelling Conformity of Nigeriaās Recent Population Censuses With Benfordās D...inventionjournals
Ā
ABSTRACT : Benford's distribution, a probability distribution which was discovered at the twilight of the 19th century, can be used as a robust tool in exposing error and/or fraud in random data in various scenarios. Because of the massive political leveraging involved in population census results in Nigeria, the census exercise has been open to manipulation and distortion. In this paper, we analyze the distribution of the first significant digits of the 1991 and 2006 Nigerian population censuses to establish conformity with Benford's distribution. We also analyze the aggregate census data for the six geo-political zones of the country to determine the level of dispersion of the distribution of first digits of the census counts. Our analyses showed that the North-West region had the highest dispersion for both the 1991 and 2006 census (and by extension, the highest level of non-conformity with Benfordās law) while the North-East and South-West had the lowest dispersion for the 1991 and 2006 censuses, respectively.
In the Wizard of Oz, Toto pulls back the green curtain to expose that the Wizard of Oz is a fraud. We can peep behind the 'green curtain' of the data visualisation to learn how to 'poke holes' in the data that you are given, both in business and in everyday news headlines.
In order to explode the myths in the data that surrounds us every day, it is a little known secret that there are hidden patterns in the data chaos that surrounds us. Deviations from these patterns highlight invention, bias, anomalies and even deliberate fraud.
You can use both R and Power BI data visualisation combined with timeless data analysis and patterns such as Benford's Law to reveal or conceal efforts to distort the numbers, and question the veracity of the data.
You'll need courage, heart and wisdom to analyse data, since truthful data doesn't necessarily give easy answers!
Cartel detection and collusion screening: an empirical analysis of the London...Dr Danilo SamĆ
Ā
Cartel detection and collusion screening: an empirical analysis of the London Metal Exchange
Author:
Dr Danilo SamĆ (LUISS āGuido Carliā University, Law & Economics LAB)
Abstract:
In order to fight collusive behaviors, the best scenario for competition authorities would be the possibility to analyze detailed information on firmsā costs and prices, being the price-cost margin a robust indicator of market power. However, information on firmsā costs is rarely available. In this context, a fascinating technique to detect data manipulation and rigged prices is offered by an odd phenomenon called Benfordās law, otherwise known as First-digit law, which has been successfully employed to discover the āLibor scandalā much time before the opening of the cartel settlement procedure. Thus, the main objective of the present paper is to apply a such useful instrument to track the price of the aluminium traded on the London Metal Exchange, following the allegations according to which there would be an aluminium cartel behind. As a result, quick tests such as Benfordās law can only be helpful to inspect markets where price patterns show signs of collusion. Given the budget constraints to which antitrust watchdogs are commonly subject to, a such price screen could be set up, just exploiting the data available, as warning system to identify cases that require further investigations.
Keywords:
Benfordās law, cartel detection, collusion screening, competition authorities, data manipulation, monopolization, oligopolistic markets, price fixing, variance screen
JEL classification:
C10; D40; L13; L41
Year:
2014
Pages:
1-18
Citation:
SamĆ , Danilo (2014), Cartel detection and collusion screening: an empirical analysis of the London Metal Exchange, Law & Economics LAB, LUISS āGuido Carliā University, Rome, Italy, pp. 1-18.
Homework #1SOCY 3115Spring 20Read the Syllabus and FAQ on ho.docxpooleavelina
Ā
Homework #1
SOCY 3115
Spring 20
Read the Syllabus and FAQ on how to do your homework before beginning the assignment!
To get consideration for full credit, you must:
Ā· Follow directions;
Ā· Show all work required to arrive at answer (statistical calculations often require multiple steps, so you need to write these down, not just skip to the final answer)
Ā· Use appropriate statistical notation at all times (e.g. if you are calculating a population mean, begin with the equation for population mean)
Ā· Use units in your answer, where appropriate (e.g. a mean time would be ā6.5 hoursā rather than just ā6.5ā)
Understanding the Structure of Data
1. For the following rectangular dataset:
Id
Highest degree
Works full-time
Annual income cat
1
Did not grad HS
Yes
Low
2
HS dip
Yes
Low
3
HS dip
No
Med
4
BA
No
Low
5
BA
Yes
Med
6
MA
Yes
High
7
HS dip
Yes
Med
a. What is the unit-of-analysis of the dataset?
b. How many variables are in the dataset?
c. How many observations/cases are in the dataset?
d. For eachvariable that is not named āidā:
i. What is the variable name?
ii. What is the level-of-measurement?
iii. What are the values for the variable?
iv. If you had to make a guess, what do you think the āquestionā was that was asked of the unit-of-analysis to get these data? (for example, if we had a continuous variable called ānum_petsā the question might be āHow many pets live in your household?ā)
2. For the following rectangular dataset:
Id
num_bdrms
num_bthrms
sqft
Ranch
1
4
3
3200
Yes
2
2
1.5
2800
Yes
3
2
1
1200
Yes
4
3
2
1500
No
5
2
2
1100
No
a. What is the unit-of-analysis of the dataset?
b. How many variables are in the dataset?
c. How many observations/cases are in the dataset?
d. For each variable that is not named āidā:
i. What is the variable name?
ii. What is the level-of-measurement? Before answering, be sure to consult the slide called āLevel of measurement ā language to useā. Use the formal language!
iii. What are the values for the variable?
iv. If you had to make a guess, what do you think the āquestionā was that was asked of the unit-of-analysis to get these data? (for example, if we had a continuous variable called ānum_petsā the question might be āHow many pets live in your household?ā)
3. For each of the following questions (1) construct a dataset with one variable and three observations (2) add data that could have theoretically been collected (just make up the actual responses to the question); and (3) indicate the level-of-measurement of the variable. Iāve done two examples for you.
Example#1:
What is your current age? (individual is the unit-of-analysis)
idage
1 25
2 32
3 61
The age variable is continuous/interval ratio.
Example#2:
What is the size of this hospital based on number of beds? (hospital is the unit-of-analysis)? Answers can be small (1-100 beds), medium (101-500 beds), large (501 beds to 1000 beds), extra large (1001+ beds)
idhosp_size
1 med
2 med
3 ext ...
1 Econometrics Final Exam Summer 2017 This exam i.docxhoney725342
Ā
1
Econometrics Final Exam Summer 2017
This exam is divided into five parts. Please answer all the questions
as best as you can.
Part I
1. Give an example of a multiple regression equation
2. Give an example of a quadratic regression equation
Figure 1
2
Figure 1 shows the relationship between temperature and sales.
3. What kind of graph is this?
4. What kind of relationship is there between temperature and sales?
5. If the temperature is 13ā would you expect high sales or low sales?
Part II
Figure 2
Figure 2 plots the Spending and revenue for an electronics company from 1960-2009.
1. On average would you say the company is profitable?
2. State one year when the company clearly made a profit.
3. Can you give any indication as to how the company will perform in the future?
4. Write an equation to investigate the relationship between Spending and Revenue.
https://www.google.com/url?sa=i&rct=j&q=&esrc=s&source=images&cd=&cad=rja&uact=8&ved=0ahUKEwiolbz6ndPUAhWQmbQKHZLSDXoQjRwIBw&url=http://midknightgraphs.blogspot.com/2012/01/most-important-charts-of-year-from.html&psig=AFQjCNFfWV0m5Vu8GRlrAkRv0WcszO5mxw&ust=1498281863954490
3
4
Background to Parts III and IV: Female Labor Supply
Harvard economist Claudia Goldin attributes much of the rise of professional women in the U.S.
labor force to their ability to engage in family planning after the introduction of the birth-control
pill. In developing countries early childbearing is associated with lower levels of education and
more dependency of women on their husbandās earnings.
This question examines the effect of family size on female labor supply. The data set consists of
n = 254,654 married women (aged 21 ā 35), as reported in the 1980 U.S. Census of the
Population (the data pertain to the full calendar year of 1979).
Variables in the Female Labor Supply Data Set
Variable Definition
Wifeās weeks worked No. of weeks wife worked for pay in 1979
Husbandās weeks worked No. of weeks husband worked for pay in 1979
Same sex = 1 if first two children have same sex, = 0 otherwise
2 boys = 1 if first two children are boys, = 0 otherwise
2 girls = 1 if first two children are girls, = 0 otherwise
Kids>2 = 1 if family has more than 2 children, = 0 otherwise
Boy first = 1 if first child is a boy, = 0 otherwise
Current age of mother age of mother in 1979
Age of mother at 1st birth age of mother at birth of first child
Black = 1 if black
Hispanic = 1 if Hispanic
Other race = 1 if nonwhite/nonblack/nonHispanic
5
The questions in Parts III and IV refer to Table 2.
Table 2
Child Sex Composition, Family Size, and Labor Supply
(1) (2) (3) (4) (5) (6)
Dependent variable Kids>2 Kids>2 Wifeās
weeks
worke
d
Wifeās
weeks
worke
d
Wifeās
weeks
worke
d
Husband
ā s weeks
worked
Estimation method OLS OLS OLS TSLS TSLS TSLS
Instruments Same sex 2 boys,
2 gir ...
One problem that every information security organization faces is how to accurately quantify the risks that they manage. In most cases, there is not enough information available to do this. There is now enough known about data breaches to let us draw interesting conclusions, some of which may even have implications in other areas of information security. This talk describes what we can learn from a careful analysis of the available information on data breaches, how we can extend what we learn about data breaches to other aspects of information security, and why doing this makes sense.
Luther Martin, Chief Security Architect, Voltage Security, Inc.
Luther Martin is the Chief Security Architect at Voltage Security, Inc., a vendor of encryption technology and products. He began his career in information security at the National Security Agency, where he graduated from the NSA's Cryptologic Mathematician Program in 1991, and eventually became the Technical Director of the NSA's Engineering and Physical Sciences Security Division.
After leaving the NSA, he has worked at both security consulting and product companies. Notable accomplishments during this period include creating the security code review for consulting firm Ernst & Young, running the first commercial security code review projects, and creating the public-key infrastructure technology that was used in the U.S. Postal Service's PC Postage program.
He is the author of Introduction to Identity-based Encryption, and has contributed to seven other books and over 100 articles on the topics of information security and risk management.
Sacramento's population projections for the State of California are already 1.4 million too high only 3 years into the forecast by 2023. The reason is Sacramento's unrealistic migration assumption. This analysis tests in detail how and why this projection went so wrong.
This study analyzes the temperature history of 24 American cities going back to 1895. Using a LOESS model, it forecasts prospective temperature increases over the next 40 years and out to 2100. And, it compares the 2100 forecast with the NOAA model(s). This comparison uncovers serious deficiencies within the NOAA model(s), as it does not fit the historical data well; and it does not differentiate much forecasts between various cities.
Compact Letter Display (CLD). How it worksGaetan Lion
Ā
Compact Letter Display (CLD) renders ANOVA & Tukey HSD testing a lot easier to interpret. It readily ranks and differentiate the tested variables. With CLD you can readily identify the variables that are statistically dissimilar vs. the ones that are similar.
This study compares the benefits and the funding for CalPERS pensions vs. Social Security. It also looks in more detail on the financial burden of CalPERS pensions on the Marin Municipal Water District.
This presentation includes two explanatory models to attempt to predict recessions. The first one is a logistic regression. The second one is a deep neural network (DNN). Both use the same set of independent variables: the velocity of money, inflation, the yield curve, and the stock market. As usual, the DNN fits the historical data a bit better than the simpler logistic regression. But, when it comes to testing or predicting, both models are pretty much even.
Objective:
Studying trends in US inequality along several social dimensions including education, ethnicity, percentiles, and work status. We donāt explore gender because it is not disaggregated within the mentioned data that focuses on families (fairly similar to households).
Data source:
US Government Survey of Consumer Finance (SCF) data. The SCF aggregates financial data on US families every three years. And, it discloses a time series from 1989 to 2019.
The model development two objectives are:
1) To explain home prices using demographic explanatory variables; and
2) To benchmark the accuracy of OLS regressions vs. DNN models.
For home prices, we used county level data from Zillow. For the explanatory variables, we used data from GEOFRED.
This analysis focuses on population aging, population age categories in % (age pyramids), and overall population growth. It looks at various geographic units (countries, continents, regions, World) from 1950 to the Present (2019 & 2020). And, it looks at projections out to 2100.
Africa is an outlier to the overall global aging; its population growth (historical & projected) is far faster than for other major regions.
We are going to analyze several of the major cryptocurrencies as an asset class. And, we are going to address several related questions:
Do they provide diversification benefits relative to the stock market (S&P 500)?
How do their diversification benefits compare with Goldās diversification benefit vs. the stock market?
Do cryptocurrencies provide diversification benefits when you really need itā¦ during market downturns?
Are cryptocurrencies truly ādigital Goldā? Do they behave in a similar way given that their supply is constrained (supposedly in a similar way as Gold is)?
We will test whether :
a) Sequential Deep Neural Networks (DNNs) can predict the stock market (S&P 500) better than OLS regression;
b) DNNs using smooth Rectified Linear activation functions perform better than the ones using Sigmoid (Logit) activation functions.
Can Treasury Inflation Protected Securities predict Inflation?Gaetan Lion
Ā
We look at the spread between Treasuries and TIPS to figure out how effective such observations were in predicting actual inflation several years down the road.
This analysis focuses on measures much beyond PE ratios. And, it concludes that the Stock Market is actually really cheap vs. bonds. But, it appears quite overvalued when focusing on inflation measures.
The relationship between the Stock Market and Interest RatesGaetan Lion
Ā
This is a study of the relationship between the Stock Market and Interest Rates. We review how the Stock Market has reacted when interest rates rise. We also factor the influence of other macroeconomics variables.
This is a study using historical data and forecasts of life expectancy for several countries. The data and forecasts come from the UN - Population Division. While the historical data is most interesting, the forecasts are highly optimistic as they project a linear trend way into the future. Meanwhile, those forecasts should have followed a much more realistic logarithmic curve reflecting slower increase in life expectancy as the life expectancy rises.
Will Stock Markets survive in 200 years?Gaetan Lion
Ā
This study uncovers 11 international stock markets that are already running into existing and prospective demographic and economic growth constraints. This study evaluates their respective fragile long term viability and the implications this has for the investors in such countries.
This study answers three questions:
1) Does it make a difference whether you standardize your variables before running your model or standardize the regression coefficients after you run your model?
2) Does the scale of the respective original non-standardized variables affect the resulting standardized coefficients?
3) Does using non-standardized variables vs. standardized variables have an impact when conducting regularization (Ridge Regression, LASSO)?
This analysis compares his track record vs. Manning, Montana, Marino, Brees, Favre, and Elway. At the end of this analysis, it makes extensive use of the binomial distribution to figure out how much of their respective track records are due to randomness vs. skills.
Regularization why you should avoid themGaetan Lion
Ā
Regularization models are supposed to reduce model over-fitting and improve forecasting accuracy. Very often they do just the opposite: increase model under-fitting, and decrease model forecasting accuracy. This study explains how Regularization models often fail, and how to resolve model issues with far simpler and more robust methods.
This study reviews the increasing prevalence of 3-shot points within the NBA. It also compares the record of the 5 top players in NBA history in 3-pt shots. It also considers how many good years left Curry may have.
The Roman Empire A Historical Colossus.pdfkaushalkr1407
Ā
The Roman Empire, a vast and enduring power, stands as one of history's most remarkable civilizations, leaving an indelible imprint on the world. It emerged from the Roman Republic, transitioning into an imperial powerhouse under the leadership of Augustus Caesar in 27 BCE. This transformation marked the beginning of an era defined by unprecedented territorial expansion, architectural marvels, and profound cultural influence.
The empire's roots lie in the city of Rome, founded, according to legend, by Romulus in 753 BCE. Over centuries, Rome evolved from a small settlement to a formidable republic, characterized by a complex political system with elected officials and checks on power. However, internal strife, class conflicts, and military ambitions paved the way for the end of the Republic. Julius Caesarās dictatorship and subsequent assassination in 44 BCE created a power vacuum, leading to a civil war. Octavian, later Augustus, emerged victorious, heralding the Roman Empireās birth.
Under Augustus, the empire experienced the Pax Romana, a 200-year period of relative peace and stability. Augustus reformed the military, established efficient administrative systems, and initiated grand construction projects. The empire's borders expanded, encompassing territories from Britain to Egypt and from Spain to the Euphrates. Roman legions, renowned for their discipline and engineering prowess, secured and maintained these vast territories, building roads, fortifications, and cities that facilitated control and integration.
The Roman Empireās society was hierarchical, with a rigid class system. At the top were the patricians, wealthy elites who held significant political power. Below them were the plebeians, free citizens with limited political influence, and the vast numbers of slaves who formed the backbone of the economy. The family unit was central, governed by the paterfamilias, the male head who held absolute authority.
Culturally, the Romans were eclectic, absorbing and adapting elements from the civilizations they encountered, particularly the Greeks. Roman art, literature, and philosophy reflected this synthesis, creating a rich cultural tapestry. Latin, the Roman language, became the lingua franca of the Western world, influencing numerous modern languages.
Roman architecture and engineering achievements were monumental. They perfected the arch, vault, and dome, constructing enduring structures like the Colosseum, Pantheon, and aqueducts. These engineering marvels not only showcased Roman ingenuity but also served practical purposes, from public entertainment to water supply.
Macroeconomics- Movie Location
This will be used as part of your Personal Professional Portfolio once graded.
Objective:
Prepare a presentation or a paper using research, basic comparative analysis, data organization and application of economic information. You will make an informed assessment of an economic climate outside of the United States to accomplish an entertainment industry objective.
Francesca Gottschalk - How can education support child empowerment.pptxEduSkills OECD
Ā
Francesca Gottschalk from the OECDās Centre for Educational Research and Innovation presents at the Ask an Expert Webinar: How can education support child empowerment?
How to Make a Field invisible in Odoo 17Celine George
Ā
It is possible to hide or invisible some fields in odoo. Commonly using āinvisibleā attribute in the field definition to invisible the fields. This slide will show how to make a field invisible in odoo 17.
Biological screening of herbal drugs: Introduction and Need for
Phyto-Pharmacological Screening, New Strategies for evaluating
Natural Products, In vitro evaluation techniques for Antioxidants, Antimicrobial and Anticancer drugs. In vivo evaluation techniques
for Anti-inflammatory, Antiulcer, Anticancer, Wound healing, Antidiabetic, Hepatoprotective, Cardio protective, Diuretics and
Antifertility, Toxicity studies as per OECD guidelines
A Strategic Approach: GenAI in EducationPeter Windle
Ā
Artificial Intelligence (AI) technologies such as Generative AI, Image Generators and Large Language Models have had a dramatic impact on teaching, learning and assessment over the past 18 months. The most immediate threat AI posed was to Academic Integrity with Higher Education Institutes (HEIs) focusing their efforts on combating the use of GenAI in assessment. Guidelines were developed for staff and students, policies put in place too. Innovative educators have forged paths in the use of Generative AI for teaching, learning and assessments leading to pockets of transformation springing up across HEIs, often with little or no top-down guidance, support or direction.
This Gasta posits a strategic approach to integrating AI into HEIs to prepare staff, students and the curriculum for an evolving world and workplace. We will highlight the advantages of working with these technologies beyond the realm of teaching, learning and assessment by considering prompt engineering skills, industry impact, curriculum changes, and the need for staff upskilling. In contrast, not engaging strategically with Generative AI poses risks, including falling behind peers, missed opportunities and failing to ensure our graduates remain employable. The rapid evolution of AI technologies necessitates a proactive and strategic approach if we are to remain relevant.
6. When does this law work? The data crosses at least one scale (or order of magnitude) as shown below: You preferably need a sample > 100.
7. Demographic data follows Benford Law very closely The U.S. has over 3,000 counties. All shown demographic measures follow Benfordās Law pretty closely. This very large sample renders the Chi Square Goodness of fit test very (if not excessively) rigorous.
8. NYSE Stocks volume This captures the first digit frequency of volume of over 2,000 NYSE stocks on June 21 st . The fit is excellent both visually and statistically.
9. PG&E SmartMeter test This captures 91 observations between April and July 2010 of analog vs SmartMeter kWh consumption readings. Both the visual and statistical fit are pretty good.
10. Tennis pros ATP points The number of ATP points of the first 1,600 professional tennis players follow closely Benfordās Law. Because of the large sample the associated P value is small.
11. Even when it is not supposed to workā¦ It kind of does. I investigated Bernie Madoffās monthly returns vs its closest competitor (GATEX). Although those data sets were not fit to use Benfordās Law the visual fit was surprisingly good.
12. Is Benford Law magic? Bacteria > No, a simple rule is that there are more small things than large things in the universeā¦
13. ā¦ a simple explanationā¦ The general principle is that there are more smaller observations vs larger ones. There are probably nearly twice as many 1s as there are 2s and three times as many 1s as there are 3s, etcā¦ Using such a principle throughout gives us a frequency that is close to Benfordās Law. We would need a sample > 1,000 to reach statistical significance at the 0.05 level that those two distributions are different.
14.
15. Benford vs Simple rule for first two digits When dealing with first two digits (10 ā 99), Benfordās Law and the Simple Rule have indistinguishable distributions. You would need samples > 700,000 to reach statistical significance at the 0.05 level that the two distributions are different.
16. Time series growing by 2% per period A time series growing by 2% per period over 116 periods replicates almost exactly Benfordās Law frequency distribution. This makes sense. The difference between 1 and 2 is a 100% increase vs between 2 and 3 is only a a 50% increase, etcā¦ This entails there will be a lot more 1s than other digits.
17.
18. The Ones Scaling Test Looking at tax return numbers that followed BL closely, someone used the Ones Scaling Test to see if the number of ā1sā would remain the same if multiplied by a constant. In this case, they multiplied the set of numbers by 1.01 and did that 696 times. This corresponds to multiplying the numbers progressively up to a factor of 1,000 as 1.01^696 = 1,000. As shown, across all iterations the number of 1s remained very stable around the BL predicated level of 30.1%. Source: āThe Scientist and Engineerās Guide to Digital Signal Processing. Steve Smith, PhD.
19.
20.
21. Iran Election Mahmoud Ahmadinejad's vote totals have more '2s' and fewer '1s' than expected. Roukema speculates Iranian officials replaced 1s by 2s. So, for instance, in some town where he received 1,954 votes, they would report his having received 2,954 votes. Source: Nate Silver. fivethirtyeight.com
22. Franken Vote count āā¦This hugely violates Benford's Law -- there are not nearly enough totals beginning in 1 and too many beginning in numbers like 5, 6 and 7. The odds of these anomalies having occurred by chance are greater than a quadrillion to one againstā¦ the reason this pattern emerges is because precinct sizes in Minnesota are not truly random . There is a large number of precincts in Minnesota that are designed to serve between 1,000 and 2,000 voters; since Franken won about 42 percent of the votes statewide, this leads to a relatively high number of instances where his vote totals are in the high single digits (672, 704, 588, etc.)ā Source: Nate Silver. fivethirtyeight.com Senator
24. Detecting fraud (an example). Step 1 A company issued 483 checks in 2009 Q4 that was audited and everything checked out. It also issued 522 checks in 2010 Q1. A fraud investigator notes that 09 Q4 pattern fit Benford Law very closely (P value 0.84). He notes that the fit deteriorated in 010 Q1 9 (P value 0.06).
25. Step 2. Focus on the difference As shown, the company has issued many more checks starting with the ā6ā digit than expected (60 vs 35 for BL).
26. Step 3. Focus on the 6s first two digits We have 28 checks out of 522 starting with the two digits 66 vs 3.4 expected per Benfordās Law. This calls for further investigation.
27. Step 4. Focus on the 66s to three digits Carrying this analysis to the first three digits, we see an unusual # of checks starting with ā666ā and ā668.ā Later, we find that the checks starting with ā666ā were legitimate ones that four employees wrote to pay for a monthly service that cost $5.95 per month plus tax or $6.66 with tax. Meanwhile, 9 of the 10 checks starting with ā668ā were fraudulent ones.