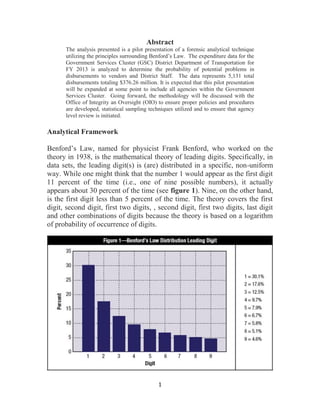
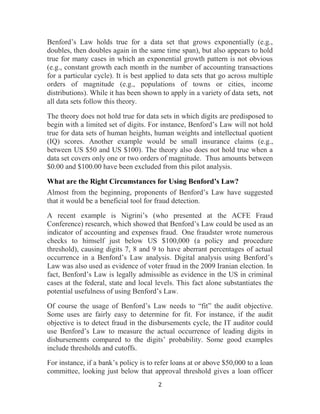
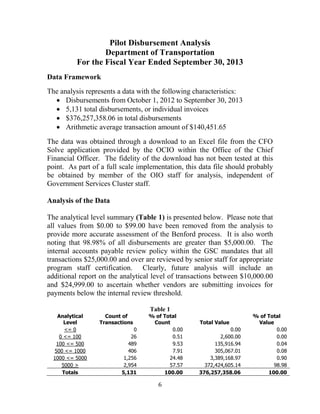
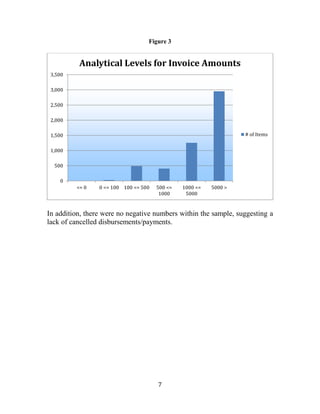
Office of the Chief
Financial Officer
Government Services Cluster and
Office of Integrity and Oversight
July 9, 2014
Utilization of Benford’s Law
Principles to Analyze Accounts
Payable Transactions
Testing the Implementation of a Fraud
Prediction and Prevention Model
George B. Dines, Jr. Associate Chief Financial Officer
1
Abstract
The analysis presented is a pilot presentation of a forensic analytical technique
utilizing the principles surrounding Benford’s Law. The expenditure data for the
Government Services Cluster (GSC) District Department of Transportation for
FY 2013 is analyzed to determine the probability of potential problems in
disbursements to vendors and District Staff. The data represents 5,131 total
disbursements totaling $376.26 million. It is expected that this pilot presentation
will be expanded at some point to include all agencies within the Government
Services Cluster. Going forward, the methodology will be discussed with the
Office of Integrity an Oversight (OIO) to ensure proper policies and procedures
are developed, statistical sampling techniques utilized and to ensure that agency
level review is initiated.
Analytical Framework
Benford’s Law, named for physicist Frank Benford, who worked on the
theory in 1938, is the mathematical theory of leading digits. Specifically, in
data sets, the leading digit(s) is (are) distributed in a specific, non-uniform
way. While one might think that the number 1 would appear as the first digit
11 percent of the time (i.e., one of nine possible numbers), it actually
appears about 30 percent of the time (see figure 1). Nine, on the other hand,
is the first digit less than 5 percent of the time. The theory covers the first
digit, second digit, first two digits, , second digit, first two digits, last digit
and other combinations of digits because the theory is based on a logarithm
of probability of occurrence of digits.
2
Benford’s Law holds true for a data set that grows exponentially (e.g.,
doubles, then doubles again in the same time span), but also appears to hold
true for many cases in which an exponential growth pattern is not obvious
(e.g., constant growth each month in the number of accounting transactions
for a particular cycle). It is best applied to data sets that go across multiple
orders of magnitude (e.g., populations of towns or cities, income
distributions). While it has been shown to apply in a variety of data sets, not
all data sets follow this theory.
The theory does not hold true for data sets in which digits are predisposed to
begin with a limited set of digits. For instance, Benford’s Law will not hold
true for data sets of human heights, human weights and intellectual quotient
(IQ) scores. Another example would be small insurance claims (e.g.,
between US $50 and US $100). The theory also does not hold true when a
data set covers only one or two orders of magnitude. Thus amounts between
$0.00 and $100.00 have been excluded from this pilot analysis.
What are the Right Circumstances for Using Benford’s Law?
Almost from the beginning, proponents of Benford’s Law have suggested
that it would be a beneficial tool for fraud detection.
A recent example is Nigrini’s (who presented at the ACFE Fraud
Conference) research, which showed that Benford’s Law could be used as an
indicator of accounting and expenses fraud. One fraudster wrote numerous
checks to himself just below US $100,000 (a policy and procedure
threshold), causing digits 7, 8 and 9 to have aberrant percentages of actual
occurrence in a Benford’s Law analysis. Digital analysis using Benford’s
Law was also used as evidence of voter fraud in the 2009 Iranian election. In
fact, Benford’s Law is legally admissible as evidence in the US in criminal
cases at the federal, state and local levels. This fact alone substantiates the
potential usefulness of using Benford’s Law.
Of course the usage of Benford’s Law needs to “fit” the audit objective.
Some uses are fairly easy to determine for fit. For instance, if the audit
objective is to detect fraud in the disbursements cycle, the IT auditor could
use Benford’s Law to measure the actual occurrence of leading digits in
disbursements compared to the digits’ probability. Some good examples
include thresholds and cutoffs.
For instance, if a bank’s policy is to refer loans at or above $50,000 to a loan
committee, looking just below that approval threshold gives a loan officer
3
the potential to discover loan frauds. If loan fraud was being perpetrated, a
Benford’s Law test of looking at either the leading digit (specifically, the 4)
or two leading digits (specifically, 49) has the potential to uncover the fraud.
Figure 2 shows what a Benford’s Law test of the leading digit might show
as a result in this particular scenario. The line is Benford’s Law probabilities
and the bars are the actual occurrences. Note that 4 is aberrantly high in
occurrence, and 5 is too low, indicating the possible manipulation of the
natural occurrence of loans beginning with 5 ($50,000 loans) possibly being
switched to just under the cutoff or indicating that the suspect could be
issuing a lot of $49,999.99 loans fictitiously to embezzle funds.
Another example might be a cutoff of $2,500 for purchases in which a
purchase order is required for any purchase at or above this price point.
Thus, a Benford’s Law test of the two leading digits (specifically, 24) could
reveal any anomalies, manipulation or fraud involving this cutoff. It is also
useful as a test of controls to see if existing controls for purchase orders are
working effectively. It is important to note that since the cutoff amount has
two key digits, a two-digit test is needed rather than a single leading digit.
Other objectives are equally applicable within the operating environment of
the District of Columbia, including analysis of:
• Credit card transactions
• Purchase orders
• Loan data ( Economic Development Cluster)
• Journal entries
• Accounts payable transactions
4
• Citizen and Vendor refunds
Within the District’s operating environment, we will work with the OIO to
determine whether to run a one-digit test or two-digit test. The two-digit test
will usually give more granular results, but is also likely to reveal more
spikes than a one-digit test.
Once the test has been run, we will determine what results deserve more
attention or whether the results provide evidence or information related to
the review objective. Generally speaking, the spikes above the Benford’s
Law line are the numbers of interest (see 4, not 5, in figure 2). The internal
review will obtain independent information on why the digit(s) spike(s).
What are the Constraints in Using Benford’s Law?
The assumptions regarding the data to be examined by Benford’s Law are:
• Numeric data
• Randomly generated numbers:
 Not restricted by maximums or
minimums, or assigned numbers
• Large sets of data
• Magnitude of orders (e.g., numbers migrate up through 10, 100, 1,000,
10,000, etc.) (Other assumptions exist that are unimportant in
applying Benford’s Law in IT audits.)
It is important to note that one assumption of Benford’s Law is that the
numbers in the large data set are randomly generated. For example, hourly
wages will have a minimum and possibly some maximum (even if a realistic
maximum) that means that the data set is not generated in a completely
random fashion, but rather uses a restricted or manipulated set of digits as
the potential leading digit. The same is true if there is a formula or structure
to the manner in which the number is generated. For example, US telephone
numbers are assigned with a specific area code and a limited number of 3-
digit prefaces to the last 4 digits (which are the only truly randomly
generated numbers in a phone number). Thus, before applying Benford’s
Law, the GSC in conjunction with the OIO will ensure that the numbers are
randomly generated without any real or artificial restriction of occurrence.
Benford’s Law should be applied only to large data sets. This includes files
with hundreds of transactions (e.g., invoices to customers, disbursements,
payments received, inventory items). It is inadvisable to use Benford’s Law
5
for small-sized data sets, as it would not be reliable in such cases. It is
recommended that the data set be 1,000 records or more, or that justification
be provided as to why a lower volume of transactions is suitable to
Benford’s Law, i.e., show that the smaller size still meets the other
constraints and that size will not affect the reliability of results. The orders
of magnitude in particular usually take hundreds of transactions. Using
fewer than 1,000 may lead to too many spikes of interest, too many false
positives.
Conclusion
The literature suggests that Benford’s Law can recognize the probabilities of
highly likely or highly unlikely frequencies of numbers in a data set. The
probabilities are based on mathematical logarithms of the occurrence of
digits in randomly generated numbers in large data sets. Those who are not
aware of this theory and intentionally manipulate numbers (e.g., in a fraud)
are susceptible to getting caught by the application of Benford’s Law.
6
Pilot Disbursement Analysis
Department of Transportation
For the Fiscal Year Ended September 30, 2013
Data Framework
The analysis represents a data with the following characteristics:
 Disbursements from October 1, 2012 to September 30, 2013
 5,131 total disbursements, or individual invoices
 $376,257,358.06 in total disbursements
 Arithmetic average transaction amount of $140,451.65
The data was obtained through a download to an Excel file from the CFO
Solve application provided by the OCIO within the Office of the Chief
Financial Officer. The fidelity of the download has not been tested at this
point. As part of a full scale implementation, this data file should probably
be obtained by member of the OIO staff for analysis, independent of
Government Services Cluster staff.
Analysis of the Data
The analytical level summary (Table 1) is presented below. Please note that
all values from $0.00 to $99.00 have been removed from the analysis to
provide more accurate assessment of the Benford process. It is also worth
noting that 98.98% of all disbursements are greater than $5,000.00. The
internal accounts payable review policy within the GSC mandates that all
transactions $25,000.00 and over are reviewed by senior staff for appropriate
program staff certification. Clearly, future analysis will include an
additional report on the analytical level of transactions between $10,000.00
and $24,999.00 to ascertain whether vendors are submitting invoices for
payments below the internal review threshold.
Table 1
Analytical
Level
Count of
Transactions
% of Total
Count Total Value
% of Total
Value
<= 0 0 0.00 0.00 0.00
0 <= 100 26 0.51 2,600.00 0.00
100 <= 500 489 9.53 135,916.94 0.04
500 <= 1000 406 7.91 305,067.01 0.08
1000 <= 5000 1,256 24.48 3,389,168.97 0.90
5000 > 2,954 57.57 372,424,605.14 98.98
Totals 5,131 100.00 376,257,358.06 100.00
7
Figure 3
In addition, there were no negative numbers within the sample, suggesting a
lack of cancelled disbursements/payments.
0
500
1,000
1,500
2,000
2,500
3,000
3,500
<= 0 0 <= 100 100 <= 500 500 <=
1000
1000 <=
5000
5000 >
Analytical Levels for Invoice Amounts
# of Items
8
Benford’s Law Analysis: First Digit Test
Figure 4
Visual inspection of the First Digit Test Graph (Figure 4) shows close
conformity to the Benford principles. The Mean Absolute Difference
(MAD), defined as how much a set of observations differ from the average,
for this analysis is 0.0051934, defined as within close conformity.
0.00000
0.05000
0.10000
0.15000
0.20000
0.25000
0.30000
0.35000
1 2 3 4 5 6 7 8 9
Proportion
Digit
First Digit Test for Invoice Amounts
Proportion
Benford Proportion
9
Benford’s Law Analysis: Second Digit Test
Figure 5
The MAD for the second digit test is 0.00789873 and is considered
“acceptable conformity” to Benford’s Law principles (Figure 5). The
preponderance of 0’s in the second number could be a result of analyzing
accounts payable transactions.
0.00000
0.02000
0.04000
0.06000
0.08000
0.10000
0.12000
0.14000
0.16000
0 1 2 3 4 5 6 7 8 9
Proportion
Digit
Second Digit Test for Invoice Amounts
Proportion
Benford Proportion
10
Benford’s Law Analysis: First 2 Digits Test
This is the first example of a test that is on the border line in terms of
acceptability. The MAD for the first 2 digits test is 0.001719408. While this
is deemed at the low end of the acceptable range, it is so close to indicating
marginally acceptable conformity, that the data outside of the Benford
Proportion bear further review. The analysis will focus on the spikes where
the first two digits of invoices are:
 25
 30
 47
 90
It is worth noting that according to the analysis, invoices starting with 90 are
almost 3 times the acceptable Benford Proportion. Invoice details for further
analysis are provided in the Appendix.
Figure 6
0
0.005
0.01
0.015
0.02
0.025
0.03
0.035
0.04
0.045
0.05
10 13 16 19 22 25 28 31 34 37 40 43 46 49 52 55 58 61 64 67 70 73 76 79 82 85 88 91 94 97
Proportion
Digit
First 2 Digits Test for Invoice Amounts
Proportion
Benford Proportion
11
Benford’s Law Analysis: Last 2 Digits Test
The last two digits test is a powerful test for number invention. The
theoretical basis of this test is the fact that the digit frequencies become
uniform as we move to the right in a number. It is suggested in the literature
that this test is not that useful for accounts payable data. That is mainly
because invoice amounts usually show that many numbers end with 00, as
we can see in Figure 7, where a huge number of the last 2 digits are at 00
(extreme left of Figure 7). These items will be excluded from review, and
will be better reviewed with the number duplication test. However, due to
the slight activity at 50, invoices that meet this 2 digit criteria will be pulled
for review. Details of these invoices are provided in the Appendix.
Figure 7
0
0.05
0.1
0.15
0.2
0.25
0.3
0 3 6 9 12 15 18 21 24 27 30 33 36 39 42 45 48 51 54 57 60 63 66 69 72 75 78 81 84 87 90 93 96 99
Proportion
Digit
Last 2 Digit Test for Invoice Amounts
Proportion
Benford Proportion
12
Benford’s Law Analysis: Number Duplication Test
Table 2 provides information on invoice payment amounts duplicated within
the distribution sampled and analyzed. For the immediate sake of the
analysis here, the invoices representing the seven (7) largest amounts will be
reviewed. Since all of the item amounts except for one are above
$25,000.00, GSC or OIO staff can perform additional tests to confirm that
our internal control process, active review of invoices greater
than$25,000.00, is actually occurring. We will also be able to review
individual vendor invoices according to this criteria.
Table 2
Count Amount Rank
Largest
Amounts
29 906.4000 1
26 100.0000 2
25 3,020.0000 3
24 30,080.0000 4 1
20 135.9000 5
19 3,751.2000 6
17 722.8000 7
12 2,500.0000 8
11 823.6000 9
11 578.2400 10
10 2,140.5800 11
10 1,750.0000 12
9 80,628.0000 13 2
9 54,370.0000 14 3
9 4,741.6700 15
9 3,000.0000 16
8 4,746.3300 17
8 2,000.0000 18
8 1,600.0000 19
8 725.1200 20
8 500.0000 21
8 450.0000 22
8 153.0000 23
8 130.0600 24
7 382,633.6200 25 4
7 33,333.3300 26 5
7 7,975.0000 27 6
6 75,000.0000 28 7
6 5,000.0000 29
6 1,500.0000 30
13
Discussion, Findings and Conclusion
The data presented from the analysis provide some limited comfort that from
a statistical perspective, there appears to not be a problem with fraudulent
disbursements. This is based upon the Benford analysis as well as internal
review of each exception payment/voucher identified. The full data set for
review is included in the Appendix to this report. The last section of the
Appendix provides a detailed table of all transactions immediately under the
$25,000.00 internal control threshold implemented by the OCFO in the
GSC. These items were also reviewed internally.
Each identified exception voucher was reviewed independently by a member
of the Accounts Payable staff. For purposes of this test, traditional audit
sampling methodology was not used to test transactions. It is possible that
by applying standard audit sampling methodology, fraudulent items could
easily be missed. For a more full scale implementation, controls would be in
place to ensure that staff performing these reviews is not covering up for
some type of fraudulent scheme. How this would work will be discussed
with OIO as we look to a implementing a full cluster implementation of this
type of testing. Significant work will be required with OIO to fully develop
and implement a comprehensive real time analysis of disbursements within
the GSC as well as other agencies with the District.
All invoices identified were reviewed internally for appropriateness. A
report of the findings is presented below.
Our internal review identified the following items of interest:
 One instance of a potential underpayment of a vendor. This item is
currently under review by Accounts Payable.
 In the “First 2 Digit Test”, we confirmed that the payments to a
temporary company with duplicate amounts represented reported time
for temporary staff that was properly approved. Specific attention
was focused on vendors receiving payment for duplicated amounts
over several months which are a fraud indicator.
 In the “Number Duplication Test”, we confirmed that payments in the
same amounts over several months are reflective of contract language
for the vendors identified the Purchase Order.
 In the “Invoices Under the $25,000 Threshold Test”, all of the
amounts reflect appropriately charged expenditures to contracts. The
14
data does not suggest that people were submitting invoices under the
agency minimum to evade detection.
It is clear that along with review of invoices, we must work with program
staff to ensure that contract activities are monitored and reviewed on a
periodic basis to ensure that there are no problems with invoice production
and submission. This can be easily accomplished by having contract terms
that include the right of the District of Columbia to review expenditure
activity of the vendor.
In conclusion, the analysis presented in this document is not an absolute
statement or “proof” about fraud occurring within the GSC. What the
analysis does do is provide the analytic framework to begin to review
activity that may “statistically” indicate the potential for fraudulent activity.
The payoff in the implementation of this type of process is that with the
delay between the input of the invoice and the payment of the invoice
(typically 5 to 30 days), we should be able to assess on a daily basis
throughout the District disbursement mechanism the detection of a
fraudulent payment before it is issued.
15
APPENDIX
Drilldown Results for First 2 Digits Test
Drilldown Results for Last 2 Digits Test
Drilldown Results for Number Duplication Test
Drilldown Results for Amounts Immediately Below Internal
Control Threshold

Final Initial Project Development With Discussion

  • 1.
    Office of theChief Financial Officer Government Services Cluster and Office of Integrity and Oversight July 9, 2014 Utilization of Benford’s Law Principles to Analyze Accounts Payable Transactions Testing the Implementation of a Fraud Prediction and Prevention Model George B. Dines, Jr. Associate Chief Financial Officer
  • 2.
    1 Abstract The analysis presentedis a pilot presentation of a forensic analytical technique utilizing the principles surrounding Benford’s Law. The expenditure data for the Government Services Cluster (GSC) District Department of Transportation for FY 2013 is analyzed to determine the probability of potential problems in disbursements to vendors and District Staff. The data represents 5,131 total disbursements totaling $376.26 million. It is expected that this pilot presentation will be expanded at some point to include all agencies within the Government Services Cluster. Going forward, the methodology will be discussed with the Office of Integrity an Oversight (OIO) to ensure proper policies and procedures are developed, statistical sampling techniques utilized and to ensure that agency level review is initiated. Analytical Framework Benford’s Law, named for physicist Frank Benford, who worked on the theory in 1938, is the mathematical theory of leading digits. Specifically, in data sets, the leading digit(s) is (are) distributed in a specific, non-uniform way. While one might think that the number 1 would appear as the first digit 11 percent of the time (i.e., one of nine possible numbers), it actually appears about 30 percent of the time (see figure 1). Nine, on the other hand, is the first digit less than 5 percent of the time. The theory covers the first digit, second digit, first two digits, , second digit, first two digits, last digit and other combinations of digits because the theory is based on a logarithm of probability of occurrence of digits.
  • 3.
    2 Benford’s Law holdstrue for a data set that grows exponentially (e.g., doubles, then doubles again in the same time span), but also appears to hold true for many cases in which an exponential growth pattern is not obvious (e.g., constant growth each month in the number of accounting transactions for a particular cycle). It is best applied to data sets that go across multiple orders of magnitude (e.g., populations of towns or cities, income distributions). While it has been shown to apply in a variety of data sets, not all data sets follow this theory. The theory does not hold true for data sets in which digits are predisposed to begin with a limited set of digits. For instance, Benford’s Law will not hold true for data sets of human heights, human weights and intellectual quotient (IQ) scores. Another example would be small insurance claims (e.g., between US $50 and US $100). The theory also does not hold true when a data set covers only one or two orders of magnitude. Thus amounts between $0.00 and $100.00 have been excluded from this pilot analysis. What are the Right Circumstances for Using Benford’s Law? Almost from the beginning, proponents of Benford’s Law have suggested that it would be a beneficial tool for fraud detection. A recent example is Nigrini’s (who presented at the ACFE Fraud Conference) research, which showed that Benford’s Law could be used as an indicator of accounting and expenses fraud. One fraudster wrote numerous checks to himself just below US $100,000 (a policy and procedure threshold), causing digits 7, 8 and 9 to have aberrant percentages of actual occurrence in a Benford’s Law analysis. Digital analysis using Benford’s Law was also used as evidence of voter fraud in the 2009 Iranian election. In fact, Benford’s Law is legally admissible as evidence in the US in criminal cases at the federal, state and local levels. This fact alone substantiates the potential usefulness of using Benford’s Law. Of course the usage of Benford’s Law needs to “fit” the audit objective. Some uses are fairly easy to determine for fit. For instance, if the audit objective is to detect fraud in the disbursements cycle, the IT auditor could use Benford’s Law to measure the actual occurrence of leading digits in disbursements compared to the digits’ probability. Some good examples include thresholds and cutoffs. For instance, if a bank’s policy is to refer loans at or above $50,000 to a loan committee, looking just below that approval threshold gives a loan officer
  • 4.
    3 the potential todiscover loan frauds. If loan fraud was being perpetrated, a Benford’s Law test of looking at either the leading digit (specifically, the 4) or two leading digits (specifically, 49) has the potential to uncover the fraud. Figure 2 shows what a Benford’s Law test of the leading digit might show as a result in this particular scenario. The line is Benford’s Law probabilities and the bars are the actual occurrences. Note that 4 is aberrantly high in occurrence, and 5 is too low, indicating the possible manipulation of the natural occurrence of loans beginning with 5 ($50,000 loans) possibly being switched to just under the cutoff or indicating that the suspect could be issuing a lot of $49,999.99 loans fictitiously to embezzle funds. Another example might be a cutoff of $2,500 for purchases in which a purchase order is required for any purchase at or above this price point. Thus, a Benford’s Law test of the two leading digits (specifically, 24) could reveal any anomalies, manipulation or fraud involving this cutoff. It is also useful as a test of controls to see if existing controls for purchase orders are working effectively. It is important to note that since the cutoff amount has two key digits, a two-digit test is needed rather than a single leading digit. Other objectives are equally applicable within the operating environment of the District of Columbia, including analysis of: • Credit card transactions • Purchase orders • Loan data ( Economic Development Cluster) • Journal entries • Accounts payable transactions
  • 5.
    4 • Citizen andVendor refunds Within the District’s operating environment, we will work with the OIO to determine whether to run a one-digit test or two-digit test. The two-digit test will usually give more granular results, but is also likely to reveal more spikes than a one-digit test. Once the test has been run, we will determine what results deserve more attention or whether the results provide evidence or information related to the review objective. Generally speaking, the spikes above the Benford’s Law line are the numbers of interest (see 4, not 5, in figure 2). The internal review will obtain independent information on why the digit(s) spike(s). What are the Constraints in Using Benford’s Law? The assumptions regarding the data to be examined by Benford’s Law are: • Numeric data • Randomly generated numbers:
 Not restricted by maximums or minimums, or assigned numbers • Large sets of data • Magnitude of orders (e.g., numbers migrate up through 10, 100, 1,000, 10,000, etc.) (Other assumptions exist that are unimportant in applying Benford’s Law in IT audits.) It is important to note that one assumption of Benford’s Law is that the numbers in the large data set are randomly generated. For example, hourly wages will have a minimum and possibly some maximum (even if a realistic maximum) that means that the data set is not generated in a completely random fashion, but rather uses a restricted or manipulated set of digits as the potential leading digit. The same is true if there is a formula or structure to the manner in which the number is generated. For example, US telephone numbers are assigned with a specific area code and a limited number of 3- digit prefaces to the last 4 digits (which are the only truly randomly generated numbers in a phone number). Thus, before applying Benford’s Law, the GSC in conjunction with the OIO will ensure that the numbers are randomly generated without any real or artificial restriction of occurrence. Benford’s Law should be applied only to large data sets. This includes files with hundreds of transactions (e.g., invoices to customers, disbursements, payments received, inventory items). It is inadvisable to use Benford’s Law
  • 6.
    5 for small-sized datasets, as it would not be reliable in such cases. It is recommended that the data set be 1,000 records or more, or that justification be provided as to why a lower volume of transactions is suitable to Benford’s Law, i.e., show that the smaller size still meets the other constraints and that size will not affect the reliability of results. The orders of magnitude in particular usually take hundreds of transactions. Using fewer than 1,000 may lead to too many spikes of interest, too many false positives. Conclusion The literature suggests that Benford’s Law can recognize the probabilities of highly likely or highly unlikely frequencies of numbers in a data set. The probabilities are based on mathematical logarithms of the occurrence of digits in randomly generated numbers in large data sets. Those who are not aware of this theory and intentionally manipulate numbers (e.g., in a fraud) are susceptible to getting caught by the application of Benford’s Law.
  • 7.
    6 Pilot Disbursement Analysis Departmentof Transportation For the Fiscal Year Ended September 30, 2013 Data Framework The analysis represents a data with the following characteristics:  Disbursements from October 1, 2012 to September 30, 2013  5,131 total disbursements, or individual invoices  $376,257,358.06 in total disbursements  Arithmetic average transaction amount of $140,451.65 The data was obtained through a download to an Excel file from the CFO Solve application provided by the OCIO within the Office of the Chief Financial Officer. The fidelity of the download has not been tested at this point. As part of a full scale implementation, this data file should probably be obtained by member of the OIO staff for analysis, independent of Government Services Cluster staff. Analysis of the Data The analytical level summary (Table 1) is presented below. Please note that all values from $0.00 to $99.00 have been removed from the analysis to provide more accurate assessment of the Benford process. It is also worth noting that 98.98% of all disbursements are greater than $5,000.00. The internal accounts payable review policy within the GSC mandates that all transactions $25,000.00 and over are reviewed by senior staff for appropriate program staff certification. Clearly, future analysis will include an additional report on the analytical level of transactions between $10,000.00 and $24,999.00 to ascertain whether vendors are submitting invoices for payments below the internal review threshold. Table 1 Analytical Level Count of Transactions % of Total Count Total Value % of Total Value <= 0 0 0.00 0.00 0.00 0 <= 100 26 0.51 2,600.00 0.00 100 <= 500 489 9.53 135,916.94 0.04 500 <= 1000 406 7.91 305,067.01 0.08 1000 <= 5000 1,256 24.48 3,389,168.97 0.90 5000 > 2,954 57.57 372,424,605.14 98.98 Totals 5,131 100.00 376,257,358.06 100.00
  • 8.
    7 Figure 3 In addition,there were no negative numbers within the sample, suggesting a lack of cancelled disbursements/payments. 0 500 1,000 1,500 2,000 2,500 3,000 3,500 <= 0 0 <= 100 100 <= 500 500 <= 1000 1000 <= 5000 5000 > Analytical Levels for Invoice Amounts # of Items
  • 9.
    8 Benford’s Law Analysis:First Digit Test Figure 4 Visual inspection of the First Digit Test Graph (Figure 4) shows close conformity to the Benford principles. The Mean Absolute Difference (MAD), defined as how much a set of observations differ from the average, for this analysis is 0.0051934, defined as within close conformity. 0.00000 0.05000 0.10000 0.15000 0.20000 0.25000 0.30000 0.35000 1 2 3 4 5 6 7 8 9 Proportion Digit First Digit Test for Invoice Amounts Proportion Benford Proportion
  • 10.
    9 Benford’s Law Analysis:Second Digit Test Figure 5 The MAD for the second digit test is 0.00789873 and is considered “acceptable conformity” to Benford’s Law principles (Figure 5). The preponderance of 0’s in the second number could be a result of analyzing accounts payable transactions. 0.00000 0.02000 0.04000 0.06000 0.08000 0.10000 0.12000 0.14000 0.16000 0 1 2 3 4 5 6 7 8 9 Proportion Digit Second Digit Test for Invoice Amounts Proportion Benford Proportion
  • 11.
    10 Benford’s Law Analysis:First 2 Digits Test This is the first example of a test that is on the border line in terms of acceptability. The MAD for the first 2 digits test is 0.001719408. While this is deemed at the low end of the acceptable range, it is so close to indicating marginally acceptable conformity, that the data outside of the Benford Proportion bear further review. The analysis will focus on the spikes where the first two digits of invoices are:  25  30  47  90 It is worth noting that according to the analysis, invoices starting with 90 are almost 3 times the acceptable Benford Proportion. Invoice details for further analysis are provided in the Appendix. Figure 6 0 0.005 0.01 0.015 0.02 0.025 0.03 0.035 0.04 0.045 0.05 10 13 16 19 22 25 28 31 34 37 40 43 46 49 52 55 58 61 64 67 70 73 76 79 82 85 88 91 94 97 Proportion Digit First 2 Digits Test for Invoice Amounts Proportion Benford Proportion
  • 12.
    11 Benford’s Law Analysis:Last 2 Digits Test The last two digits test is a powerful test for number invention. The theoretical basis of this test is the fact that the digit frequencies become uniform as we move to the right in a number. It is suggested in the literature that this test is not that useful for accounts payable data. That is mainly because invoice amounts usually show that many numbers end with 00, as we can see in Figure 7, where a huge number of the last 2 digits are at 00 (extreme left of Figure 7). These items will be excluded from review, and will be better reviewed with the number duplication test. However, due to the slight activity at 50, invoices that meet this 2 digit criteria will be pulled for review. Details of these invoices are provided in the Appendix. Figure 7 0 0.05 0.1 0.15 0.2 0.25 0.3 0 3 6 9 12 15 18 21 24 27 30 33 36 39 42 45 48 51 54 57 60 63 66 69 72 75 78 81 84 87 90 93 96 99 Proportion Digit Last 2 Digit Test for Invoice Amounts Proportion Benford Proportion
  • 13.
    12 Benford’s Law Analysis:Number Duplication Test Table 2 provides information on invoice payment amounts duplicated within the distribution sampled and analyzed. For the immediate sake of the analysis here, the invoices representing the seven (7) largest amounts will be reviewed. Since all of the item amounts except for one are above $25,000.00, GSC or OIO staff can perform additional tests to confirm that our internal control process, active review of invoices greater than$25,000.00, is actually occurring. We will also be able to review individual vendor invoices according to this criteria. Table 2 Count Amount Rank Largest Amounts 29 906.4000 1 26 100.0000 2 25 3,020.0000 3 24 30,080.0000 4 1 20 135.9000 5 19 3,751.2000 6 17 722.8000 7 12 2,500.0000 8 11 823.6000 9 11 578.2400 10 10 2,140.5800 11 10 1,750.0000 12 9 80,628.0000 13 2 9 54,370.0000 14 3 9 4,741.6700 15 9 3,000.0000 16 8 4,746.3300 17 8 2,000.0000 18 8 1,600.0000 19 8 725.1200 20 8 500.0000 21 8 450.0000 22 8 153.0000 23 8 130.0600 24 7 382,633.6200 25 4 7 33,333.3300 26 5 7 7,975.0000 27 6 6 75,000.0000 28 7 6 5,000.0000 29 6 1,500.0000 30
  • 14.
    13 Discussion, Findings andConclusion The data presented from the analysis provide some limited comfort that from a statistical perspective, there appears to not be a problem with fraudulent disbursements. This is based upon the Benford analysis as well as internal review of each exception payment/voucher identified. The full data set for review is included in the Appendix to this report. The last section of the Appendix provides a detailed table of all transactions immediately under the $25,000.00 internal control threshold implemented by the OCFO in the GSC. These items were also reviewed internally. Each identified exception voucher was reviewed independently by a member of the Accounts Payable staff. For purposes of this test, traditional audit sampling methodology was not used to test transactions. It is possible that by applying standard audit sampling methodology, fraudulent items could easily be missed. For a more full scale implementation, controls would be in place to ensure that staff performing these reviews is not covering up for some type of fraudulent scheme. How this would work will be discussed with OIO as we look to a implementing a full cluster implementation of this type of testing. Significant work will be required with OIO to fully develop and implement a comprehensive real time analysis of disbursements within the GSC as well as other agencies with the District. All invoices identified were reviewed internally for appropriateness. A report of the findings is presented below. Our internal review identified the following items of interest:  One instance of a potential underpayment of a vendor. This item is currently under review by Accounts Payable.  In the “First 2 Digit Test”, we confirmed that the payments to a temporary company with duplicate amounts represented reported time for temporary staff that was properly approved. Specific attention was focused on vendors receiving payment for duplicated amounts over several months which are a fraud indicator.  In the “Number Duplication Test”, we confirmed that payments in the same amounts over several months are reflective of contract language for the vendors identified the Purchase Order.  In the “Invoices Under the $25,000 Threshold Test”, all of the amounts reflect appropriately charged expenditures to contracts. The
  • 15.
    14 data does notsuggest that people were submitting invoices under the agency minimum to evade detection. It is clear that along with review of invoices, we must work with program staff to ensure that contract activities are monitored and reviewed on a periodic basis to ensure that there are no problems with invoice production and submission. This can be easily accomplished by having contract terms that include the right of the District of Columbia to review expenditure activity of the vendor. In conclusion, the analysis presented in this document is not an absolute statement or “proof” about fraud occurring within the GSC. What the analysis does do is provide the analytic framework to begin to review activity that may “statistically” indicate the potential for fraudulent activity. The payoff in the implementation of this type of process is that with the delay between the input of the invoice and the payment of the invoice (typically 5 to 30 days), we should be able to assess on a daily basis throughout the District disbursement mechanism the detection of a fraudulent payment before it is issued.
  • 16.
    15 APPENDIX Drilldown Results forFirst 2 Digits Test Drilldown Results for Last 2 Digits Test Drilldown Results for Number Duplication Test Drilldown Results for Amounts Immediately Below Internal Control Threshold