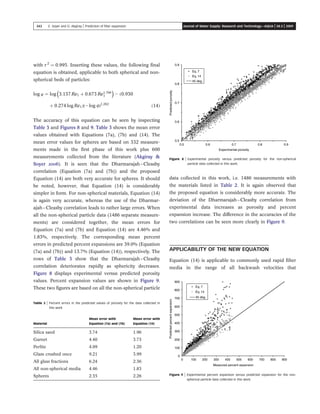
SlideShare a Scribd company logo
A new simple equation for the prediction of filter
expansion during backwashing
Elif Soyer and Omer Akgiray
ABSTRACT
Elif Soyer (corresponding author)
Department of Environmental Engineering,
Istanbul Technical University,
Maslak-Istanbul,
Turkey
Tel.: +90 212 285 6785
Fax: +90 212 285 3781
E-mail: esoyer@ins.itu.edu.tr
Omer Akgiray
Department of Environmental Engineering,
Marmara University,
Goztepe-Istanbul,
Turkey
Fluidization experiments have been carried out with glass spheres, plastic spheres and several
sieved fractions of silica sand, garnet sand, perlite and crushed glass. The effect of particle shape
on expansion behavior is investigated. Sphericity as determined using the Ergun equation and
fixed-bed head loss data is employed to quantify the shape effect. It is found that the influence of
particle shape depends on the Reynolds number based on backwash velocity. A new equation
that accounts for particle shape is proposed. For the materials studied, the proposed equation
gives excellent agreement with both the spherical and the non-spherical particle data.
Key words | backwash, filter media, fluidization, particle shape, sphericity, water treatment
INTRODUCTION AND THEORY
Liquid–solid fluidization has a number of applications in
engineering (Epstein 2003b). The expansion of granular
filter media during backwashing is of particular interest
(Droste 1997; AWWA 1999; Akkoyunlu 2003). It is impor-
tant to have an understanding of fluidization principles and
an ability to predict bed expansion as a function of liquid
velocity to design such systems properly. More often than
not, the media involved are not spherical and it is necessary
to have an expansion model that can be applied to beds of
non-spherical particles.
Numerous equations have been proposed to predict the
expansion of liquid fluidized beds of spheres. Reviews and
listings of such equations can be found in Garside &
Al-Dibouni (1977), Couderc (1985), Hartman et al. (1989), Di
Felice (1995) and Epstein (2003a). An evaluation of these
equations has recently been presented by Akgiray & Soyer
(2006). Very few general equations exist, however, for non-
spherical media (Cleasby & Fan 1981; Dharmarajah &
Cleasby 1986; Akgiray & Saatc¸ i, 2001; Akkoyunlu 2003;
Akgiray et al. 2004). Furthermore, the accuracies of the
expansion models for non-spherical media have not been
evaluated in a satisfactory manner to date.
Akgiray & Soyer (2006) noted that, while most expan-
sion models are strictly restricted to spheres, a correlation
method explained by Richardson & Meikle (1961) may be
generalized to handle non-spherical media. In this
approach, a dimensionless friction factor f is plotted against
a modified Reynolds number Re1. The friction factor is
defined as follows:
f ¼
R
r V
1
 2
ð1Þ
where R ¼ force per unit area of grains, r ¼ density of the
fluid, 1 ¼ porosity of the bed and V ¼ fluid velocity based
on the empty cross section of the bed. The porosity 1 for
the fluidized bed is calculated by the relation
L(1 2 1) ¼ L0(1 2 10), where L ¼ depth of the fluidized
bed, L0 ¼ depth of the fixed bed and 10 ¼ fixed-bed
porosity. Equation (1) holds for both fixed and fluidized
beds. For a fluidized bed under steady state conditions, the
upward frictional force on the particles is balanced by the
effective gravitational force. The net gravitational force is
the weight of the particles less the upward force attributable
doi: 10.2166/aqua.2009.090
336 Q IWA Publishing 2009 Journal of Water Supply: Research and Technology—AQUA | 58.5 | 2009
to the buoyancy of the suspension. Therefore, Equation (1)
takes the following form for fluidized beds under steady
state conditions:
f ¼
13
ðrp 2 rÞg
r
Sp
Vp
 
V2
¼
13
ðrp 2 rÞgcdeq
6rV2
ð2Þ
Here, Sp/Vp ¼ 6/(cdeq) is the specific surface of the grains,
SP ¼ particle surface area, VP ¼ particle volume, rp ¼
particle density, deq ¼ equivalent diameter defined as the
diameter of the sphere with the same volume as the particle,
c ¼ sphericity defined as the surface area of the equivalent
volume sphere divided by the actual surface area of the
particle and g ¼ gravitational acceleration. The definition
of Re1 uses interstitial velocity V/1 for the characteristic
velocity and the mean hydraulic radius 1/((Sp/Vp)(1 2 1))
for the characteristic linear dimension (Blake 1922):
Re1 ¼
V
1
1
ðSp=VpÞð1 2 1Þ
r
m
¼
cdeqrV
6mð1 2 1Þ
ð3Þ
where m ¼ viscosity of the fluid. Richardson  Meikle
(1961) plotted f as a function of the modified Reynolds
number Re1 to correlate sedimentation and fluidization
data for spheres. To simplify calculations when V is not
known a priori, Richardson  Meikle (1961) introduced a
dimensionless group w to be used instead of the friction
factor f:
w ¼ fRe2
1 ¼
13
ð1 2 1Þ2
c3
deq
3
rðrp 2 rÞg
216m2
ð4Þ
Establishing a quantitative relationship between w and Re1
allows the prediction of expanded bed porosity 1 as a
function of fluid properties (viscosity m, density r), media
properties (sphericity c, size deq, density rp) and hydraulic
loading rate (V ¼ Q/A). Once the porosity (1) is calculated,
expanded bed height L can be computed using the relation
L(1 2 1) ¼ L0(1 2 10) with a knowledge of initial porosity
10 and initial bed height L0. In certain problems, the desired
expanded bed height L is given and the corresponding
backwash velocity is to be calculated. In this case, the
calculations proceed as follows. The porosity 1 is first
calculated from the expanded bed height L using the
relation L(1 2 1) ¼ L0(1 2 10), and this value of porosity is
inserted into the definitions of Re1 (Equation (3)) and w
(Equation (4)). The relation between w and Re1 is then
employed to calculate the velocity V. Depending on the
relation (graphical or mathematical) between w and Re1,
one or both of these two types of calculation may require
trial-and-error solutions.
It has been noted that the Fair–Hatch fluidization
Equation (Fair  Hatch 1933) and the Ergun Equation
(Ergun 1952)–the latter when applied to fluidized beds–
are actually correlations relating w and Re1 (Akgiray 
Saatc¸ i 2001):
w ¼ kRe1 ð5Þ
w ¼ k1Re1 þ k2Re2
1 ð6Þ
A number of authors have suggested the application of
one or the other of these two equations to the fluidization of
non-spherical media (Fair  Hatch 1933; Foust et al. 1960;
Kelly  Spottiswood 1982; Geankoplis 1993; McCabe et al.
2001; Akgiray  Saatc¸ i 2001). It seems plausible that these
equations are applicable to both spherical and non-
spherical media for the following reasons: (1) the defi-
nitions of Re1 and w include the sphericity parameter (cf
Equations (3) and (4)), and therefore the particle shape
appears to be accounted for in these equations and (2) the
corresponding Equations (the Blake–Kozeny and Ergun
equations) for fixed beds are generally accepted to be
applicable to both spherical and non-spherical media.
Recent research has shown, however, that when fluidized
non-spherical media are considered, the value of the group
w is not uniquely fixed when Re1 is fixed and the effect of
shape has to be accounted for explicitly and independently.
This is explained in what follows.
While Richardson  Meikle considered only spheres
(i.e. the case c ¼ 1), Dharmarajah  Cleasby (1986)
considered the possibility of applying this method of
correlation to non-spherical media. They have analyzed
the data for fluidized spheres published by Wilhelm 
Kwauk (1948) and Loeffler (1953) and the non-spherical
particle data obtained by Cleasby  Fan (1981) and
Dharmarajah (1982) to develop the following piecewise
correlation:
For Re1 , 0:2 : w ¼ 3:01Re1 ð7aÞ
337 E. Soyer and O. Akgiray | Prediction of filter expansion Journal of Water Supply: Research and Technology—AQUA | 58.5 | 2009
For Re1 . 0:2 :
log w ¼ 0:56543 þ 1:09348 log Re1 þ 0:17979ðlog Re1Þ2
2 0:00392ðlog Re1Þ4
2 1:5ðlog cÞ2
ð7bÞ
It is noteworthy that this piecewise correlation has been
included in the last two editions of AWWA’s Water Quality
Handbook (AWWA 1990, 1999) and probably represents the
“state-of-the-art” for the expansion of non-spherical media
(Droste 1997).
An important experimental finding in the work by
Dharmarajah  Cleasby (1986) was that, when w versus Re1
values were plotted, fluidization data for non-spherical
media deviated from the trend-line of the spherical particle
data. Akgiray et al. (2004) tested this finding using new data
with silica sand and crushed glass. They verified that the
non-spherical particle data do indeed deviate from the
trend-line for spheres, but they also reported that the effect
of shape is not well represented by the term 1.5(log c)2
in
Equation (7b).
A number of shortcomings of Equation (7a) and (7b)
were also documented by Akgiray et al. (2004). More
recently, Akgiray  Soyer (2006) presented a new equation
to remedy these shortcomings. They have used the same
spherical particle data utilized by Dharmarajah  Cleasby
(1986) plus the spherical particle data by Wen  Yu (1966)
and Hartman et al. (1989) to develop the coefficients in their
equation:
w ¼ k1Re1 þ k2ReP
1 ð8Þ
The following values were obtained: k1 ¼ 3.137, k2 ¼ 0.673
and P ¼ 1.766 (r 2
¼ 0.99897, based on 600 data points).
When attention is restricted to spheres, Equation (8) has a
number of important advantages over Equation (7a) and
(7b) (Akgiray  Soyer 2006).
As it stands, Equation (8) is applicable to spheres only.
Based on the finding by Dharmarajah  Cleasby (1986) that
the data (log c values) for non-spherical particles fall below
the trend-line for spheres by a distance 1.5 (log c)2
, this term
could be subtracted from the logarithm of the right-hand
side of Equation (8) to obtain an equation applicable to
non-spherical particles as well. However, Akgiray et al.
(2004) reported new data using silica sand and crushed glass
and noted that the effect of shape was stronger than that
predicted by the term 1.5 (log c)2
. Furthermore, the shape
effect (as taken into account by such an additional term)
was observed to depend on the modified Reynolds number.
A new equation, however, was not presented in that paper
to quantify the dependence of the shape effect on the
Reynolds number and the sphericity. In addition to
reporting a significant amount of additional experimental
data, this paper presents an amendment of Equation (8)
based on an analysis of the mentioned non-spherical
particle data.
The current paper focuses on single-medium beds
consisting of uniform (i.e. single size) grains. If an accurate
model for the expansion of a uniform bed is available, the
expansion of a non-uniform bed can also be predicted: A
bed with a size gradation is considered to consist of several
layers of approximately uniform size according to the sieve
analysis data, and the expansion of each layer is separately
calculated. The total expansion is calculated by adding the
expansions of all the layers (Fair et al. 1971; AWWA 1999).
This calculation method can also be used to predict the total
expansion of a multimedia bed.
EXPERIMENTAL
In the first part of this work (Akgiray  Soyer 2006),
fluidization experiments were carried out with glass balls of
eight different sizes and plastic balls of three different sizes
(Table 1). To assess the effect of particle shape, new
experiments have been carried out with ten sieved fractions
of silica sand, eleven sieved fractions of crushed glass, five
sieved fractions of perlite and four sieved fractions of garnet
sand (Table 2). Perlite and crushed glass are of interest as
they are possible substitutes for silica sand in rapid filters
(Uluatam 1991; Rutledge  Gagnon 2002). Their properties
(densities and sphericities) are different than those of silica
sand and, as such, they provide additional fluidization data
useful for model development and testing. Data for four
fractions of crushed glass were reported in earlier work
(Akgiray et al. 2004). To obtain additional fractions of this
material, crushed glass retained in the topmost sieve tray
was crushed again and sieved. In this manner sufficient
quantities of seven additional fractions of crushed glass
338 E. Soyer and O. Akgiray | Prediction of filter expansion Journal of Water Supply: Research and Technology—AQUA | 58.5 | 2009
were obtained. Glass fractions obtained by repeated crush-
ing and sieving were observed to have higher sphericity
values. Using this procedure, several crushed glass fractions
with approximately the same size and density but different
sphericities were produced. This allowed the collection of
additional fluidization data to investigate the effect of shape
on expansion behavior.
The silica sand, perlite, garnet and crushed glass
fractions were obtained by a rigorous manual sieving
procedure followed by an additional 1 min of manual
sieving such that the change in weight during the latter
was less than 1% for each fraction. Densities were measured
by a water-displacement technique. Equivalent diameters
have been measured by counting and weighing 200 grains of
each fraction. Diameters of the spheres were also measured
with a micrometer and excellent agreement with the
counting-weighing method was observed. Following earlier
investigators (Cleasby  Fan 1981; Dharmarajah  Cleasby
1986; Akgiray et al. 2004), sphericity of each material was
determined by measuring the fixed-bed head loss (h) for
each fraction and using the Ergun Equation (Ergun 1952):
h
L0
¼
k1m
rg
ð1 2 10Þ2
13
0
6
cdeq
!2
V þ
k2
g
ð1 2 10Þ
13
0
6
cdeq
!
V2
ð9Þ
This equation can be rearranged as a quadratic equation in
sphericity c:
h
L0
 
c2
2
k2
g
ð1 2 10Þ
13
0
6
deq
!
V2
 #
c
2
k1m
rg
ð1 2 10Þ2
13
0
6
deq
!2
V
2
4
3
5 ¼ 0
ð10Þ
Once the quantities within the square brackets are
measured, the sphericity is determined by using the well-
known quadratic formula.
Table 2 | Properties of the non-spherical media used in the fluidization experiments
(crushed glass fractions marked ( p ) were obtained by repeated crushing
and sieving)
Particle type
Density rp
(g/cm3
)
deq
(mm) Sphericity, c
Silica sand 0.355 £ 0.50 2.646 0.50 0.710
Silica sand 0.50 £ 0.59 2.647 0.60 0.777
Silica sand 0.50 £ 0.60 2.649 0.65 0.794
Silica sand 0.59 £ 0.60 2.651 0.68 0.788
Silica sand 0.59 £ 0.70 2.653 0.73 0.772
Silica sand 0.70 £ 0.84 2.640 0.84 0.757
Silica sand 0.84 £ 1.00 2.639 1.02 0.738
Silica sand 1.00 £ 1.19 2.641 1.11 0.706
Silica sand 1.19 £ 1.41 2.628 1.40 0.714
Silica sand 1.41 £ 1.68 2.629 1.65 0.723
Crushed glass 0.84 £ 1.00 2.486 0.92 0.413
Crushed glass 1.18 £ 1.41 2.494 1.24 0.442
Crushed glass 1.41 £ 1.68 2.496 1.48 0.430
Crushed glass 2.00 £ 2.38 2.499 2.08 0.415
Crushed glass 0.70 £ 0.84 ( p ) 2.490 0.77 0.530
Crushed glass 0.84 £ 1.00 ( p ) 2.497 0.98 0.516
Crushed glass 1.00 £ 1.18 ( p ) 2.497 1.13 0.548
Crushed glass 1.18 £ 1.41 ( p ) 2.496 1.34 0.515
Crushed glass 1.41 £ 1.68 ( p ) 2.503 1.62 0.564
Crushed glass 1.68 £ 2.00 ( p ) 2.501 1.82 0.559
Crushed glass 2.00 £ 2.38 ( p ) 2.499 2.21 0.624
Perlite 0.70 £ 0.84 2.335 0.85 0.652
Perlite 0.84 £ 1.00 2.331 1.07 0.645
Perlite 1.00 £ 1.18 2.332 1.22 0.664
Perlite 1.18 £ 1.41 2.328 1.41 0.651
Perlite 1.41 £ 1.68 2.326 1.65 0.682
Garnet 0.21 £ 0.25 4.393 0.245 0.845
Garnet 0.21 £ 0.25 4.124 0.241 0.817
Garnet 0.177 £ 0.21 4.420 0.220 0.856
Garnet 0.177 £ 0.21 4.107 0.208 0.800
Table 1 | Properties of the spherical media used in the fluidization experiments
Particle type rp (g/cm3
) d (mm)
Glass balls 2.519 1.11
Glass balls 2.494 1.19
Glass balls 2.529 2.03
Glass balls 2.494 3.18
Glass balls 2.532 2.99
Glass balls 2.499 4.03
Glass balls 2.529 4.98
Glass balls 2.527 6.01
Plastic balls 1.171 1.97
Plastic balls 1.193 2.48
Plastic balls 1.180 2.87
339 E. Soyer and O. Akgiray | Prediction of filter expansion Journal of Water Supply: Research and Technology—AQUA | 58.5 | 2009
The sphericity values reported in Table 2 are the mean
values for several measurements. Head loss measurements
were carried out with extreme care to make sure that bed
height (and porosity) did not change and that air bubbles
did not accumulate within the bed during the experiments.
Accumulation of small air bubbles, in particular, decreases
porosity (volume fraction available for flow) and may
completely invalidate head-loss measurements. For the
eleven different sizes of glass and plastic balls, the
calculated sphericities were always very close to 1.0. This
finding, in addition to showing that the Ergun equation is
very accurate for fixed beds of spheres for the range of
Reynolds numbers used in this study, provided a check of
the validity of head-loss measurements and sphericity
determinations carried out in the current work. The
properties of the media are summarized in Tables 1 and 2.
Fluidization experiments were carried out using tap
water. Initial bed height L0 was recorded before each
fluidization experiment. Temperature, flow rate Q and bed
expansion L were recorded during each experiment.
Viscosity and density of water at different temperatures
were obtained from the literature (Perry  Green 1984). In
earlier work, a 40 cm high column with an internal diameter
of 38 mm was employed (Akgiray et al. 2004). The new data
presented here were obtained using a 152 cm high column
with an internal diameter of 50.5 mm. The use of the larger
column allowed collecting data at higher expansions and
over a greater range of Reynolds numbers and porosities.
Porosities were calculated from bed weight, bed height and
density values.
Wall effects were estimated using an empirical formula
based on Loeffler’s data (Loeffler 1953) as explained in
previous work (Akgiray  Soyer 2006). In this approach,
the ratio of corrected velocity to actual velocity V0/V is
calculated from media properties and column diameter.
Here V0 is the backwash velocity required to attain the
same porosity in an infinitely large container as velocity
V would produce in a container of diameter D. The
corrected velocity (V0) values were used to plot and
analyze the results. Although wall-effect corrections were
always applied, it should be added that these corr-
ections were quite small as the ratio V0/V remained in the
range 1.01–1.03 in all the experiments carried out in
this work.
Experimental porosities were calculated from measured
expansion heights using the relation L(1 2 1) ¼ L0(1 2 10).
The corrected velocities and calculated experimental por-
osities were then used together with fluid and particle
properties to calculate Re1 (Equation (3)) and w (Equation
(4)) values.
RESULTS AND DISCUSSION
Two sample sets of data are shown in Figures 1 and 2.
Percent expansion versus backwash velocity is plotted in
these figures:
Percent expansion ¼ 100
ðL 2 L0Þ
L0
ð11Þ
Also shown (dashed line) are the percent expansions
predicted using the Dharmarajah–Cleasby correlation
(Equation (7a) and (7b)). The solid lines have been obtained
with the new Equation (14) explained in the next section.
These model lines were calculated as follows: values of fluid
properties (m, r), media properties (c, deq, rp) and velocity
(V) were inserted into the expressions for Re1 (Equation (3))
and w (Equation (4)). The corresponding theoretical
porosity value was next calculated by inserting the
expressions for Re1 and w into either Equation (7a) and
(7b) or Equation (14) and then solving the resulting
nonlinear algebraic equation for porosity by means of an
iterative scheme. Once the theoretical porosity is deter-
mined, percent expansion is next calculated using Equation
(11) and the relation L(1 2 1) ¼ L0(1 2 10). Results similar
Figure 1 | Bed expansion versus velocity for the 1.00 £ 1.19 mm silica sand
(c ¼ 0.706).
340 E. Soyer and O. Akgiray | Prediction of filter expansion Journal of Water Supply: Research and Technology—AQUA | 58.5 | 2009
to Figures 1 and 2 were obtained for each of the materials in
Table 2.
As noted earlier, the Dharmarajah–Cleasby correlation
is considered to be the “state-of-the-art” for the prediction
of filter bed expansion (Droste 1997; AWWA 1999). This
correlation is mentioned and used in the discussion and
evaluation of the results obtained here for the following
reasons: (1) since it is widely used, its accuracy needs to be
evaluated and this is accomplished presently; (2) it is used
here as a basis of comparison because, to be useful, any new
correlation should be simpler and/or more accurate than
this correlation; (3) Equations (5) and (6) are no longer
mentioned, as it has already been established that they are
restricted to spheres and to limited ranges of Reynolds
numbers and (4) other correlations proposed for non-
spherical media require additional and difficult-to-obtain
information such as settling velocities (Cleasby  Fan 1981).
Prediction of settling velocities for non-spherical particles is
notoriously unreliable (Kelly  Spottiswood 1982) and
therefore additional tedious experiments would be required
to obtain such information. Expansion correlations that
require a knowledge of settling velocities have therefore
been excluded from consideration in this work.
In evaluating the results of fluidization experiments, it is
important to consider percent expansions (as in Figures 1
and 2), and not just porosities. This is because: (1) in many
practical applications, percent expansion and expanded
bed height are the quantities of direct interest and (2) errors
in predicted values of bed height and percent expansion
may be concealed when only porosities are considered.
In Figure 1, for example, the measured porosity at the
rightmost point (V ¼ 0.1 m/s) is 0.90, whereas Equation
(7a) and (7b) predicts 1 ¼ 0.94. Percent error in porosity is
then 100 £ (0.94 2 0.90)/0.90 ¼ 4.3%, whereas the percent
error in predicted percent expansion is 100 £ (857 2 466)/
466 ¼ 84%. Obviously, this error is unacceptably high.
This issue is further discussed in earlier work (Akgiray 
Soyer 2006).
Figures 3–7 display the non-spherical particle data
collected in this work. The data for spheres were previously
presented (Akgiray  Soyer 2006). The lines labeled
“spheres” in Figures 3–7 were obtained using Equation
(8) which represents the spherical particle data very
accurately. The following are concluded: (1) while the
Dharmarajah–Cleasby correlation (Equation (7a) and (7b))
is quite accurate for spheres, it consistently over-predicts
the expansion of beds of non-spherical media and, in
general, it is not accurate for such media: its deviation from
the data increases as sphericity decreases; (2) when log w
versus log Re1 values are plotted, non-spherical particle data
deviate from the trend-line of the spherical particle data.
This deviation increases as sphericity decreases; (3) the
observed deviation is larger than that predicted by the term
1.5 (log c)2
and (4) careful examination of the data shows
that the mentioned deviation depends on the Reynolds
number as well.
THE NEW EQUATION
Equation (8) was developed in earlier work (Akgiray 
Soyer 2006) using spherical particle data (600 separate
measurements) from the literature and further tested
using the data (332 measurements with the spheres listed
Figure 2 | Bed expansion versus velocity for the 0.70 £ 0.84 mm re-crushed glass
(c ¼ 0.530).
Figure 3 | Data collected in this work for the four fractions of once-crushed glass.
341 E. Soyer and O. Akgiray | Prediction of filter expansion Journal of Water Supply: Research and Technology—AQUA | 58.5 | 2009
in Table 1) collected in the first phase of this work. For the
range of Reynolds numbers and porosities spanned by
the mentioned data (21.96 , log Re1 , 3.54 and
0.37 , 1 , 0.90), Equation (8) has been found to be more
accurate than all of the existing popular correlations (for
details, see Akgiray  Soyer (2006)). Based on the findings
of previous work (Akgiray et al. 2004) and the large number
of new measurements presented here, it is concluded that
when log w versus log Re1 values are plotted, the non-
spherical particle data deviate from the trend-line of the
spherical particle data, and the magnitude of this deviation
depends on both the sphericity and the Reynolds number.
The following equation form has therefore been adopted in
this work:
logw ¼ log 3:137 Re1 þ 0:673 Re1:766
1
 
þ hðRe1; cÞ ð12Þ
Here h ¼ h(Re1, c) is a function of Re1 and c, and it must
satisfy the condition h(Re1, c ¼ 1) ¼ 0. That is, the second
term in Equation (12) vanishes for spheres. Note that
Equation (12) is developed by adding a term to Equation (8)
and that it reverts to Equation (8) for spheres Numerous
different expressions for h were tested and the following
expression has been found to represent the data very
accurately:
hðRe1; cÞ ¼ ða þ b log Re1Þð2log cÞc
ð13Þ
It should be emphasized that several different and more
complicated expressions were also tested, but no significant
improvement in accuracy over Equation (13) could be
obtained by the use of more complex expressions and a
larger number of adjustable coefficients. Equation (13) is
arguably the simplest form conceivable for the function
h(Re1, c), as it assumes a linear dependence on log Re1 and
a simple proportionality to a power of log c, while at the
same time satisfying the condition h(Re1, 1) ¼ 0. A non-
linear regression analysis has been carried out using the
non-spherical particle data collected in this work to
determine the best values of a, b and c. The following
values are obtained: a ¼ 20.930, b ¼ 20.274 and c ¼ 1.262
Figure 4 | Data for the seven re-crushed glass fractions (marked by ( p ) in Table 2).
Figure 5 | Data for the ten fractions of silica sand.
Figure 6 | Data for the four fractions of garnet sand.
Figure 7 | Data for the five fractions of perlite.
342 E. Soyer and O. Akgiray | Prediction of filter expansion Journal of Water Supply: Research and Technology—AQUA | 58.5 | 2009
with r 2
¼ 0.995. Inserting these values, the following final
equation is obtained, applicable to both spherical and non-
spherical beds of particles:
log w ¼ log 3:137 Re1 þ 0:673 Re1:766
1
 
2 ð0:930
þ 0:274 log Re1Þð2log cÞ1:262
ð14Þ
The accuracy of this equation can be seen by inspecting
Table 3 and Figures 8 and 9. Table 3 shows the mean error
values obtained with Equations (7a), (7b) and (14). The
mean error values for spheres are based on 332 measure-
ments made in the first phase of this work plus 600
measurements collected from the literature (Akgiray 
Soyer 2006). It is seen that the Dharmarajah–Cleasby
correlation (Equation (7a) and (7b)) and the proposed
Equation (14) are both very accurate for spheres. It should
be noted, however, that Equation (14) is considerably
simpler in form. For non-spherical materials, Equation (14)
is again very accurate, whereas the use of the Dharmar-
ajah–Cleasby correlation leads to rather large errors. When
all the non-spherical particle data (1486 separate measure-
ments) are considered together, the mean errors for
Equation (7a) and (7b) and Equation (14) are 4.46% and
1.83%, respectively. The corresponding mean percent
errors in predicted percent expansions are 39.0% (Equation
(7a) and (7b)) and 13.7% (Equation (14)), respectively. The
rows of Table 3 show that the Dharmarajah–Cleasby
correlation deteriorates rapidly as sphericity decreases.
Figure 8 displays experimental versus predicted porosity
values. Percent expansion values are shown in Figure 9.
These two figures are based on all the non-spherical particle
data collected in this work, i.e. 1486 measurements with
the materials listed in Table 2. It is again observed that
the proposed equation is considerably more accurate. The
deviation of the Dharmarajah–Cleasby correlation from
experimental data increases as porosity and percent
expansion increase. The difference in the accuracies of the
two correlations can be seen more clearly in Figure 9.
APPLICABILITY OF THE NEW EQUATION
Equation (14) is applicable to commonly used rapid filter
media in the range of all backwash velocities that
Figure 8 | Experimental porosity versus predicted porosity for the non-spherical
particle data collected in this work.
Table 3 | Percent errors in the predicted values of porosity for the data collected in
this work
Material
Mean error with
Equation (7a) and (7b)
Mean error with
Equation (14)
Silica sand 3.74 1.96
Garnet 4.40 3.73
Perlite 4.09 1.20
Glass crushed once 9.21 3.99
All glass fractions 6.24 2.36
All non-spherical media 4.46 1.83
Spheres 2.35 2.26 Figure 9 | Experimental percent expansion versus predicted expansion for the non-
spherical particle data collected in this work.
343 E. Soyer and O. Akgiray | Prediction of filter expansion Journal of Water Supply: Research and Technology—AQUA | 58.5 | 2009
may conceivably be employed in practice. The equation,
however, is not limited to filter backwashing and it may
be prudent here to discuss the limitations on its
application in the context of liquid–solid fluidization
in general. Non-spherical particle data used to develop
and test this equation span the following parameter
ranges: 0.40 , 1 , 0.90,20.76 , log Re1 , 2.51 (0.17
, Re1 , 326), 0.40 , c , 1.0. The limitations of Equation
(14) can therefore be stated as follows. (i) Equation (14)
should not be used for porosity values larger than about
0.90. This limitation is relevant for all correlations based on
the fixed-bed friction factor concept, e.g. the Fair–Hatch
equation, the Ergun equation and the Dharmarajah–
Cleasby correlation (Akgiray  Saatc¸ i 2001). As a matter
of fact, it is generally accepted that expansion behavior of
fluidized beds change at about 1 ¼ 0.85–0.90 and—what-
ever the method of correlation used is—a different equation
is usually specified for higher expansions (Dharmarajah 
Cleasby 1986; Di Felice 1995). (ii) Equation (14) is based on
Equation (8) which, in turn, was developed and tested using
data in the range 21.96 , log Re1 , 3.54, whereas the
non-spherical particle data used in this work span the range
20.76 , log Re1 , 2.51. The accuracy of Equation (14)
outside these ranges of Reynolds numbers has not been
evaluated. (iii) The shape correction term is based on data
with c . 0.4: Extreme shapes, such as needles, and flat
objects, such as flakes, have not been studied. For most
practical applications, these limitations will not prevent the
use of Equation (14). Porosities remain well below 0.90,
for example, during filter backwashing. Similarly, during
backwashing rapid filter media, it can be shown that
Reynolds numbers are well inside the stated range.
Furthermore, the sphericities of all the commonly used
rapid filter media are reported to be above about 0.45
(AWWA 1999). (iv) It is also possible to insert 1 ¼ 1mf in
Equation (14) to get an estimate of the minimum fluidiza-
tion velocity Vmf. Epstein (2003a) noted that, because
expansion equations are usually correlations based on a
whole range of porosity values (from 1mf to very high 1
values), they are likely to be less accurate at the 1mf
extremity than an equation which is tailored to this
extremity. It is therefore recommended that Equation (14)
is applied at bed expansions above about 10% and a
specialized equation be used if the value of Vmf is desired.
SUMMARY AND CONCLUSIONS
Fluidization experiments have been carried out with glass
balls, plastic balls and carefully sieved fractions of silica
sand, garnet sand, perlite and crushed glass to ascertain the
effect of shape on expansion behavior. Sphericity of each
material was determined using fixed-bed head loss data in
conjunction with the Ergun equation. For all the materials
studied, sphericity values calculated using fixed-bed head
loss measurements and the Ergun equation allowed
successful prediction of the effect of particle shape on bed
expansion during fluidization. The non-spherical particle
data fall below the curve for spheres on the friction factor
versus the modified Reynolds number diagram. A new
equation is developed using the non-spherical particle data
collected in this work. The equation has the following
advantages: (1) it has been found to be very accurate for all
the materials tested; (2) it does not require a knowledge of
terminal settling velocities of the media grains; (3) it has a
simple form and (4) it can be applied to both spherical and
non-spherical media. In addition to the spherical particle
data involving 600 bed expansion measurements compiled
from the literature, the proposed equation has been
developed and tested by using a substantial amount of bed
expansion measurements (332 measurements with spheres
and 1486 separate measurements with beds of non-
spherical particles) carried out during this work.
REFERENCES
Akgiray, O.  Saatc¸ i, A. M. 2001 A new look at filter backwash
hydraulics. Water Sci. Technol.: Water Supply 1(2), 65–72.
Akgiray, O.  Soyer, E. 2006 An evaluation of expansion equations
for fluidized solid-liquid systems. J. Water Supply Res. Technol.
Aqua 55(7–8), 517–526.
Akgiray, O., Soyer, E.  Yuksel, E. 2004 Prediction of filter
expansion during backwashing. Water Sci. Technol.: Water
Supply 4(5–6), 131–138.
Akkoyunlu, A. 2003 Expansion of granular water filters during
backwash. Environ. Eng. Sci. 20(6), 655–665.
AWWA 1990 Water Quality and Treatment, A Handbook of
Community Water Supplies, 4th edition. McGraw-Hill,
New York.
AWWA 1999 Water Quality and Treatment, A Handbook of
Community Water Supplies, 5th edition. McGraw-Hill,
New York, ch 8.
344 E. Soyer and O. Akgiray | Prediction of filter expansion Journal of Water Supply: Research and Technology—AQUA | 58.5 | 2009
Blake, C. F. 1922 The resistance of packing to fluid flow. Trans. Am.
Inst. Chem. Eng. 14, 415.
Cleasby, J. L.  Fan, K. 1981 Predicting fluidization and expansion
of filter media. J. Environ. Eng. Div. ASCE 107(EE3),
455–471.
Couderc, J. P. 1985 Incipient fluidization and particulate systems. In:
Davidson, J. F., Clift, R.  Harrison, D. (eds) Fluidization.
Academic Press, New York, pp. 1–46.
Dharmarajah, A. H. 1982 Effect of Particle Shape on Prediction
of Velocity-Voidage Relationship in Fluidized Solid-Liquid
Systems. Doctoral dissertation, Iowa State Univiversity,
Ames, IA.
Dharmarajah, A. H.  Cleasby, J. L. 1986 Predicting the
expansion behavior of filter media. J. AWWA 78(12),
66–76.
Di Felice, R. 1995 Hydrodynamics of liquid fluidization. Chem. Eng.
Sci. 50(8), 1213–1245.
Droste, R. L. 1997 Theory and Practice of Water and Wastewater
Treatment. John Wiley  Sons, New York, ch 14.
Epstein, N. 2003a Liquid–solid fluidization. In: Yang, W. C. (ed.)
Handbook of Fluidization and Fluid-Particle Systems. Marcel
Dekker, New York, pp. 705–764.
Epstein, N. 2003b Applications of liquid–solid fluidization. Int.
J. Chem. Reactor Eng. 1, 1–16.
Ergun, S. 1952 Fluid flow through packed columns. Chem. Eng.
Prog. 48(2), 89–94.
Fair, G. M., Geyer, J. C.  Okun, D. A. 1971 Elements of Water
Supply and Wastewater Disposal, 2nd edition. John Wiley and
Sons, New York.
Fair, G. M.  Hatch, L. P. 1933 Fundamental factors governing
the stream-line flow of water through sand. J. AWWA
25(11), 1551.
Foust, A. S., Wenzel, L. A., Clump, C. W., Maus, L.  Andersen, L. B.
1960 Principles of Unit Operations corrected 2nd printing. Wiley
International Edition, Japan.
Garside, J.  Al-Dibouni, M. R. 1977 Velocity-voidage relationships
for fluidization and sedimentation in solid-liquid systems. Ind.
Eng. Chem. Process. Des. Dev. 16(2), 206–214.
Geankoplis, C. J. 1993 Transport Processes and Unit Operations, 3rd
edition. Prentice-Hall International, London.
Hartman, M., Havlin, V., Svoboda, K.  Kozan, A. P. 1989
Predicting voidage for particulate fluidization of spheres by
liquids. Chem. Eng. Sci. 44(11), 2770–2775.
Kelly, E. G.  Spottiswood, D. J. 1982 Introduction to Mineral
Processing. John Wiley  Sons, New York, pp. 77–78.
Loeffler, A. L. Jr. 1953 Mechanisms of Hindered Settling and
Fluidization. Doctoral dissertation, Iowa State University of
Science and Technology, Ames, IA.
McCabe, W. L., Smith, J. C.  Harriot, P. 2001 Unit Operations of
Chemical Engineering, 6th edition. McGraw-Hill, New York,
pp. 176–178.
Perry, R. H.  Green, D. 1984 Perry’s Chemical Engineers’
Handbook, 6th edition. McGraw-Hill, New York.
Richardson, J. F.  Meikle, R. A. 1961 Sedimentation and
fluidization part III. Trans. Inst. Chem. Eng. 39, 348–356.
Rutledge, S. O.  Gagnon, G. A. 2002 Assessment of crushed-
recycled glass as filter media for small-scale water treatment
applications. J. Environ. Eng. Sci. 1(5), 349–358.
Uluatam, S. S. 1991 Assessing perlite as a sand substitute in
filtration. J. AWWA 83(6), 70–71.
Wen, C. Y.  Yu, Y. H. 1966 Mechanics of fluidization Chem. Eng.
Prog. Symp. Ser. 62, AIChE, New York.
Wilhelm, R. H.  Kwauk, M. 1948 Fluidization of solid particles.
Chem. Eng. Prog. 44(3), 201–218.
First received 3 December 2008; accepted in revised form 29 January 2009
345 E. Soyer and O. Akgiray | Prediction of filter expansion Journal of Water Supply: Research and Technology—AQUA | 58.5 | 2009

More Related Content

What's hot

Ground water prospects map
Ground water prospects mapGround water prospects map
Ground water prospects map
Thupili Prem Sai Reddy
 
Interception and Depression Storage
Interception and Depression StorageInterception and Depression Storage
Interception and Depression Storage
Hannalee Perdez
 
Hydrology notes
Hydrology notesHydrology notes
Hydrology notes
Mohammad Mohaiminul Islam
 
Seminar on Hydrological modelling
Seminar on Hydrological modellingSeminar on Hydrological modelling
Seminar on Hydrological modelling
vishvam Pancholi
 
Hydrological modelling
Hydrological modellingHydrological modelling
Hydrological modelling
Bharath Viswakarma
 
Different types of flows and lines in fluid flow.
Different types of flows and lines in fluid flow.Different types of flows and lines in fluid flow.
Different types of flows and lines in fluid flow.
Muhammad Bilal
 
Introduction to Groundwater Modelling
Introduction to Groundwater ModellingIntroduction to Groundwater Modelling
Introduction to Groundwater ModellingC. P. Kumar
 
Swat model
Swat model Swat model
Swat model
vishvjeet tholia
 
Use of reed_beds_for_the_treatment_opf_sewage_and_wastewater_from_domestic_ho...
Use of reed_beds_for_the_treatment_opf_sewage_and_wastewater_from_domestic_ho...Use of reed_beds_for_the_treatment_opf_sewage_and_wastewater_from_domestic_ho...
Use of reed_beds_for_the_treatment_opf_sewage_and_wastewater_from_domestic_ho...
Durga Madhab Mahapatra
 
Ch 14-fluid flow through porous media
Ch 14-fluid flow through porous mediaCh 14-fluid flow through porous media
Ch 14-fluid flow through porous media
Syed Atif Iqrar
 
Plain sedimentation tanks sewage
Plain sedimentation tanks  sewagePlain sedimentation tanks  sewage
Plain sedimentation tanks sewage
Dr. M Prasad
 
Fluid Mechanic Lab - Reynold's Number Experiment
Fluid Mechanic Lab - Reynold's Number ExperimentFluid Mechanic Lab - Reynold's Number Experiment
Fluid Mechanic Lab - Reynold's Number Experiment
MuhammadSRaniYah
 
concept of Hydrology
concept of Hydrologyconcept of Hydrology
concept of Hydrology
Parimal Jha
 
Principles of groundwater flow
Principles of groundwater flowPrinciples of groundwater flow
Principles of groundwater flowFritz Lejarso
 
Darcy´s law
Darcy´s lawDarcy´s law
Darcy´s lawNatalia
 
L 8 equalization and proportioning
L  8 equalization and proportioningL  8 equalization and proportioning
L 8 equalization and proportioning
Dr. shrikant jahagirdar
 
IRJET- A Literature Review on Investigation of Design Parameter of Cyclone Se...
IRJET- A Literature Review on Investigation of Design Parameter of Cyclone Se...IRJET- A Literature Review on Investigation of Design Parameter of Cyclone Se...
IRJET- A Literature Review on Investigation of Design Parameter of Cyclone Se...
IRJET Journal
 
Water Quality Modeling for Groundwater, Surface Water, and Watersheds: Basic ...
Water Quality Modeling for Groundwater, Surface Water, and Watersheds: Basic ...Water Quality Modeling for Groundwater, Surface Water, and Watersheds: Basic ...
Water Quality Modeling for Groundwater, Surface Water, and Watersheds: Basic ...
Nebraska Water Center
 

What's hot (20)

Ground water prospects map
Ground water prospects mapGround water prospects map
Ground water prospects map
 
Interception and Depression Storage
Interception and Depression StorageInterception and Depression Storage
Interception and Depression Storage
 
Hydrology notes
Hydrology notesHydrology notes
Hydrology notes
 
Seminar on Hydrological modelling
Seminar on Hydrological modellingSeminar on Hydrological modelling
Seminar on Hydrological modelling
 
Hydrological modelling
Hydrological modellingHydrological modelling
Hydrological modelling
 
Different types of flows and lines in fluid flow.
Different types of flows and lines in fluid flow.Different types of flows and lines in fluid flow.
Different types of flows and lines in fluid flow.
 
Introduction to Groundwater Modelling
Introduction to Groundwater ModellingIntroduction to Groundwater Modelling
Introduction to Groundwater Modelling
 
Swat model
Swat model Swat model
Swat model
 
Use of reed_beds_for_the_treatment_opf_sewage_and_wastewater_from_domestic_ho...
Use of reed_beds_for_the_treatment_opf_sewage_and_wastewater_from_domestic_ho...Use of reed_beds_for_the_treatment_opf_sewage_and_wastewater_from_domestic_ho...
Use of reed_beds_for_the_treatment_opf_sewage_and_wastewater_from_domestic_ho...
 
Ch 14-fluid flow through porous media
Ch 14-fluid flow through porous mediaCh 14-fluid flow through porous media
Ch 14-fluid flow through porous media
 
Plain sedimentation tanks sewage
Plain sedimentation tanks  sewagePlain sedimentation tanks  sewage
Plain sedimentation tanks sewage
 
Fluid Mechanic Lab - Reynold's Number Experiment
Fluid Mechanic Lab - Reynold's Number ExperimentFluid Mechanic Lab - Reynold's Number Experiment
Fluid Mechanic Lab - Reynold's Number Experiment
 
concept of Hydrology
concept of Hydrologyconcept of Hydrology
concept of Hydrology
 
Principles of groundwater flow
Principles of groundwater flowPrinciples of groundwater flow
Principles of groundwater flow
 
Darcy´s law
Darcy´s lawDarcy´s law
Darcy´s law
 
L 8 equalization and proportioning
L  8 equalization and proportioningL  8 equalization and proportioning
L 8 equalization and proportioning
 
IRJET- A Literature Review on Investigation of Design Parameter of Cyclone Se...
IRJET- A Literature Review on Investigation of Design Parameter of Cyclone Se...IRJET- A Literature Review on Investigation of Design Parameter of Cyclone Se...
IRJET- A Literature Review on Investigation of Design Parameter of Cyclone Se...
 
Etp Final Report
Etp Final ReportEtp Final Report
Etp Final Report
 
Exp 2 (A)
Exp 2 (A)Exp 2 (A)
Exp 2 (A)
 
Water Quality Modeling for Groundwater, Surface Water, and Watersheds: Basic ...
Water Quality Modeling for Groundwater, Surface Water, and Watersheds: Basic ...Water Quality Modeling for Groundwater, Surface Water, and Watersheds: Basic ...
Water Quality Modeling for Groundwater, Surface Water, and Watersheds: Basic ...
 

Viewers also liked

1 video entrevista nino con aquamarina
1 video entrevista nino con aquamarina1 video entrevista nino con aquamarina
1 video entrevista nino con aquamarina
Alex Ybarra
 
Fresh & Easy Neighborhood Market vegetarian & vegan shopping list
Fresh & Easy Neighborhood Market vegetarian & vegan shopping listFresh & Easy Neighborhood Market vegetarian & vegan shopping list
Fresh & Easy Neighborhood Market vegetarian & vegan shopping listFresh & Easy Neighborhood Market
 
Cv4356
Cv4356Cv4356
M. de transporte
M. de transporteM. de transporte
M. de transporte
_Ron_
 
20150107150528762
2015010715052876220150107150528762
20150107150528762
nurfaidah faidah
 
JSMS review
JSMS reviewJSMS review
JSMS reviewtown27
 
Saludo de fiestas patrias
Saludo de fiestas patriasSaludo de fiestas patrias
Saludo de fiestas patriasJulio Mendoza
 
DeltaX Social Facebook Ads Buying Platform
DeltaX Social Facebook Ads Buying PlatformDeltaX Social Facebook Ads Buying Platform
DeltaX Social Facebook Ads Buying Platform
Sourabh Agrawal
 
Proyecto dinosaurio
Proyecto dinosaurioProyecto dinosaurio
Proyecto dinosaurioArecha
 
El estudio Nielsen analiza a los nuevos consumidores online | Estrategia Digital
El estudio Nielsen analiza a los nuevos consumidores online | Estrategia DigitalEl estudio Nielsen analiza a los nuevos consumidores online | Estrategia Digital
El estudio Nielsen analiza a los nuevos consumidores online | Estrategia Digital
Oscar García
 
dawanda
dawandadawanda
dawanda
tins01
 
Kun agüero power point
Kun agüero power pointKun agüero power point
Kun agüero power pointMartinito17
 
Advanced Research II
Advanced Research IIAdvanced Research II
Advanced Research II
Tiffini Travis
 
Looking at RAC, GI/Clusterware Diagnostic Tools
Looking at RAC,   GI/Clusterware Diagnostic Tools Looking at RAC,   GI/Clusterware Diagnostic Tools
Looking at RAC, GI/Clusterware Diagnostic Tools
Leighton Nelson
 
Especialista Eventos Deportivos
Especialista Eventos DeportivosEspecialista Eventos Deportivos
Especialista Eventos Deportivos
Instituto Superior de Protocolo y Eventos
 

Viewers also liked (20)

1 video entrevista nino con aquamarina
1 video entrevista nino con aquamarina1 video entrevista nino con aquamarina
1 video entrevista nino con aquamarina
 
Fresh & Easy Neighborhood Market vegetarian & vegan shopping list
Fresh & Easy Neighborhood Market vegetarian & vegan shopping listFresh & Easy Neighborhood Market vegetarian & vegan shopping list
Fresh & Easy Neighborhood Market vegetarian & vegan shopping list
 
Presentacion3
Presentacion3Presentacion3
Presentacion3
 
Operativo
Operativo Operativo
Operativo
 
Cv4356
Cv4356Cv4356
Cv4356
 
Viroc catalogue
Viroc catalogueViroc catalogue
Viroc catalogue
 
M. de transporte
M. de transporteM. de transporte
M. de transporte
 
20150107150528762
2015010715052876220150107150528762
20150107150528762
 
JSMS review
JSMS reviewJSMS review
JSMS review
 
Saludo de fiestas patrias
Saludo de fiestas patriasSaludo de fiestas patrias
Saludo de fiestas patrias
 
DeltaX Social Facebook Ads Buying Platform
DeltaX Social Facebook Ads Buying PlatformDeltaX Social Facebook Ads Buying Platform
DeltaX Social Facebook Ads Buying Platform
 
FORMACIÓN DE DOCENTES TIC
FORMACIÓN DE DOCENTES TICFORMACIÓN DE DOCENTES TIC
FORMACIÓN DE DOCENTES TIC
 
Proyecto dinosaurio
Proyecto dinosaurioProyecto dinosaurio
Proyecto dinosaurio
 
El estudio Nielsen analiza a los nuevos consumidores online | Estrategia Digital
El estudio Nielsen analiza a los nuevos consumidores online | Estrategia DigitalEl estudio Nielsen analiza a los nuevos consumidores online | Estrategia Digital
El estudio Nielsen analiza a los nuevos consumidores online | Estrategia Digital
 
BW technologies certificate
BW technologies certificateBW technologies certificate
BW technologies certificate
 
dawanda
dawandadawanda
dawanda
 
Kun agüero power point
Kun agüero power pointKun agüero power point
Kun agüero power point
 
Advanced Research II
Advanced Research IIAdvanced Research II
Advanced Research II
 
Looking at RAC, GI/Clusterware Diagnostic Tools
Looking at RAC,   GI/Clusterware Diagnostic Tools Looking at RAC,   GI/Clusterware Diagnostic Tools
Looking at RAC, GI/Clusterware Diagnostic Tools
 
Especialista Eventos Deportivos
Especialista Eventos DeportivosEspecialista Eventos Deportivos
Especialista Eventos Deportivos
 

Similar to Bed expansion formula

81202012
8120201281202012
81202012
IJRAT
 
Time Evolution of Density Parameters for Matter and Dark Energy and their Int...
Time Evolution of Density Parameters for Matter and Dark Energy and their Int...Time Evolution of Density Parameters for Matter and Dark Energy and their Int...
Time Evolution of Density Parameters for Matter and Dark Energy and their Int...
IJASRD Journal
 
A new universal formula for atoms, planets, and galaxies
A new universal formula for atoms, planets, and galaxiesA new universal formula for atoms, planets, and galaxies
A new universal formula for atoms, planets, and galaxies
IOSR Journals
 
2006 34
2006 342006 34
2006 34
Ngoc NK
 
Exact Solutions of Axially Symmetric Bianchi Type-I Cosmological Model in Lyr...
Exact Solutions of Axially Symmetric Bianchi Type-I Cosmological Model in Lyr...Exact Solutions of Axially Symmetric Bianchi Type-I Cosmological Model in Lyr...
Exact Solutions of Axially Symmetric Bianchi Type-I Cosmological Model in Lyr...
IOSR Journals
 
About Modelling of the Gravitational Fields
About Modelling of the Gravitational FieldsAbout Modelling of the Gravitational Fields
About Modelling of the Gravitational Fields
ijrap
 
Technical NoteSoil Compressibility Models for a Wide Stres.docx
Technical NoteSoil Compressibility Models for a Wide Stres.docxTechnical NoteSoil Compressibility Models for a Wide Stres.docx
Technical NoteSoil Compressibility Models for a Wide Stres.docx
ssuserf9c51d
 
Five-Dimensional Cosmological Model with Time-Dependent G and Lamda for Const...
Five-Dimensional Cosmological Model with Time-Dependent G and Lamda for Const...Five-Dimensional Cosmological Model with Time-Dependent G and Lamda for Const...
Five-Dimensional Cosmological Model with Time-Dependent G and Lamda for Const...
IOSR Journals
 
232372441 correlation-and-prediction-of-vle-and-lle-by-empirical-eos
232372441 correlation-and-prediction-of-vle-and-lle-by-empirical-eos232372441 correlation-and-prediction-of-vle-and-lle-by-empirical-eos
232372441 correlation-and-prediction-of-vle-and-lle-by-empirical-eos
John Barry
 
Pressure head fractal dimension for characterizing shajara reservoirs of the ...
Pressure head fractal dimension for characterizing shajara reservoirs of the ...Pressure head fractal dimension for characterizing shajara reservoirs of the ...
Pressure head fractal dimension for characterizing shajara reservoirs of the ...
Khalid Al-Khidir
 
D0561416
D0561416D0561416
D0561416
IOSR Journals
 
76201951
7620195176201951
76201951
IJRAT
 
Zone of flow establishment in turbulent jets
Zone of flow establishment in turbulent jetsZone of flow establishment in turbulent jets
Zone of flow establishment in turbulent jetsChristos Kotsalos
 
Cold molecular gas_in_merger_remmants_formation_of_molecular_gas_disks
Cold molecular gas_in_merger_remmants_formation_of_molecular_gas_disksCold molecular gas_in_merger_remmants_formation_of_molecular_gas_disks
Cold molecular gas_in_merger_remmants_formation_of_molecular_gas_disks
Sérgio Sacani
 
Cold Molecular Gas in Merger Remnants. I. Formation of Molecular Gas Discs
Cold Molecular Gas in Merger Remnants. I. Formation of Molecular Gas DiscsCold Molecular Gas in Merger Remnants. I. Formation of Molecular Gas Discs
Cold Molecular Gas in Merger Remnants. I. Formation of Molecular Gas DiscsGOASA
 
Critical Overview of Some Pumping Test Analysis Equations
Critical Overview of Some Pumping Test Analysis EquationsCritical Overview of Some Pumping Test Analysis Equations
Critical Overview of Some Pumping Test Analysis Equations
Scientific Review SR
 
Critical Overview of Some Pumping Test Analysis Equations
Critical Overview of Some Pumping Test Analysis EquationsCritical Overview of Some Pumping Test Analysis Equations
Critical Overview of Some Pumping Test Analysis Equations
Scientific Review SR
 
The Population of the Galactic Center Filaments: Position Angle Distribution ...
The Population of the Galactic Center Filaments: Position Angle Distribution ...The Population of the Galactic Center Filaments: Position Angle Distribution ...
The Population of the Galactic Center Filaments: Position Angle Distribution ...
Sérgio Sacani
 

Similar to Bed expansion formula (20)

81202012
8120201281202012
81202012
 
Time Evolution of Density Parameters for Matter and Dark Energy and their Int...
Time Evolution of Density Parameters for Matter and Dark Energy and their Int...Time Evolution of Density Parameters for Matter and Dark Energy and their Int...
Time Evolution of Density Parameters for Matter and Dark Energy and their Int...
 
A new universal formula for atoms, planets, and galaxies
A new universal formula for atoms, planets, and galaxiesA new universal formula for atoms, planets, and galaxies
A new universal formula for atoms, planets, and galaxies
 
E0731929
E0731929E0731929
E0731929
 
2006 34
2006 342006 34
2006 34
 
Exact Solutions of Axially Symmetric Bianchi Type-I Cosmological Model in Lyr...
Exact Solutions of Axially Symmetric Bianchi Type-I Cosmological Model in Lyr...Exact Solutions of Axially Symmetric Bianchi Type-I Cosmological Model in Lyr...
Exact Solutions of Axially Symmetric Bianchi Type-I Cosmological Model in Lyr...
 
About Modelling of the Gravitational Fields
About Modelling of the Gravitational FieldsAbout Modelling of the Gravitational Fields
About Modelling of the Gravitational Fields
 
Technical NoteSoil Compressibility Models for a Wide Stres.docx
Technical NoteSoil Compressibility Models for a Wide Stres.docxTechnical NoteSoil Compressibility Models for a Wide Stres.docx
Technical NoteSoil Compressibility Models for a Wide Stres.docx
 
Five-Dimensional Cosmological Model with Time-Dependent G and Lamda for Const...
Five-Dimensional Cosmological Model with Time-Dependent G and Lamda for Const...Five-Dimensional Cosmological Model with Time-Dependent G and Lamda for Const...
Five-Dimensional Cosmological Model with Time-Dependent G and Lamda for Const...
 
232372441 correlation-and-prediction-of-vle-and-lle-by-empirical-eos
232372441 correlation-and-prediction-of-vle-and-lle-by-empirical-eos232372441 correlation-and-prediction-of-vle-and-lle-by-empirical-eos
232372441 correlation-and-prediction-of-vle-and-lle-by-empirical-eos
 
Pressure head fractal dimension for characterizing shajara reservoirs of the ...
Pressure head fractal dimension for characterizing shajara reservoirs of the ...Pressure head fractal dimension for characterizing shajara reservoirs of the ...
Pressure head fractal dimension for characterizing shajara reservoirs of the ...
 
D0561416
D0561416D0561416
D0561416
 
76201951
7620195176201951
76201951
 
Zone of flow establishment in turbulent jets
Zone of flow establishment in turbulent jetsZone of flow establishment in turbulent jets
Zone of flow establishment in turbulent jets
 
apj_825_1_40
apj_825_1_40apj_825_1_40
apj_825_1_40
 
Cold molecular gas_in_merger_remmants_formation_of_molecular_gas_disks
Cold molecular gas_in_merger_remmants_formation_of_molecular_gas_disksCold molecular gas_in_merger_remmants_formation_of_molecular_gas_disks
Cold molecular gas_in_merger_remmants_formation_of_molecular_gas_disks
 
Cold Molecular Gas in Merger Remnants. I. Formation of Molecular Gas Discs
Cold Molecular Gas in Merger Remnants. I. Formation of Molecular Gas DiscsCold Molecular Gas in Merger Remnants. I. Formation of Molecular Gas Discs
Cold Molecular Gas in Merger Remnants. I. Formation of Molecular Gas Discs
 
Critical Overview of Some Pumping Test Analysis Equations
Critical Overview of Some Pumping Test Analysis EquationsCritical Overview of Some Pumping Test Analysis Equations
Critical Overview of Some Pumping Test Analysis Equations
 
Critical Overview of Some Pumping Test Analysis Equations
Critical Overview of Some Pumping Test Analysis EquationsCritical Overview of Some Pumping Test Analysis Equations
Critical Overview of Some Pumping Test Analysis Equations
 
The Population of the Galactic Center Filaments: Position Angle Distribution ...
The Population of the Galactic Center Filaments: Position Angle Distribution ...The Population of the Galactic Center Filaments: Position Angle Distribution ...
The Population of the Galactic Center Filaments: Position Angle Distribution ...
 

Recently uploaded

一比一原版(UMich毕业证)密歇根大学|安娜堡分校毕业证成绩单专业办理
一比一原版(UMich毕业证)密歇根大学|安娜堡分校毕业证成绩单专业办理一比一原版(UMich毕业证)密歇根大学|安娜堡分校毕业证成绩单专业办理
一比一原版(UMich毕业证)密歇根大学|安娜堡分校毕业证成绩单专业办理
zwunae
 
Sachpazis:Terzaghi Bearing Capacity Estimation in simple terms with Calculati...
Sachpazis:Terzaghi Bearing Capacity Estimation in simple terms with Calculati...Sachpazis:Terzaghi Bearing Capacity Estimation in simple terms with Calculati...
Sachpazis:Terzaghi Bearing Capacity Estimation in simple terms with Calculati...
Dr.Costas Sachpazis
 
An Approach to Detecting Writing Styles Based on Clustering Techniques
An Approach to Detecting Writing Styles Based on Clustering TechniquesAn Approach to Detecting Writing Styles Based on Clustering Techniques
An Approach to Detecting Writing Styles Based on Clustering Techniques
ambekarshweta25
 
Harnessing WebAssembly for Real-time Stateless Streaming Pipelines
Harnessing WebAssembly for Real-time Stateless Streaming PipelinesHarnessing WebAssembly for Real-time Stateless Streaming Pipelines
Harnessing WebAssembly for Real-time Stateless Streaming Pipelines
Christina Lin
 
Literature Review Basics and Understanding Reference Management.pptx
Literature Review Basics and Understanding Reference Management.pptxLiterature Review Basics and Understanding Reference Management.pptx
Literature Review Basics and Understanding Reference Management.pptx
Dr Ramhari Poudyal
 
Industrial Training at Shahjalal Fertilizer Company Limited (SFCL)
Industrial Training at Shahjalal Fertilizer Company Limited (SFCL)Industrial Training at Shahjalal Fertilizer Company Limited (SFCL)
Industrial Training at Shahjalal Fertilizer Company Limited (SFCL)
MdTanvirMahtab2
 
一比一原版(Otago毕业证)奥塔哥大学毕业证成绩单如何办理
一比一原版(Otago毕业证)奥塔哥大学毕业证成绩单如何办理一比一原版(Otago毕业证)奥塔哥大学毕业证成绩单如何办理
一比一原版(Otago毕业证)奥塔哥大学毕业证成绩单如何办理
dxobcob
 
Hierarchical Digital Twin of a Naval Power System
Hierarchical Digital Twin of a Naval Power SystemHierarchical Digital Twin of a Naval Power System
Hierarchical Digital Twin of a Naval Power System
Kerry Sado
 
Governing Equations for Fundamental Aerodynamics_Anderson2010.pdf
Governing Equations for Fundamental Aerodynamics_Anderson2010.pdfGoverning Equations for Fundamental Aerodynamics_Anderson2010.pdf
Governing Equations for Fundamental Aerodynamics_Anderson2010.pdf
WENKENLI1
 
Modelagem de um CSTR com reação endotermica.pdf
Modelagem de um CSTR com reação endotermica.pdfModelagem de um CSTR com reação endotermica.pdf
Modelagem de um CSTR com reação endotermica.pdf
camseq
 
14 Template Contractual Notice - EOT Application
14 Template Contractual Notice - EOT Application14 Template Contractual Notice - EOT Application
14 Template Contractual Notice - EOT Application
SyedAbiiAzazi1
 
PPT on GRP pipes manufacturing and testing
PPT on GRP pipes manufacturing and testingPPT on GRP pipes manufacturing and testing
PPT on GRP pipes manufacturing and testing
anoopmanoharan2
 
Top 10 Oil and Gas Projects in Saudi Arabia 2024.pdf
Top 10 Oil and Gas Projects in Saudi Arabia 2024.pdfTop 10 Oil and Gas Projects in Saudi Arabia 2024.pdf
Top 10 Oil and Gas Projects in Saudi Arabia 2024.pdf
Teleport Manpower Consultant
 
6th International Conference on Machine Learning & Applications (CMLA 2024)
6th International Conference on Machine Learning & Applications (CMLA 2024)6th International Conference on Machine Learning & Applications (CMLA 2024)
6th International Conference on Machine Learning & Applications (CMLA 2024)
ClaraZara1
 
Forklift Classes Overview by Intella Parts
Forklift Classes Overview by Intella PartsForklift Classes Overview by Intella Parts
Forklift Classes Overview by Intella Parts
Intella Parts
 
Design and Analysis of Algorithms-DP,Backtracking,Graphs,B&B
Design and Analysis of Algorithms-DP,Backtracking,Graphs,B&BDesign and Analysis of Algorithms-DP,Backtracking,Graphs,B&B
Design and Analysis of Algorithms-DP,Backtracking,Graphs,B&B
Sreedhar Chowdam
 
AKS UNIVERSITY Satna Final Year Project By OM Hardaha.pdf
AKS UNIVERSITY Satna Final Year Project By OM Hardaha.pdfAKS UNIVERSITY Satna Final Year Project By OM Hardaha.pdf
AKS UNIVERSITY Satna Final Year Project By OM Hardaha.pdf
SamSarthak3
 
Final project report on grocery store management system..pdf
Final project report on grocery store management system..pdfFinal project report on grocery store management system..pdf
Final project report on grocery store management system..pdf
Kamal Acharya
 
Cosmetic shop management system project report.pdf
Cosmetic shop management system project report.pdfCosmetic shop management system project report.pdf
Cosmetic shop management system project report.pdf
Kamal Acharya
 
NUMERICAL SIMULATIONS OF HEAT AND MASS TRANSFER IN CONDENSING HEAT EXCHANGERS...
NUMERICAL SIMULATIONS OF HEAT AND MASS TRANSFER IN CONDENSING HEAT EXCHANGERS...NUMERICAL SIMULATIONS OF HEAT AND MASS TRANSFER IN CONDENSING HEAT EXCHANGERS...
NUMERICAL SIMULATIONS OF HEAT AND MASS TRANSFER IN CONDENSING HEAT EXCHANGERS...
ssuser7dcef0
 

Recently uploaded (20)

一比一原版(UMich毕业证)密歇根大学|安娜堡分校毕业证成绩单专业办理
一比一原版(UMich毕业证)密歇根大学|安娜堡分校毕业证成绩单专业办理一比一原版(UMich毕业证)密歇根大学|安娜堡分校毕业证成绩单专业办理
一比一原版(UMich毕业证)密歇根大学|安娜堡分校毕业证成绩单专业办理
 
Sachpazis:Terzaghi Bearing Capacity Estimation in simple terms with Calculati...
Sachpazis:Terzaghi Bearing Capacity Estimation in simple terms with Calculati...Sachpazis:Terzaghi Bearing Capacity Estimation in simple terms with Calculati...
Sachpazis:Terzaghi Bearing Capacity Estimation in simple terms with Calculati...
 
An Approach to Detecting Writing Styles Based on Clustering Techniques
An Approach to Detecting Writing Styles Based on Clustering TechniquesAn Approach to Detecting Writing Styles Based on Clustering Techniques
An Approach to Detecting Writing Styles Based on Clustering Techniques
 
Harnessing WebAssembly for Real-time Stateless Streaming Pipelines
Harnessing WebAssembly for Real-time Stateless Streaming PipelinesHarnessing WebAssembly for Real-time Stateless Streaming Pipelines
Harnessing WebAssembly for Real-time Stateless Streaming Pipelines
 
Literature Review Basics and Understanding Reference Management.pptx
Literature Review Basics and Understanding Reference Management.pptxLiterature Review Basics and Understanding Reference Management.pptx
Literature Review Basics and Understanding Reference Management.pptx
 
Industrial Training at Shahjalal Fertilizer Company Limited (SFCL)
Industrial Training at Shahjalal Fertilizer Company Limited (SFCL)Industrial Training at Shahjalal Fertilizer Company Limited (SFCL)
Industrial Training at Shahjalal Fertilizer Company Limited (SFCL)
 
一比一原版(Otago毕业证)奥塔哥大学毕业证成绩单如何办理
一比一原版(Otago毕业证)奥塔哥大学毕业证成绩单如何办理一比一原版(Otago毕业证)奥塔哥大学毕业证成绩单如何办理
一比一原版(Otago毕业证)奥塔哥大学毕业证成绩单如何办理
 
Hierarchical Digital Twin of a Naval Power System
Hierarchical Digital Twin of a Naval Power SystemHierarchical Digital Twin of a Naval Power System
Hierarchical Digital Twin of a Naval Power System
 
Governing Equations for Fundamental Aerodynamics_Anderson2010.pdf
Governing Equations for Fundamental Aerodynamics_Anderson2010.pdfGoverning Equations for Fundamental Aerodynamics_Anderson2010.pdf
Governing Equations for Fundamental Aerodynamics_Anderson2010.pdf
 
Modelagem de um CSTR com reação endotermica.pdf
Modelagem de um CSTR com reação endotermica.pdfModelagem de um CSTR com reação endotermica.pdf
Modelagem de um CSTR com reação endotermica.pdf
 
14 Template Contractual Notice - EOT Application
14 Template Contractual Notice - EOT Application14 Template Contractual Notice - EOT Application
14 Template Contractual Notice - EOT Application
 
PPT on GRP pipes manufacturing and testing
PPT on GRP pipes manufacturing and testingPPT on GRP pipes manufacturing and testing
PPT on GRP pipes manufacturing and testing
 
Top 10 Oil and Gas Projects in Saudi Arabia 2024.pdf
Top 10 Oil and Gas Projects in Saudi Arabia 2024.pdfTop 10 Oil and Gas Projects in Saudi Arabia 2024.pdf
Top 10 Oil and Gas Projects in Saudi Arabia 2024.pdf
 
6th International Conference on Machine Learning & Applications (CMLA 2024)
6th International Conference on Machine Learning & Applications (CMLA 2024)6th International Conference on Machine Learning & Applications (CMLA 2024)
6th International Conference on Machine Learning & Applications (CMLA 2024)
 
Forklift Classes Overview by Intella Parts
Forklift Classes Overview by Intella PartsForklift Classes Overview by Intella Parts
Forklift Classes Overview by Intella Parts
 
Design and Analysis of Algorithms-DP,Backtracking,Graphs,B&B
Design and Analysis of Algorithms-DP,Backtracking,Graphs,B&BDesign and Analysis of Algorithms-DP,Backtracking,Graphs,B&B
Design and Analysis of Algorithms-DP,Backtracking,Graphs,B&B
 
AKS UNIVERSITY Satna Final Year Project By OM Hardaha.pdf
AKS UNIVERSITY Satna Final Year Project By OM Hardaha.pdfAKS UNIVERSITY Satna Final Year Project By OM Hardaha.pdf
AKS UNIVERSITY Satna Final Year Project By OM Hardaha.pdf
 
Final project report on grocery store management system..pdf
Final project report on grocery store management system..pdfFinal project report on grocery store management system..pdf
Final project report on grocery store management system..pdf
 
Cosmetic shop management system project report.pdf
Cosmetic shop management system project report.pdfCosmetic shop management system project report.pdf
Cosmetic shop management system project report.pdf
 
NUMERICAL SIMULATIONS OF HEAT AND MASS TRANSFER IN CONDENSING HEAT EXCHANGERS...
NUMERICAL SIMULATIONS OF HEAT AND MASS TRANSFER IN CONDENSING HEAT EXCHANGERS...NUMERICAL SIMULATIONS OF HEAT AND MASS TRANSFER IN CONDENSING HEAT EXCHANGERS...
NUMERICAL SIMULATIONS OF HEAT AND MASS TRANSFER IN CONDENSING HEAT EXCHANGERS...
 

Bed expansion formula

  • 1. A new simple equation for the prediction of filter expansion during backwashing Elif Soyer and Omer Akgiray ABSTRACT Elif Soyer (corresponding author) Department of Environmental Engineering, Istanbul Technical University, Maslak-Istanbul, Turkey Tel.: +90 212 285 6785 Fax: +90 212 285 3781 E-mail: esoyer@ins.itu.edu.tr Omer Akgiray Department of Environmental Engineering, Marmara University, Goztepe-Istanbul, Turkey Fluidization experiments have been carried out with glass spheres, plastic spheres and several sieved fractions of silica sand, garnet sand, perlite and crushed glass. The effect of particle shape on expansion behavior is investigated. Sphericity as determined using the Ergun equation and fixed-bed head loss data is employed to quantify the shape effect. It is found that the influence of particle shape depends on the Reynolds number based on backwash velocity. A new equation that accounts for particle shape is proposed. For the materials studied, the proposed equation gives excellent agreement with both the spherical and the non-spherical particle data. Key words | backwash, filter media, fluidization, particle shape, sphericity, water treatment INTRODUCTION AND THEORY Liquid–solid fluidization has a number of applications in engineering (Epstein 2003b). The expansion of granular filter media during backwashing is of particular interest (Droste 1997; AWWA 1999; Akkoyunlu 2003). It is impor- tant to have an understanding of fluidization principles and an ability to predict bed expansion as a function of liquid velocity to design such systems properly. More often than not, the media involved are not spherical and it is necessary to have an expansion model that can be applied to beds of non-spherical particles. Numerous equations have been proposed to predict the expansion of liquid fluidized beds of spheres. Reviews and listings of such equations can be found in Garside & Al-Dibouni (1977), Couderc (1985), Hartman et al. (1989), Di Felice (1995) and Epstein (2003a). An evaluation of these equations has recently been presented by Akgiray & Soyer (2006). Very few general equations exist, however, for non- spherical media (Cleasby & Fan 1981; Dharmarajah & Cleasby 1986; Akgiray & Saatc¸ i, 2001; Akkoyunlu 2003; Akgiray et al. 2004). Furthermore, the accuracies of the expansion models for non-spherical media have not been evaluated in a satisfactory manner to date. Akgiray & Soyer (2006) noted that, while most expan- sion models are strictly restricted to spheres, a correlation method explained by Richardson & Meikle (1961) may be generalized to handle non-spherical media. In this approach, a dimensionless friction factor f is plotted against a modified Reynolds number Re1. The friction factor is defined as follows: f ¼ R r V 1 2 ð1Þ where R ¼ force per unit area of grains, r ¼ density of the fluid, 1 ¼ porosity of the bed and V ¼ fluid velocity based on the empty cross section of the bed. The porosity 1 for the fluidized bed is calculated by the relation L(1 2 1) ¼ L0(1 2 10), where L ¼ depth of the fluidized bed, L0 ¼ depth of the fixed bed and 10 ¼ fixed-bed porosity. Equation (1) holds for both fixed and fluidized beds. For a fluidized bed under steady state conditions, the upward frictional force on the particles is balanced by the effective gravitational force. The net gravitational force is the weight of the particles less the upward force attributable doi: 10.2166/aqua.2009.090 336 Q IWA Publishing 2009 Journal of Water Supply: Research and Technology—AQUA | 58.5 | 2009
  • 2. to the buoyancy of the suspension. Therefore, Equation (1) takes the following form for fluidized beds under steady state conditions: f ¼ 13 ðrp 2 rÞg r Sp Vp V2 ¼ 13 ðrp 2 rÞgcdeq 6rV2 ð2Þ Here, Sp/Vp ¼ 6/(cdeq) is the specific surface of the grains, SP ¼ particle surface area, VP ¼ particle volume, rp ¼ particle density, deq ¼ equivalent diameter defined as the diameter of the sphere with the same volume as the particle, c ¼ sphericity defined as the surface area of the equivalent volume sphere divided by the actual surface area of the particle and g ¼ gravitational acceleration. The definition of Re1 uses interstitial velocity V/1 for the characteristic velocity and the mean hydraulic radius 1/((Sp/Vp)(1 2 1)) for the characteristic linear dimension (Blake 1922): Re1 ¼ V 1 1 ðSp=VpÞð1 2 1Þ r m ¼ cdeqrV 6mð1 2 1Þ ð3Þ where m ¼ viscosity of the fluid. Richardson Meikle (1961) plotted f as a function of the modified Reynolds number Re1 to correlate sedimentation and fluidization data for spheres. To simplify calculations when V is not known a priori, Richardson Meikle (1961) introduced a dimensionless group w to be used instead of the friction factor f: w ¼ fRe2 1 ¼ 13 ð1 2 1Þ2 c3 deq 3 rðrp 2 rÞg 216m2 ð4Þ Establishing a quantitative relationship between w and Re1 allows the prediction of expanded bed porosity 1 as a function of fluid properties (viscosity m, density r), media properties (sphericity c, size deq, density rp) and hydraulic loading rate (V ¼ Q/A). Once the porosity (1) is calculated, expanded bed height L can be computed using the relation L(1 2 1) ¼ L0(1 2 10) with a knowledge of initial porosity 10 and initial bed height L0. In certain problems, the desired expanded bed height L is given and the corresponding backwash velocity is to be calculated. In this case, the calculations proceed as follows. The porosity 1 is first calculated from the expanded bed height L using the relation L(1 2 1) ¼ L0(1 2 10), and this value of porosity is inserted into the definitions of Re1 (Equation (3)) and w (Equation (4)). The relation between w and Re1 is then employed to calculate the velocity V. Depending on the relation (graphical or mathematical) between w and Re1, one or both of these two types of calculation may require trial-and-error solutions. It has been noted that the Fair–Hatch fluidization Equation (Fair Hatch 1933) and the Ergun Equation (Ergun 1952)–the latter when applied to fluidized beds– are actually correlations relating w and Re1 (Akgiray Saatc¸ i 2001): w ¼ kRe1 ð5Þ w ¼ k1Re1 þ k2Re2 1 ð6Þ A number of authors have suggested the application of one or the other of these two equations to the fluidization of non-spherical media (Fair Hatch 1933; Foust et al. 1960; Kelly Spottiswood 1982; Geankoplis 1993; McCabe et al. 2001; Akgiray Saatc¸ i 2001). It seems plausible that these equations are applicable to both spherical and non- spherical media for the following reasons: (1) the defi- nitions of Re1 and w include the sphericity parameter (cf Equations (3) and (4)), and therefore the particle shape appears to be accounted for in these equations and (2) the corresponding Equations (the Blake–Kozeny and Ergun equations) for fixed beds are generally accepted to be applicable to both spherical and non-spherical media. Recent research has shown, however, that when fluidized non-spherical media are considered, the value of the group w is not uniquely fixed when Re1 is fixed and the effect of shape has to be accounted for explicitly and independently. This is explained in what follows. While Richardson Meikle considered only spheres (i.e. the case c ¼ 1), Dharmarajah Cleasby (1986) considered the possibility of applying this method of correlation to non-spherical media. They have analyzed the data for fluidized spheres published by Wilhelm Kwauk (1948) and Loeffler (1953) and the non-spherical particle data obtained by Cleasby Fan (1981) and Dharmarajah (1982) to develop the following piecewise correlation: For Re1 , 0:2 : w ¼ 3:01Re1 ð7aÞ 337 E. Soyer and O. Akgiray | Prediction of filter expansion Journal of Water Supply: Research and Technology—AQUA | 58.5 | 2009
  • 3. For Re1 . 0:2 : log w ¼ 0:56543 þ 1:09348 log Re1 þ 0:17979ðlog Re1Þ2 2 0:00392ðlog Re1Þ4 2 1:5ðlog cÞ2 ð7bÞ It is noteworthy that this piecewise correlation has been included in the last two editions of AWWA’s Water Quality Handbook (AWWA 1990, 1999) and probably represents the “state-of-the-art” for the expansion of non-spherical media (Droste 1997). An important experimental finding in the work by Dharmarajah Cleasby (1986) was that, when w versus Re1 values were plotted, fluidization data for non-spherical media deviated from the trend-line of the spherical particle data. Akgiray et al. (2004) tested this finding using new data with silica sand and crushed glass. They verified that the non-spherical particle data do indeed deviate from the trend-line for spheres, but they also reported that the effect of shape is not well represented by the term 1.5(log c)2 in Equation (7b). A number of shortcomings of Equation (7a) and (7b) were also documented by Akgiray et al. (2004). More recently, Akgiray Soyer (2006) presented a new equation to remedy these shortcomings. They have used the same spherical particle data utilized by Dharmarajah Cleasby (1986) plus the spherical particle data by Wen Yu (1966) and Hartman et al. (1989) to develop the coefficients in their equation: w ¼ k1Re1 þ k2ReP 1 ð8Þ The following values were obtained: k1 ¼ 3.137, k2 ¼ 0.673 and P ¼ 1.766 (r 2 ¼ 0.99897, based on 600 data points). When attention is restricted to spheres, Equation (8) has a number of important advantages over Equation (7a) and (7b) (Akgiray Soyer 2006). As it stands, Equation (8) is applicable to spheres only. Based on the finding by Dharmarajah Cleasby (1986) that the data (log c values) for non-spherical particles fall below the trend-line for spheres by a distance 1.5 (log c)2 , this term could be subtracted from the logarithm of the right-hand side of Equation (8) to obtain an equation applicable to non-spherical particles as well. However, Akgiray et al. (2004) reported new data using silica sand and crushed glass and noted that the effect of shape was stronger than that predicted by the term 1.5 (log c)2 . Furthermore, the shape effect (as taken into account by such an additional term) was observed to depend on the modified Reynolds number. A new equation, however, was not presented in that paper to quantify the dependence of the shape effect on the Reynolds number and the sphericity. In addition to reporting a significant amount of additional experimental data, this paper presents an amendment of Equation (8) based on an analysis of the mentioned non-spherical particle data. The current paper focuses on single-medium beds consisting of uniform (i.e. single size) grains. If an accurate model for the expansion of a uniform bed is available, the expansion of a non-uniform bed can also be predicted: A bed with a size gradation is considered to consist of several layers of approximately uniform size according to the sieve analysis data, and the expansion of each layer is separately calculated. The total expansion is calculated by adding the expansions of all the layers (Fair et al. 1971; AWWA 1999). This calculation method can also be used to predict the total expansion of a multimedia bed. EXPERIMENTAL In the first part of this work (Akgiray Soyer 2006), fluidization experiments were carried out with glass balls of eight different sizes and plastic balls of three different sizes (Table 1). To assess the effect of particle shape, new experiments have been carried out with ten sieved fractions of silica sand, eleven sieved fractions of crushed glass, five sieved fractions of perlite and four sieved fractions of garnet sand (Table 2). Perlite and crushed glass are of interest as they are possible substitutes for silica sand in rapid filters (Uluatam 1991; Rutledge Gagnon 2002). Their properties (densities and sphericities) are different than those of silica sand and, as such, they provide additional fluidization data useful for model development and testing. Data for four fractions of crushed glass were reported in earlier work (Akgiray et al. 2004). To obtain additional fractions of this material, crushed glass retained in the topmost sieve tray was crushed again and sieved. In this manner sufficient quantities of seven additional fractions of crushed glass 338 E. Soyer and O. Akgiray | Prediction of filter expansion Journal of Water Supply: Research and Technology—AQUA | 58.5 | 2009
  • 4. were obtained. Glass fractions obtained by repeated crush- ing and sieving were observed to have higher sphericity values. Using this procedure, several crushed glass fractions with approximately the same size and density but different sphericities were produced. This allowed the collection of additional fluidization data to investigate the effect of shape on expansion behavior. The silica sand, perlite, garnet and crushed glass fractions were obtained by a rigorous manual sieving procedure followed by an additional 1 min of manual sieving such that the change in weight during the latter was less than 1% for each fraction. Densities were measured by a water-displacement technique. Equivalent diameters have been measured by counting and weighing 200 grains of each fraction. Diameters of the spheres were also measured with a micrometer and excellent agreement with the counting-weighing method was observed. Following earlier investigators (Cleasby Fan 1981; Dharmarajah Cleasby 1986; Akgiray et al. 2004), sphericity of each material was determined by measuring the fixed-bed head loss (h) for each fraction and using the Ergun Equation (Ergun 1952): h L0 ¼ k1m rg ð1 2 10Þ2 13 0 6 cdeq !2 V þ k2 g ð1 2 10Þ 13 0 6 cdeq ! V2 ð9Þ This equation can be rearranged as a quadratic equation in sphericity c: h L0 c2 2 k2 g ð1 2 10Þ 13 0 6 deq ! V2 # c 2 k1m rg ð1 2 10Þ2 13 0 6 deq !2 V 2 4 3 5 ¼ 0 ð10Þ Once the quantities within the square brackets are measured, the sphericity is determined by using the well- known quadratic formula. Table 2 | Properties of the non-spherical media used in the fluidization experiments (crushed glass fractions marked ( p ) were obtained by repeated crushing and sieving) Particle type Density rp (g/cm3 ) deq (mm) Sphericity, c Silica sand 0.355 £ 0.50 2.646 0.50 0.710 Silica sand 0.50 £ 0.59 2.647 0.60 0.777 Silica sand 0.50 £ 0.60 2.649 0.65 0.794 Silica sand 0.59 £ 0.60 2.651 0.68 0.788 Silica sand 0.59 £ 0.70 2.653 0.73 0.772 Silica sand 0.70 £ 0.84 2.640 0.84 0.757 Silica sand 0.84 £ 1.00 2.639 1.02 0.738 Silica sand 1.00 £ 1.19 2.641 1.11 0.706 Silica sand 1.19 £ 1.41 2.628 1.40 0.714 Silica sand 1.41 £ 1.68 2.629 1.65 0.723 Crushed glass 0.84 £ 1.00 2.486 0.92 0.413 Crushed glass 1.18 £ 1.41 2.494 1.24 0.442 Crushed glass 1.41 £ 1.68 2.496 1.48 0.430 Crushed glass 2.00 £ 2.38 2.499 2.08 0.415 Crushed glass 0.70 £ 0.84 ( p ) 2.490 0.77 0.530 Crushed glass 0.84 £ 1.00 ( p ) 2.497 0.98 0.516 Crushed glass 1.00 £ 1.18 ( p ) 2.497 1.13 0.548 Crushed glass 1.18 £ 1.41 ( p ) 2.496 1.34 0.515 Crushed glass 1.41 £ 1.68 ( p ) 2.503 1.62 0.564 Crushed glass 1.68 £ 2.00 ( p ) 2.501 1.82 0.559 Crushed glass 2.00 £ 2.38 ( p ) 2.499 2.21 0.624 Perlite 0.70 £ 0.84 2.335 0.85 0.652 Perlite 0.84 £ 1.00 2.331 1.07 0.645 Perlite 1.00 £ 1.18 2.332 1.22 0.664 Perlite 1.18 £ 1.41 2.328 1.41 0.651 Perlite 1.41 £ 1.68 2.326 1.65 0.682 Garnet 0.21 £ 0.25 4.393 0.245 0.845 Garnet 0.21 £ 0.25 4.124 0.241 0.817 Garnet 0.177 £ 0.21 4.420 0.220 0.856 Garnet 0.177 £ 0.21 4.107 0.208 0.800 Table 1 | Properties of the spherical media used in the fluidization experiments Particle type rp (g/cm3 ) d (mm) Glass balls 2.519 1.11 Glass balls 2.494 1.19 Glass balls 2.529 2.03 Glass balls 2.494 3.18 Glass balls 2.532 2.99 Glass balls 2.499 4.03 Glass balls 2.529 4.98 Glass balls 2.527 6.01 Plastic balls 1.171 1.97 Plastic balls 1.193 2.48 Plastic balls 1.180 2.87 339 E. Soyer and O. Akgiray | Prediction of filter expansion Journal of Water Supply: Research and Technology—AQUA | 58.5 | 2009
  • 5. The sphericity values reported in Table 2 are the mean values for several measurements. Head loss measurements were carried out with extreme care to make sure that bed height (and porosity) did not change and that air bubbles did not accumulate within the bed during the experiments. Accumulation of small air bubbles, in particular, decreases porosity (volume fraction available for flow) and may completely invalidate head-loss measurements. For the eleven different sizes of glass and plastic balls, the calculated sphericities were always very close to 1.0. This finding, in addition to showing that the Ergun equation is very accurate for fixed beds of spheres for the range of Reynolds numbers used in this study, provided a check of the validity of head-loss measurements and sphericity determinations carried out in the current work. The properties of the media are summarized in Tables 1 and 2. Fluidization experiments were carried out using tap water. Initial bed height L0 was recorded before each fluidization experiment. Temperature, flow rate Q and bed expansion L were recorded during each experiment. Viscosity and density of water at different temperatures were obtained from the literature (Perry Green 1984). In earlier work, a 40 cm high column with an internal diameter of 38 mm was employed (Akgiray et al. 2004). The new data presented here were obtained using a 152 cm high column with an internal diameter of 50.5 mm. The use of the larger column allowed collecting data at higher expansions and over a greater range of Reynolds numbers and porosities. Porosities were calculated from bed weight, bed height and density values. Wall effects were estimated using an empirical formula based on Loeffler’s data (Loeffler 1953) as explained in previous work (Akgiray Soyer 2006). In this approach, the ratio of corrected velocity to actual velocity V0/V is calculated from media properties and column diameter. Here V0 is the backwash velocity required to attain the same porosity in an infinitely large container as velocity V would produce in a container of diameter D. The corrected velocity (V0) values were used to plot and analyze the results. Although wall-effect corrections were always applied, it should be added that these corr- ections were quite small as the ratio V0/V remained in the range 1.01–1.03 in all the experiments carried out in this work. Experimental porosities were calculated from measured expansion heights using the relation L(1 2 1) ¼ L0(1 2 10). The corrected velocities and calculated experimental por- osities were then used together with fluid and particle properties to calculate Re1 (Equation (3)) and w (Equation (4)) values. RESULTS AND DISCUSSION Two sample sets of data are shown in Figures 1 and 2. Percent expansion versus backwash velocity is plotted in these figures: Percent expansion ¼ 100 ðL 2 L0Þ L0 ð11Þ Also shown (dashed line) are the percent expansions predicted using the Dharmarajah–Cleasby correlation (Equation (7a) and (7b)). The solid lines have been obtained with the new Equation (14) explained in the next section. These model lines were calculated as follows: values of fluid properties (m, r), media properties (c, deq, rp) and velocity (V) were inserted into the expressions for Re1 (Equation (3)) and w (Equation (4)). The corresponding theoretical porosity value was next calculated by inserting the expressions for Re1 and w into either Equation (7a) and (7b) or Equation (14) and then solving the resulting nonlinear algebraic equation for porosity by means of an iterative scheme. Once the theoretical porosity is deter- mined, percent expansion is next calculated using Equation (11) and the relation L(1 2 1) ¼ L0(1 2 10). Results similar Figure 1 | Bed expansion versus velocity for the 1.00 £ 1.19 mm silica sand (c ¼ 0.706). 340 E. Soyer and O. Akgiray | Prediction of filter expansion Journal of Water Supply: Research and Technology—AQUA | 58.5 | 2009
  • 6. to Figures 1 and 2 were obtained for each of the materials in Table 2. As noted earlier, the Dharmarajah–Cleasby correlation is considered to be the “state-of-the-art” for the prediction of filter bed expansion (Droste 1997; AWWA 1999). This correlation is mentioned and used in the discussion and evaluation of the results obtained here for the following reasons: (1) since it is widely used, its accuracy needs to be evaluated and this is accomplished presently; (2) it is used here as a basis of comparison because, to be useful, any new correlation should be simpler and/or more accurate than this correlation; (3) Equations (5) and (6) are no longer mentioned, as it has already been established that they are restricted to spheres and to limited ranges of Reynolds numbers and (4) other correlations proposed for non- spherical media require additional and difficult-to-obtain information such as settling velocities (Cleasby Fan 1981). Prediction of settling velocities for non-spherical particles is notoriously unreliable (Kelly Spottiswood 1982) and therefore additional tedious experiments would be required to obtain such information. Expansion correlations that require a knowledge of settling velocities have therefore been excluded from consideration in this work. In evaluating the results of fluidization experiments, it is important to consider percent expansions (as in Figures 1 and 2), and not just porosities. This is because: (1) in many practical applications, percent expansion and expanded bed height are the quantities of direct interest and (2) errors in predicted values of bed height and percent expansion may be concealed when only porosities are considered. In Figure 1, for example, the measured porosity at the rightmost point (V ¼ 0.1 m/s) is 0.90, whereas Equation (7a) and (7b) predicts 1 ¼ 0.94. Percent error in porosity is then 100 £ (0.94 2 0.90)/0.90 ¼ 4.3%, whereas the percent error in predicted percent expansion is 100 £ (857 2 466)/ 466 ¼ 84%. Obviously, this error is unacceptably high. This issue is further discussed in earlier work (Akgiray Soyer 2006). Figures 3–7 display the non-spherical particle data collected in this work. The data for spheres were previously presented (Akgiray Soyer 2006). The lines labeled “spheres” in Figures 3–7 were obtained using Equation (8) which represents the spherical particle data very accurately. The following are concluded: (1) while the Dharmarajah–Cleasby correlation (Equation (7a) and (7b)) is quite accurate for spheres, it consistently over-predicts the expansion of beds of non-spherical media and, in general, it is not accurate for such media: its deviation from the data increases as sphericity decreases; (2) when log w versus log Re1 values are plotted, non-spherical particle data deviate from the trend-line of the spherical particle data. This deviation increases as sphericity decreases; (3) the observed deviation is larger than that predicted by the term 1.5 (log c)2 and (4) careful examination of the data shows that the mentioned deviation depends on the Reynolds number as well. THE NEW EQUATION Equation (8) was developed in earlier work (Akgiray Soyer 2006) using spherical particle data (600 separate measurements) from the literature and further tested using the data (332 measurements with the spheres listed Figure 2 | Bed expansion versus velocity for the 0.70 £ 0.84 mm re-crushed glass (c ¼ 0.530). Figure 3 | Data collected in this work for the four fractions of once-crushed glass. 341 E. Soyer and O. Akgiray | Prediction of filter expansion Journal of Water Supply: Research and Technology—AQUA | 58.5 | 2009
  • 7. in Table 1) collected in the first phase of this work. For the range of Reynolds numbers and porosities spanned by the mentioned data (21.96 , log Re1 , 3.54 and 0.37 , 1 , 0.90), Equation (8) has been found to be more accurate than all of the existing popular correlations (for details, see Akgiray Soyer (2006)). Based on the findings of previous work (Akgiray et al. 2004) and the large number of new measurements presented here, it is concluded that when log w versus log Re1 values are plotted, the non- spherical particle data deviate from the trend-line of the spherical particle data, and the magnitude of this deviation depends on both the sphericity and the Reynolds number. The following equation form has therefore been adopted in this work: logw ¼ log 3:137 Re1 þ 0:673 Re1:766 1 þ hðRe1; cÞ ð12Þ Here h ¼ h(Re1, c) is a function of Re1 and c, and it must satisfy the condition h(Re1, c ¼ 1) ¼ 0. That is, the second term in Equation (12) vanishes for spheres. Note that Equation (12) is developed by adding a term to Equation (8) and that it reverts to Equation (8) for spheres Numerous different expressions for h were tested and the following expression has been found to represent the data very accurately: hðRe1; cÞ ¼ ða þ b log Re1Þð2log cÞc ð13Þ It should be emphasized that several different and more complicated expressions were also tested, but no significant improvement in accuracy over Equation (13) could be obtained by the use of more complex expressions and a larger number of adjustable coefficients. Equation (13) is arguably the simplest form conceivable for the function h(Re1, c), as it assumes a linear dependence on log Re1 and a simple proportionality to a power of log c, while at the same time satisfying the condition h(Re1, 1) ¼ 0. A non- linear regression analysis has been carried out using the non-spherical particle data collected in this work to determine the best values of a, b and c. The following values are obtained: a ¼ 20.930, b ¼ 20.274 and c ¼ 1.262 Figure 4 | Data for the seven re-crushed glass fractions (marked by ( p ) in Table 2). Figure 5 | Data for the ten fractions of silica sand. Figure 6 | Data for the four fractions of garnet sand. Figure 7 | Data for the five fractions of perlite. 342 E. Soyer and O. Akgiray | Prediction of filter expansion Journal of Water Supply: Research and Technology—AQUA | 58.5 | 2009
  • 8. with r 2 ¼ 0.995. Inserting these values, the following final equation is obtained, applicable to both spherical and non- spherical beds of particles: log w ¼ log 3:137 Re1 þ 0:673 Re1:766 1 2 ð0:930 þ 0:274 log Re1Þð2log cÞ1:262 ð14Þ The accuracy of this equation can be seen by inspecting Table 3 and Figures 8 and 9. Table 3 shows the mean error values obtained with Equations (7a), (7b) and (14). The mean error values for spheres are based on 332 measure- ments made in the first phase of this work plus 600 measurements collected from the literature (Akgiray Soyer 2006). It is seen that the Dharmarajah–Cleasby correlation (Equation (7a) and (7b)) and the proposed Equation (14) are both very accurate for spheres. It should be noted, however, that Equation (14) is considerably simpler in form. For non-spherical materials, Equation (14) is again very accurate, whereas the use of the Dharmar- ajah–Cleasby correlation leads to rather large errors. When all the non-spherical particle data (1486 separate measure- ments) are considered together, the mean errors for Equation (7a) and (7b) and Equation (14) are 4.46% and 1.83%, respectively. The corresponding mean percent errors in predicted percent expansions are 39.0% (Equation (7a) and (7b)) and 13.7% (Equation (14)), respectively. The rows of Table 3 show that the Dharmarajah–Cleasby correlation deteriorates rapidly as sphericity decreases. Figure 8 displays experimental versus predicted porosity values. Percent expansion values are shown in Figure 9. These two figures are based on all the non-spherical particle data collected in this work, i.e. 1486 measurements with the materials listed in Table 2. It is again observed that the proposed equation is considerably more accurate. The deviation of the Dharmarajah–Cleasby correlation from experimental data increases as porosity and percent expansion increase. The difference in the accuracies of the two correlations can be seen more clearly in Figure 9. APPLICABILITY OF THE NEW EQUATION Equation (14) is applicable to commonly used rapid filter media in the range of all backwash velocities that Figure 8 | Experimental porosity versus predicted porosity for the non-spherical particle data collected in this work. Table 3 | Percent errors in the predicted values of porosity for the data collected in this work Material Mean error with Equation (7a) and (7b) Mean error with Equation (14) Silica sand 3.74 1.96 Garnet 4.40 3.73 Perlite 4.09 1.20 Glass crushed once 9.21 3.99 All glass fractions 6.24 2.36 All non-spherical media 4.46 1.83 Spheres 2.35 2.26 Figure 9 | Experimental percent expansion versus predicted expansion for the non- spherical particle data collected in this work. 343 E. Soyer and O. Akgiray | Prediction of filter expansion Journal of Water Supply: Research and Technology—AQUA | 58.5 | 2009
  • 9. may conceivably be employed in practice. The equation, however, is not limited to filter backwashing and it may be prudent here to discuss the limitations on its application in the context of liquid–solid fluidization in general. Non-spherical particle data used to develop and test this equation span the following parameter ranges: 0.40 , 1 , 0.90,20.76 , log Re1 , 2.51 (0.17 , Re1 , 326), 0.40 , c , 1.0. The limitations of Equation (14) can therefore be stated as follows. (i) Equation (14) should not be used for porosity values larger than about 0.90. This limitation is relevant for all correlations based on the fixed-bed friction factor concept, e.g. the Fair–Hatch equation, the Ergun equation and the Dharmarajah– Cleasby correlation (Akgiray Saatc¸ i 2001). As a matter of fact, it is generally accepted that expansion behavior of fluidized beds change at about 1 ¼ 0.85–0.90 and—what- ever the method of correlation used is—a different equation is usually specified for higher expansions (Dharmarajah Cleasby 1986; Di Felice 1995). (ii) Equation (14) is based on Equation (8) which, in turn, was developed and tested using data in the range 21.96 , log Re1 , 3.54, whereas the non-spherical particle data used in this work span the range 20.76 , log Re1 , 2.51. The accuracy of Equation (14) outside these ranges of Reynolds numbers has not been evaluated. (iii) The shape correction term is based on data with c . 0.4: Extreme shapes, such as needles, and flat objects, such as flakes, have not been studied. For most practical applications, these limitations will not prevent the use of Equation (14). Porosities remain well below 0.90, for example, during filter backwashing. Similarly, during backwashing rapid filter media, it can be shown that Reynolds numbers are well inside the stated range. Furthermore, the sphericities of all the commonly used rapid filter media are reported to be above about 0.45 (AWWA 1999). (iv) It is also possible to insert 1 ¼ 1mf in Equation (14) to get an estimate of the minimum fluidiza- tion velocity Vmf. Epstein (2003a) noted that, because expansion equations are usually correlations based on a whole range of porosity values (from 1mf to very high 1 values), they are likely to be less accurate at the 1mf extremity than an equation which is tailored to this extremity. It is therefore recommended that Equation (14) is applied at bed expansions above about 10% and a specialized equation be used if the value of Vmf is desired. SUMMARY AND CONCLUSIONS Fluidization experiments have been carried out with glass balls, plastic balls and carefully sieved fractions of silica sand, garnet sand, perlite and crushed glass to ascertain the effect of shape on expansion behavior. Sphericity of each material was determined using fixed-bed head loss data in conjunction with the Ergun equation. For all the materials studied, sphericity values calculated using fixed-bed head loss measurements and the Ergun equation allowed successful prediction of the effect of particle shape on bed expansion during fluidization. The non-spherical particle data fall below the curve for spheres on the friction factor versus the modified Reynolds number diagram. A new equation is developed using the non-spherical particle data collected in this work. The equation has the following advantages: (1) it has been found to be very accurate for all the materials tested; (2) it does not require a knowledge of terminal settling velocities of the media grains; (3) it has a simple form and (4) it can be applied to both spherical and non-spherical media. In addition to the spherical particle data involving 600 bed expansion measurements compiled from the literature, the proposed equation has been developed and tested by using a substantial amount of bed expansion measurements (332 measurements with spheres and 1486 separate measurements with beds of non- spherical particles) carried out during this work. REFERENCES Akgiray, O. Saatc¸ i, A. M. 2001 A new look at filter backwash hydraulics. Water Sci. Technol.: Water Supply 1(2), 65–72. Akgiray, O. Soyer, E. 2006 An evaluation of expansion equations for fluidized solid-liquid systems. J. Water Supply Res. Technol. Aqua 55(7–8), 517–526. Akgiray, O., Soyer, E. Yuksel, E. 2004 Prediction of filter expansion during backwashing. Water Sci. Technol.: Water Supply 4(5–6), 131–138. Akkoyunlu, A. 2003 Expansion of granular water filters during backwash. Environ. Eng. Sci. 20(6), 655–665. AWWA 1990 Water Quality and Treatment, A Handbook of Community Water Supplies, 4th edition. McGraw-Hill, New York. AWWA 1999 Water Quality and Treatment, A Handbook of Community Water Supplies, 5th edition. McGraw-Hill, New York, ch 8. 344 E. Soyer and O. Akgiray | Prediction of filter expansion Journal of Water Supply: Research and Technology—AQUA | 58.5 | 2009
  • 10. Blake, C. F. 1922 The resistance of packing to fluid flow. Trans. Am. Inst. Chem. Eng. 14, 415. Cleasby, J. L. Fan, K. 1981 Predicting fluidization and expansion of filter media. J. Environ. Eng. Div. ASCE 107(EE3), 455–471. Couderc, J. P. 1985 Incipient fluidization and particulate systems. In: Davidson, J. F., Clift, R. Harrison, D. (eds) Fluidization. Academic Press, New York, pp. 1–46. Dharmarajah, A. H. 1982 Effect of Particle Shape on Prediction of Velocity-Voidage Relationship in Fluidized Solid-Liquid Systems. Doctoral dissertation, Iowa State Univiversity, Ames, IA. Dharmarajah, A. H. Cleasby, J. L. 1986 Predicting the expansion behavior of filter media. J. AWWA 78(12), 66–76. Di Felice, R. 1995 Hydrodynamics of liquid fluidization. Chem. Eng. Sci. 50(8), 1213–1245. Droste, R. L. 1997 Theory and Practice of Water and Wastewater Treatment. John Wiley Sons, New York, ch 14. Epstein, N. 2003a Liquid–solid fluidization. In: Yang, W. C. (ed.) Handbook of Fluidization and Fluid-Particle Systems. Marcel Dekker, New York, pp. 705–764. Epstein, N. 2003b Applications of liquid–solid fluidization. Int. J. Chem. Reactor Eng. 1, 1–16. Ergun, S. 1952 Fluid flow through packed columns. Chem. Eng. Prog. 48(2), 89–94. Fair, G. M., Geyer, J. C. Okun, D. A. 1971 Elements of Water Supply and Wastewater Disposal, 2nd edition. John Wiley and Sons, New York. Fair, G. M. Hatch, L. P. 1933 Fundamental factors governing the stream-line flow of water through sand. J. AWWA 25(11), 1551. Foust, A. S., Wenzel, L. A., Clump, C. W., Maus, L. Andersen, L. B. 1960 Principles of Unit Operations corrected 2nd printing. Wiley International Edition, Japan. Garside, J. Al-Dibouni, M. R. 1977 Velocity-voidage relationships for fluidization and sedimentation in solid-liquid systems. Ind. Eng. Chem. Process. Des. Dev. 16(2), 206–214. Geankoplis, C. J. 1993 Transport Processes and Unit Operations, 3rd edition. Prentice-Hall International, London. Hartman, M., Havlin, V., Svoboda, K. Kozan, A. P. 1989 Predicting voidage for particulate fluidization of spheres by liquids. Chem. Eng. Sci. 44(11), 2770–2775. Kelly, E. G. Spottiswood, D. J. 1982 Introduction to Mineral Processing. John Wiley Sons, New York, pp. 77–78. Loeffler, A. L. Jr. 1953 Mechanisms of Hindered Settling and Fluidization. Doctoral dissertation, Iowa State University of Science and Technology, Ames, IA. McCabe, W. L., Smith, J. C. Harriot, P. 2001 Unit Operations of Chemical Engineering, 6th edition. McGraw-Hill, New York, pp. 176–178. Perry, R. H. Green, D. 1984 Perry’s Chemical Engineers’ Handbook, 6th edition. McGraw-Hill, New York. Richardson, J. F. Meikle, R. A. 1961 Sedimentation and fluidization part III. Trans. Inst. Chem. Eng. 39, 348–356. Rutledge, S. O. Gagnon, G. A. 2002 Assessment of crushed- recycled glass as filter media for small-scale water treatment applications. J. Environ. Eng. Sci. 1(5), 349–358. Uluatam, S. S. 1991 Assessing perlite as a sand substitute in filtration. J. AWWA 83(6), 70–71. Wen, C. Y. Yu, Y. H. 1966 Mechanics of fluidization Chem. Eng. Prog. Symp. Ser. 62, AIChE, New York. Wilhelm, R. H. Kwauk, M. 1948 Fluidization of solid particles. Chem. Eng. Prog. 44(3), 201–218. First received 3 December 2008; accepted in revised form 29 January 2009 345 E. Soyer and O. Akgiray | Prediction of filter expansion Journal of Water Supply: Research and Technology—AQUA | 58.5 | 2009