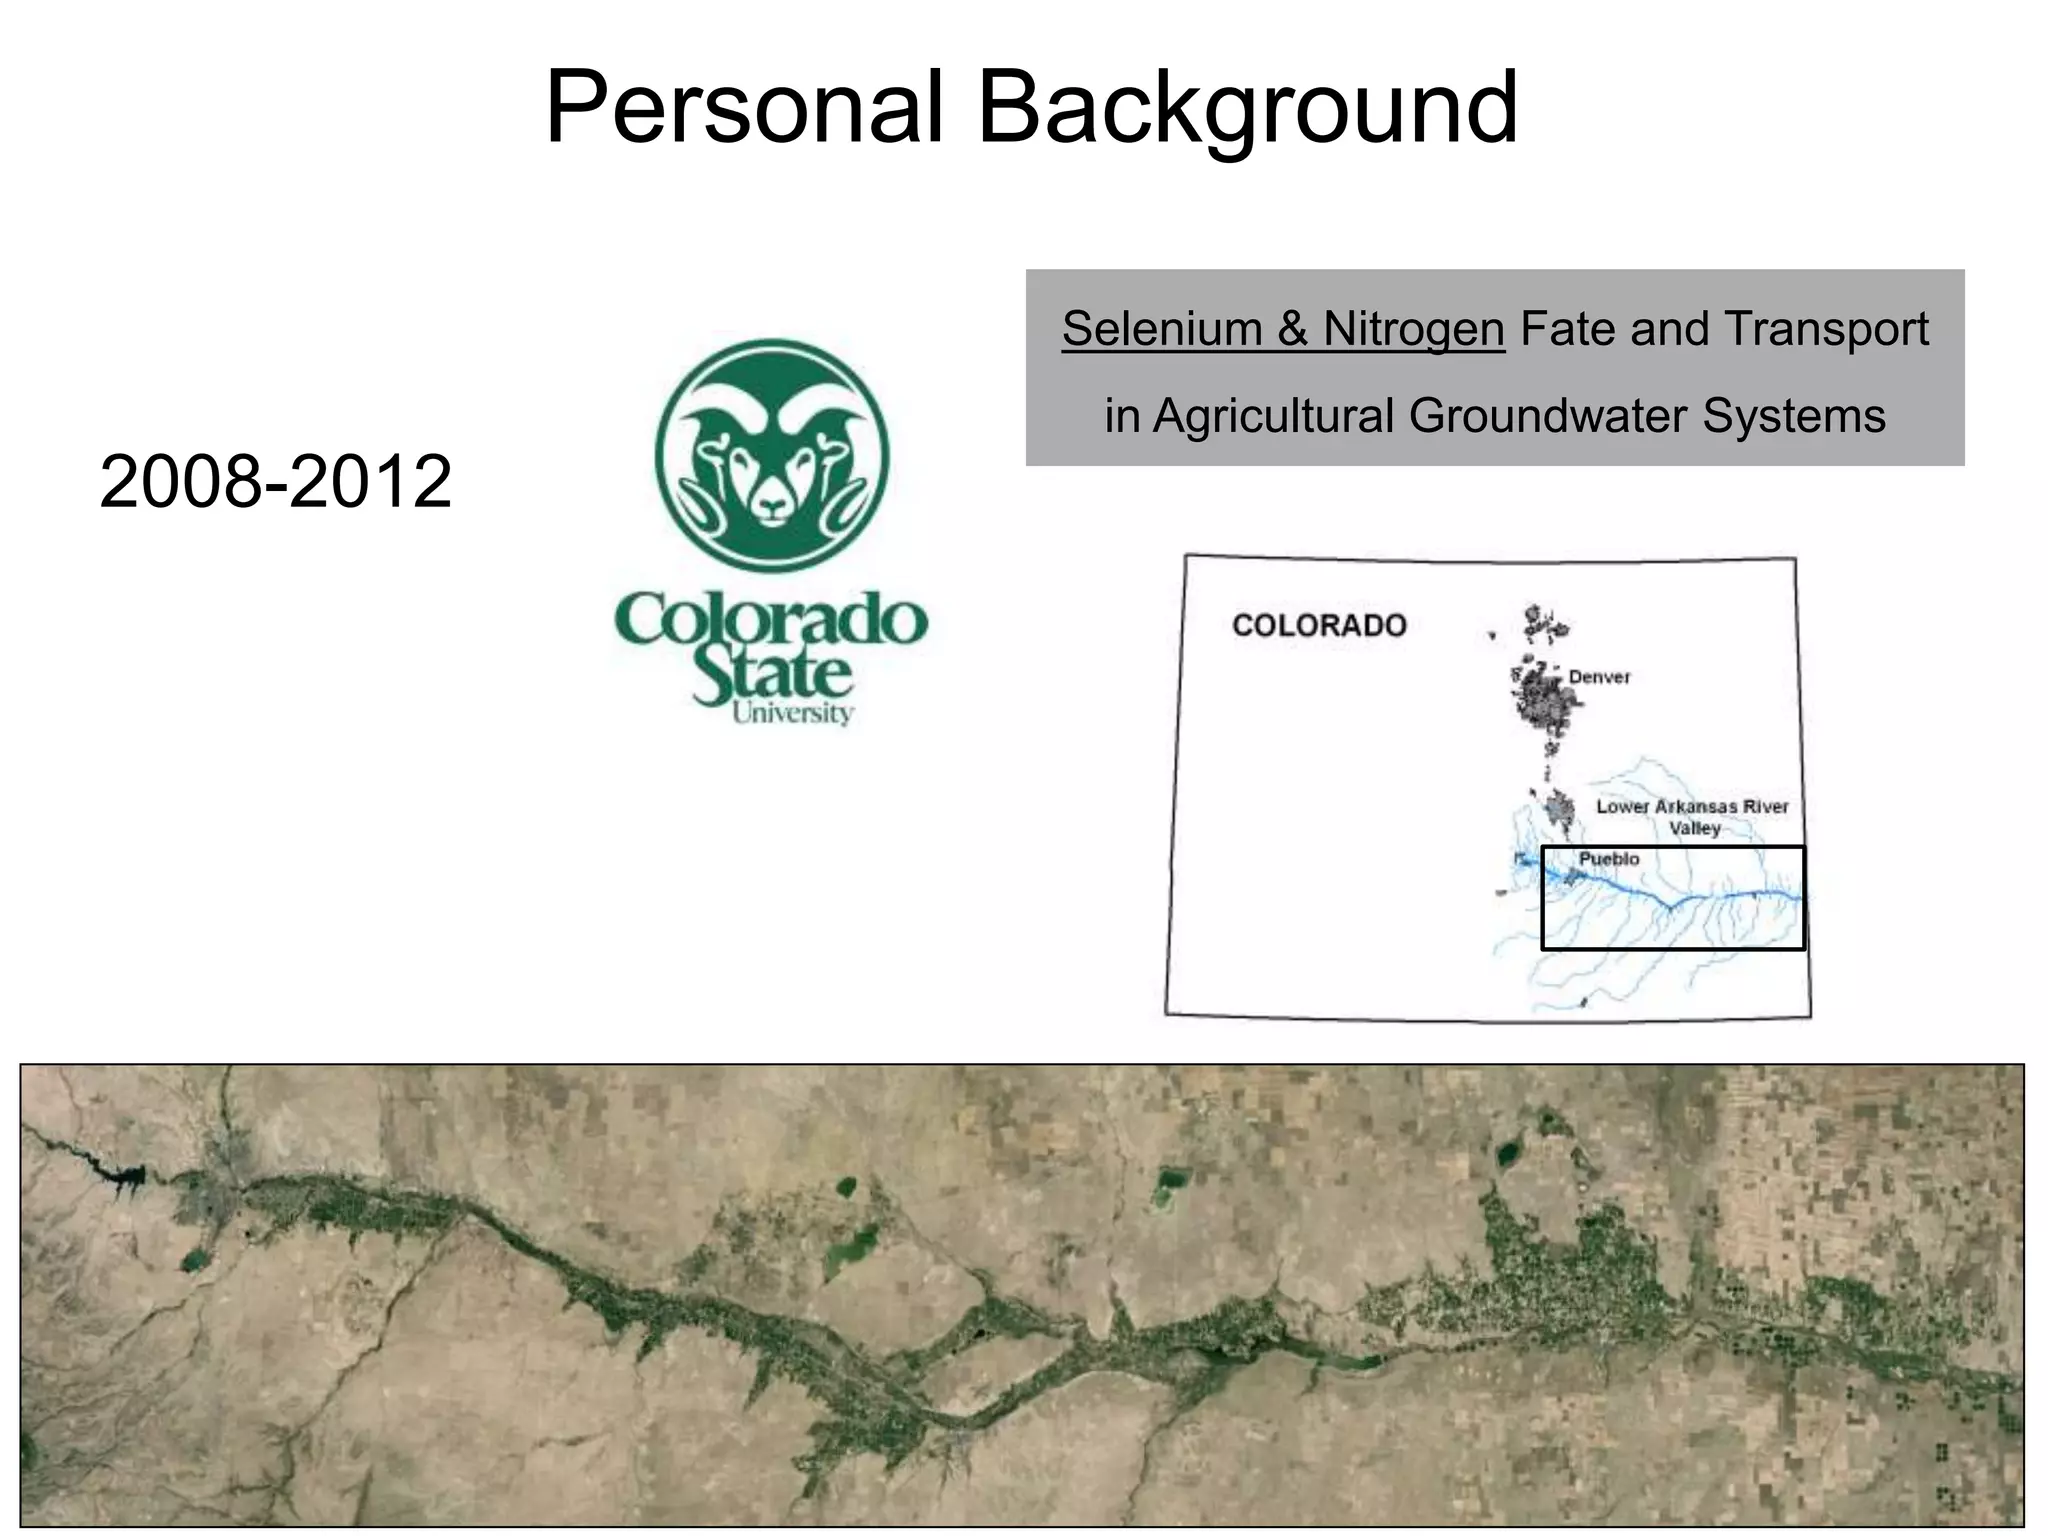
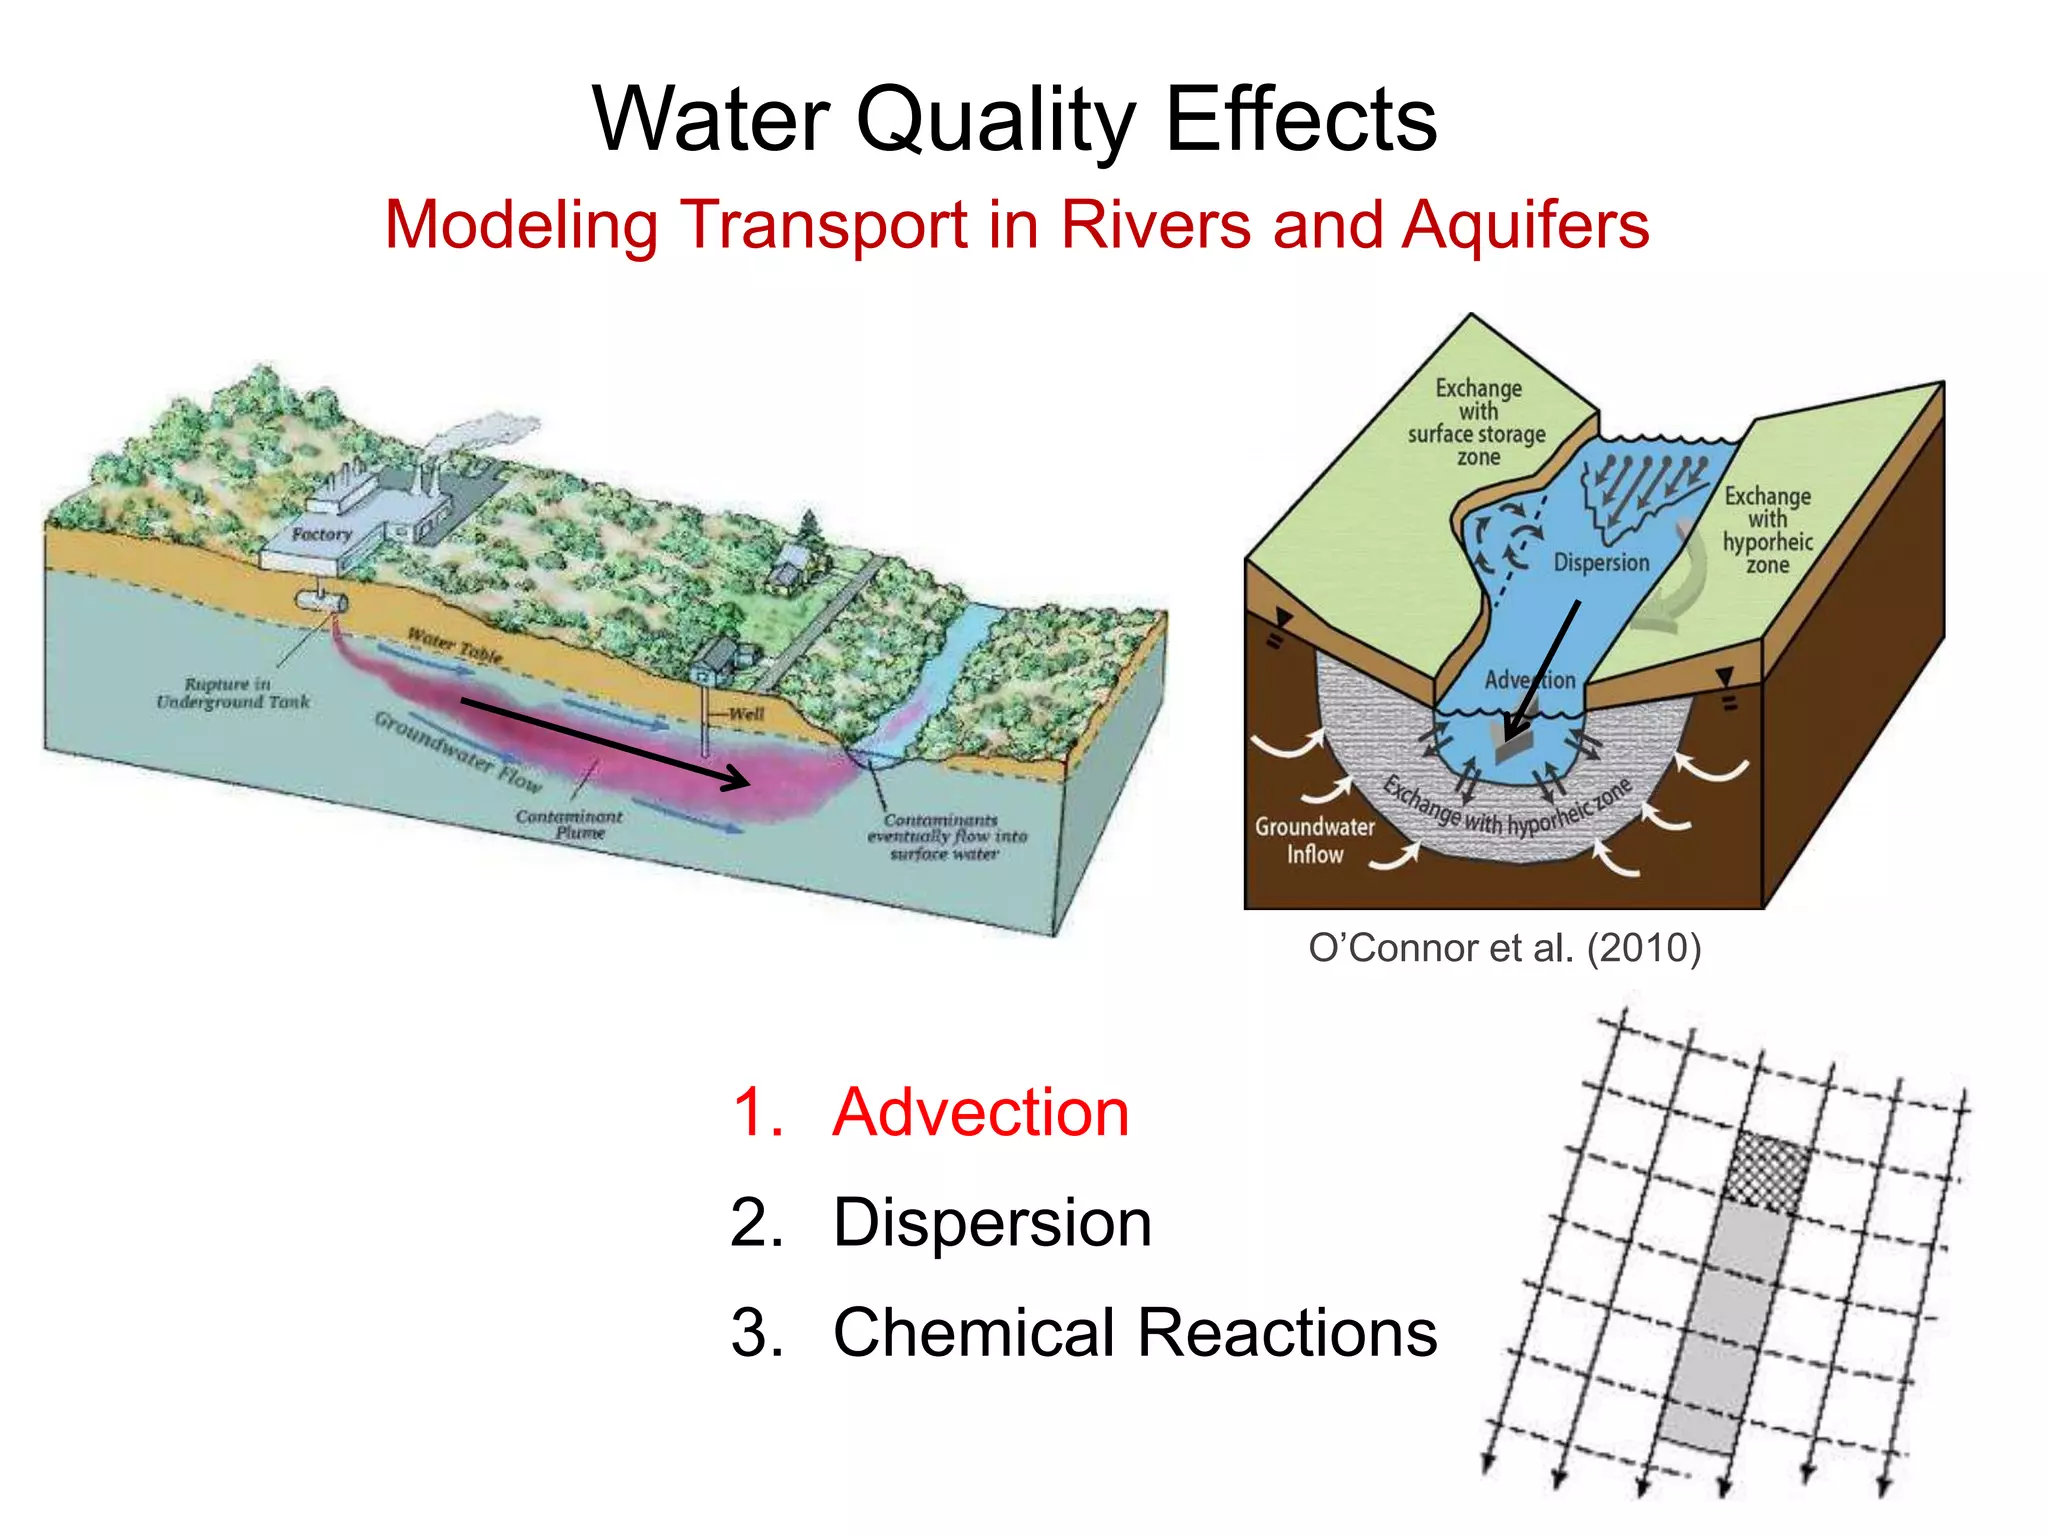
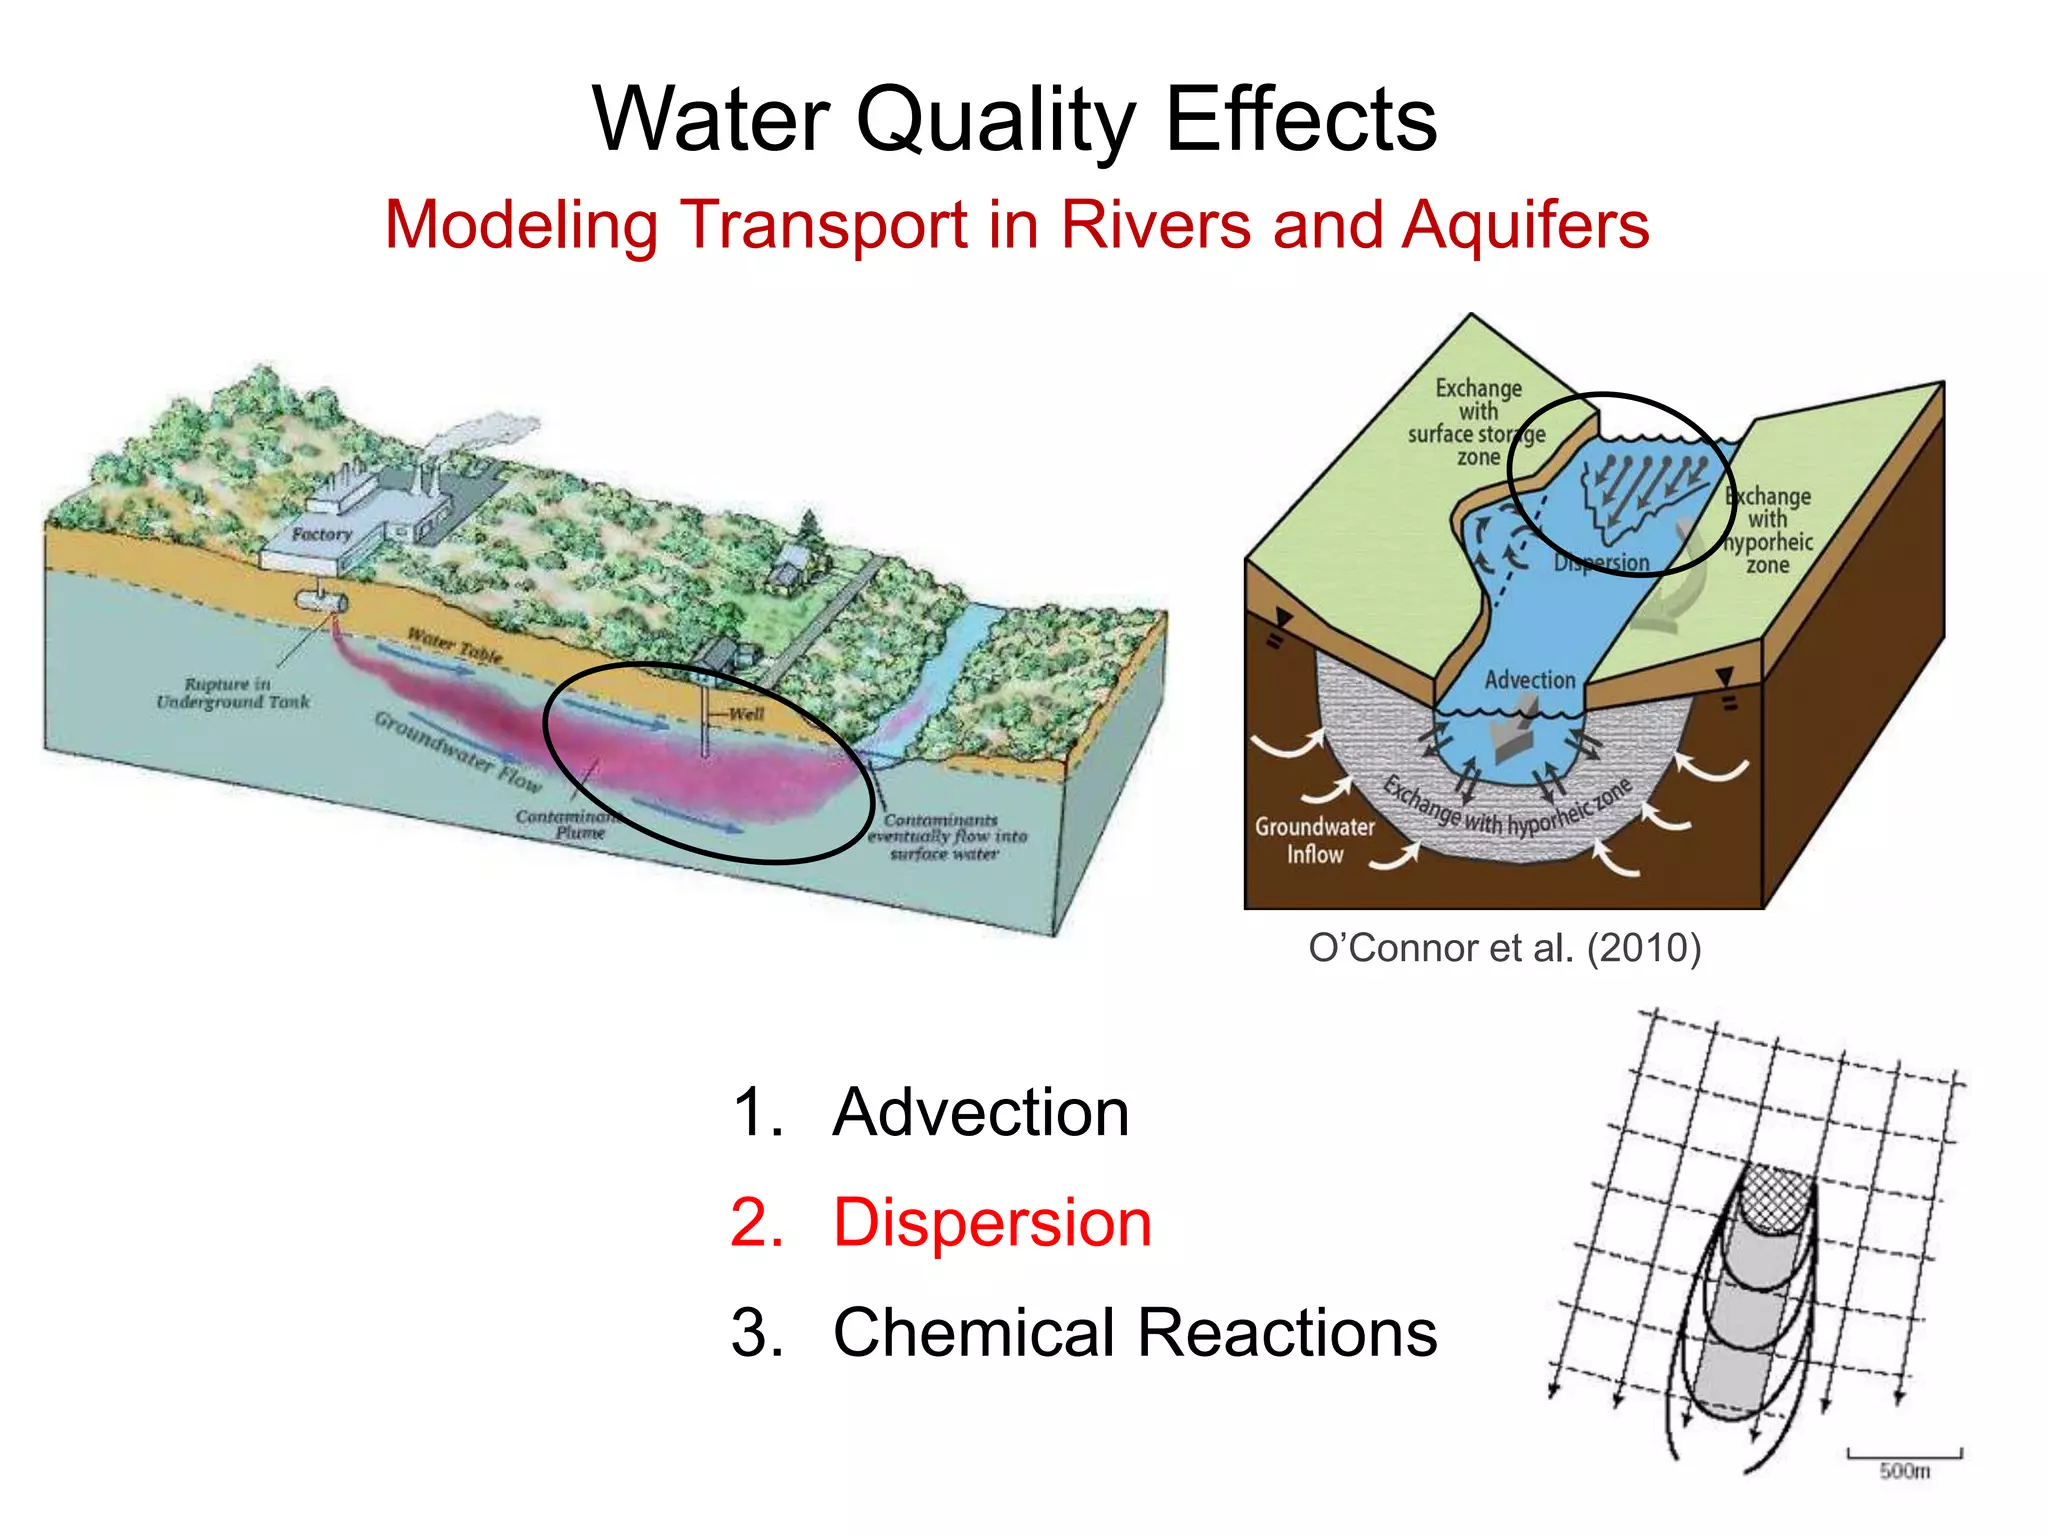
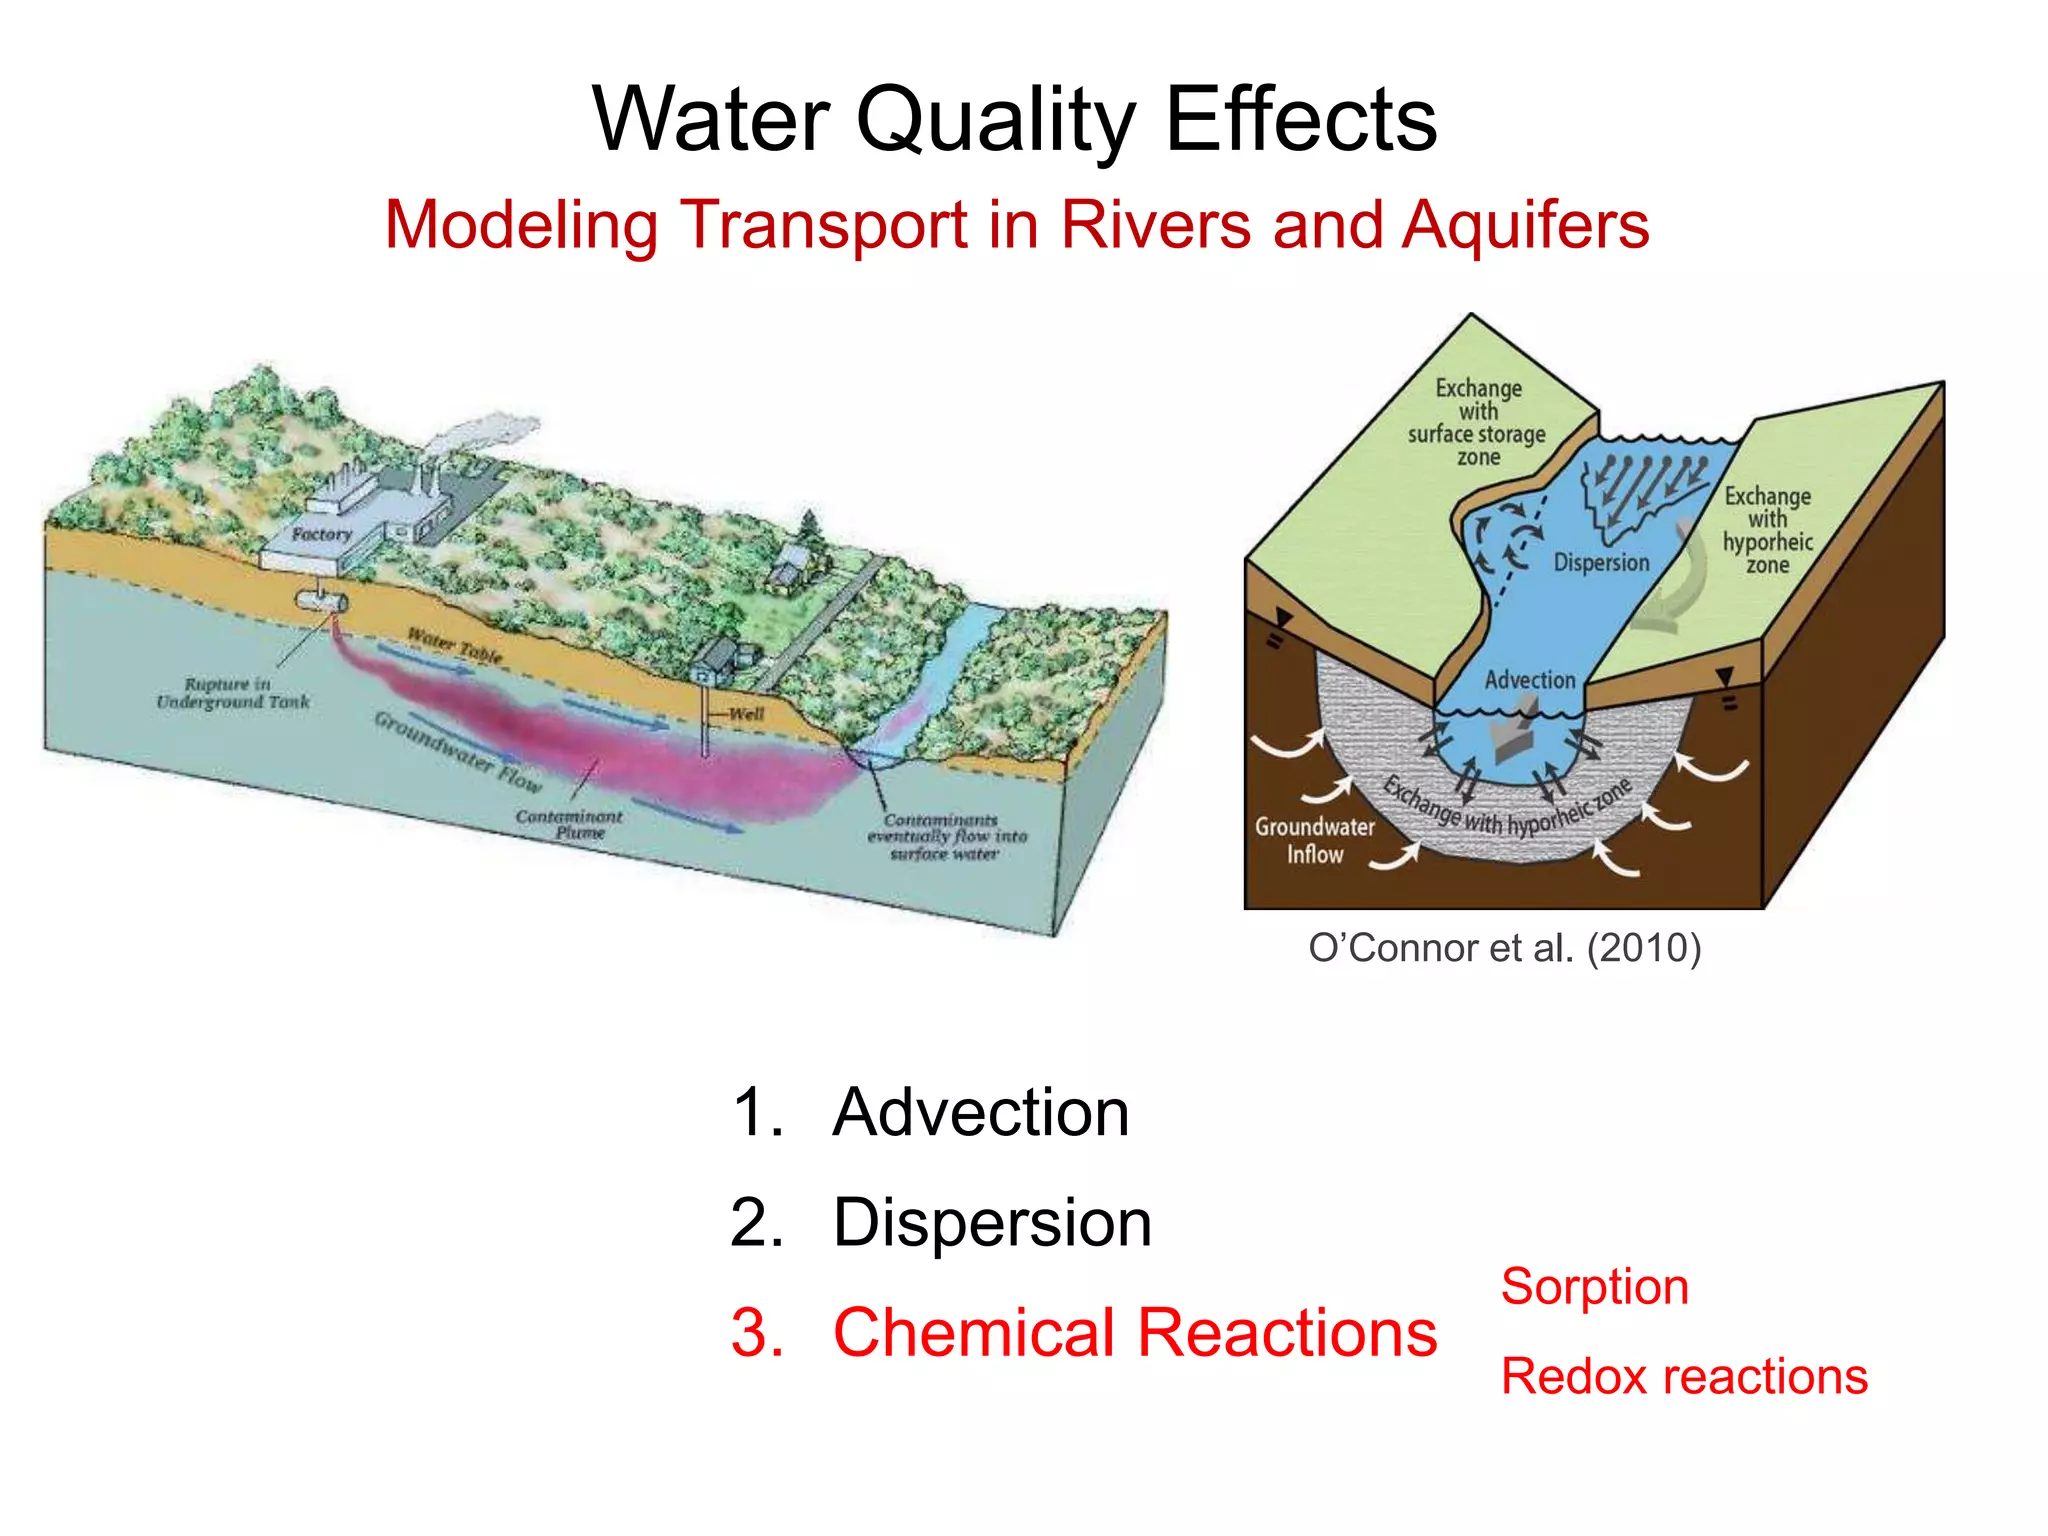
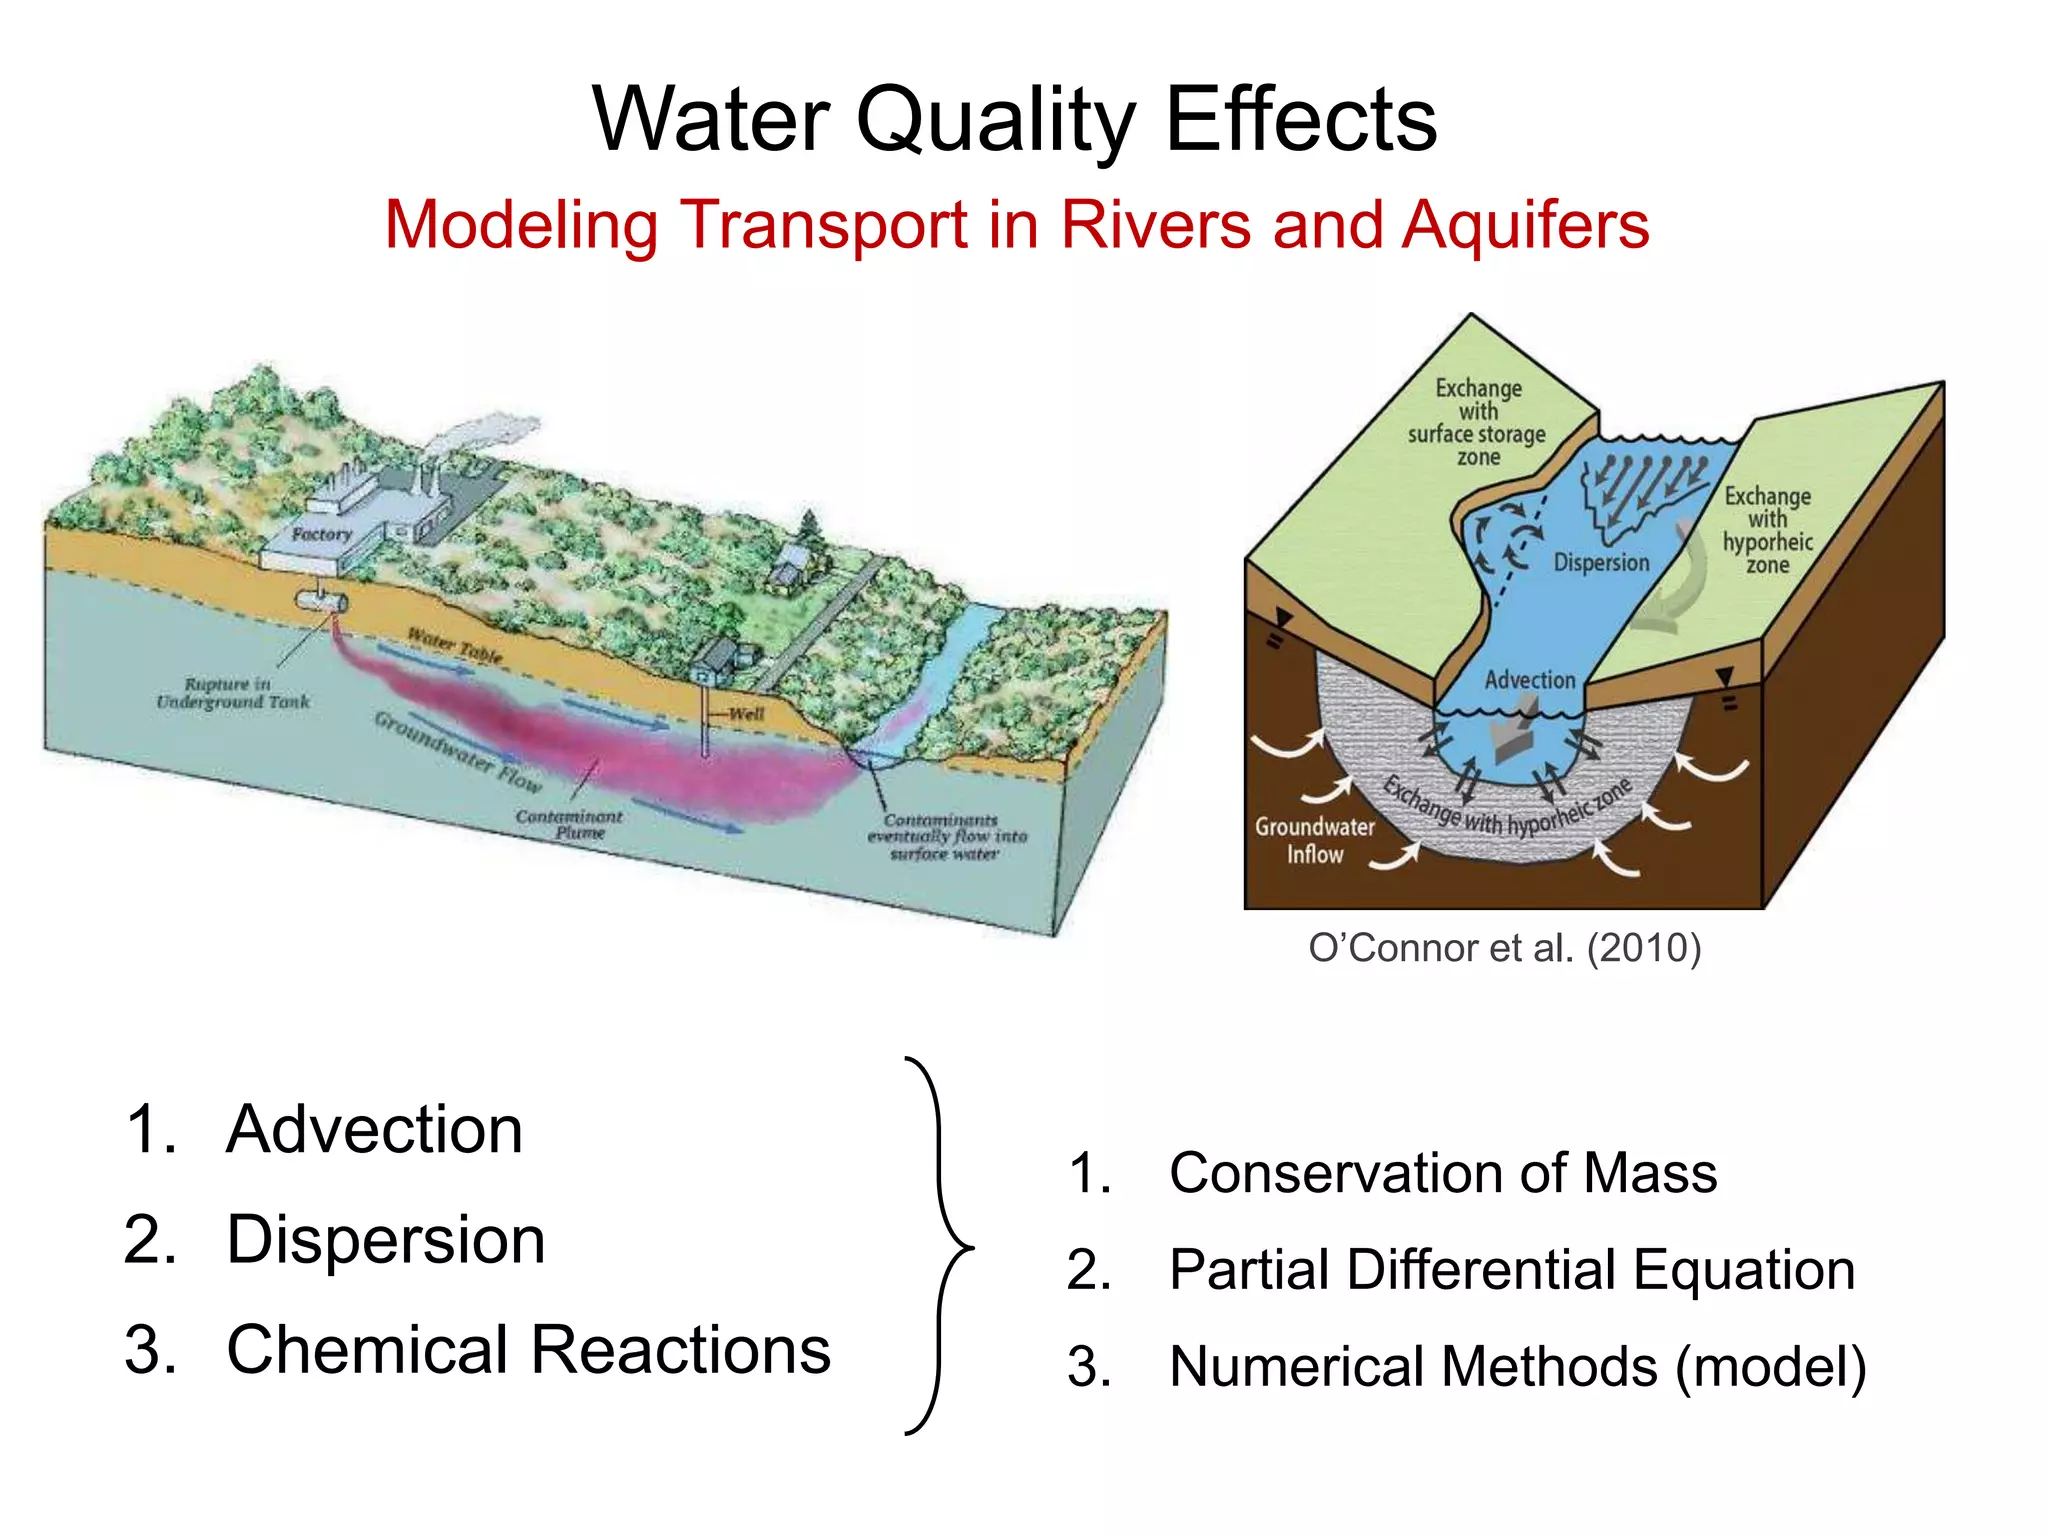
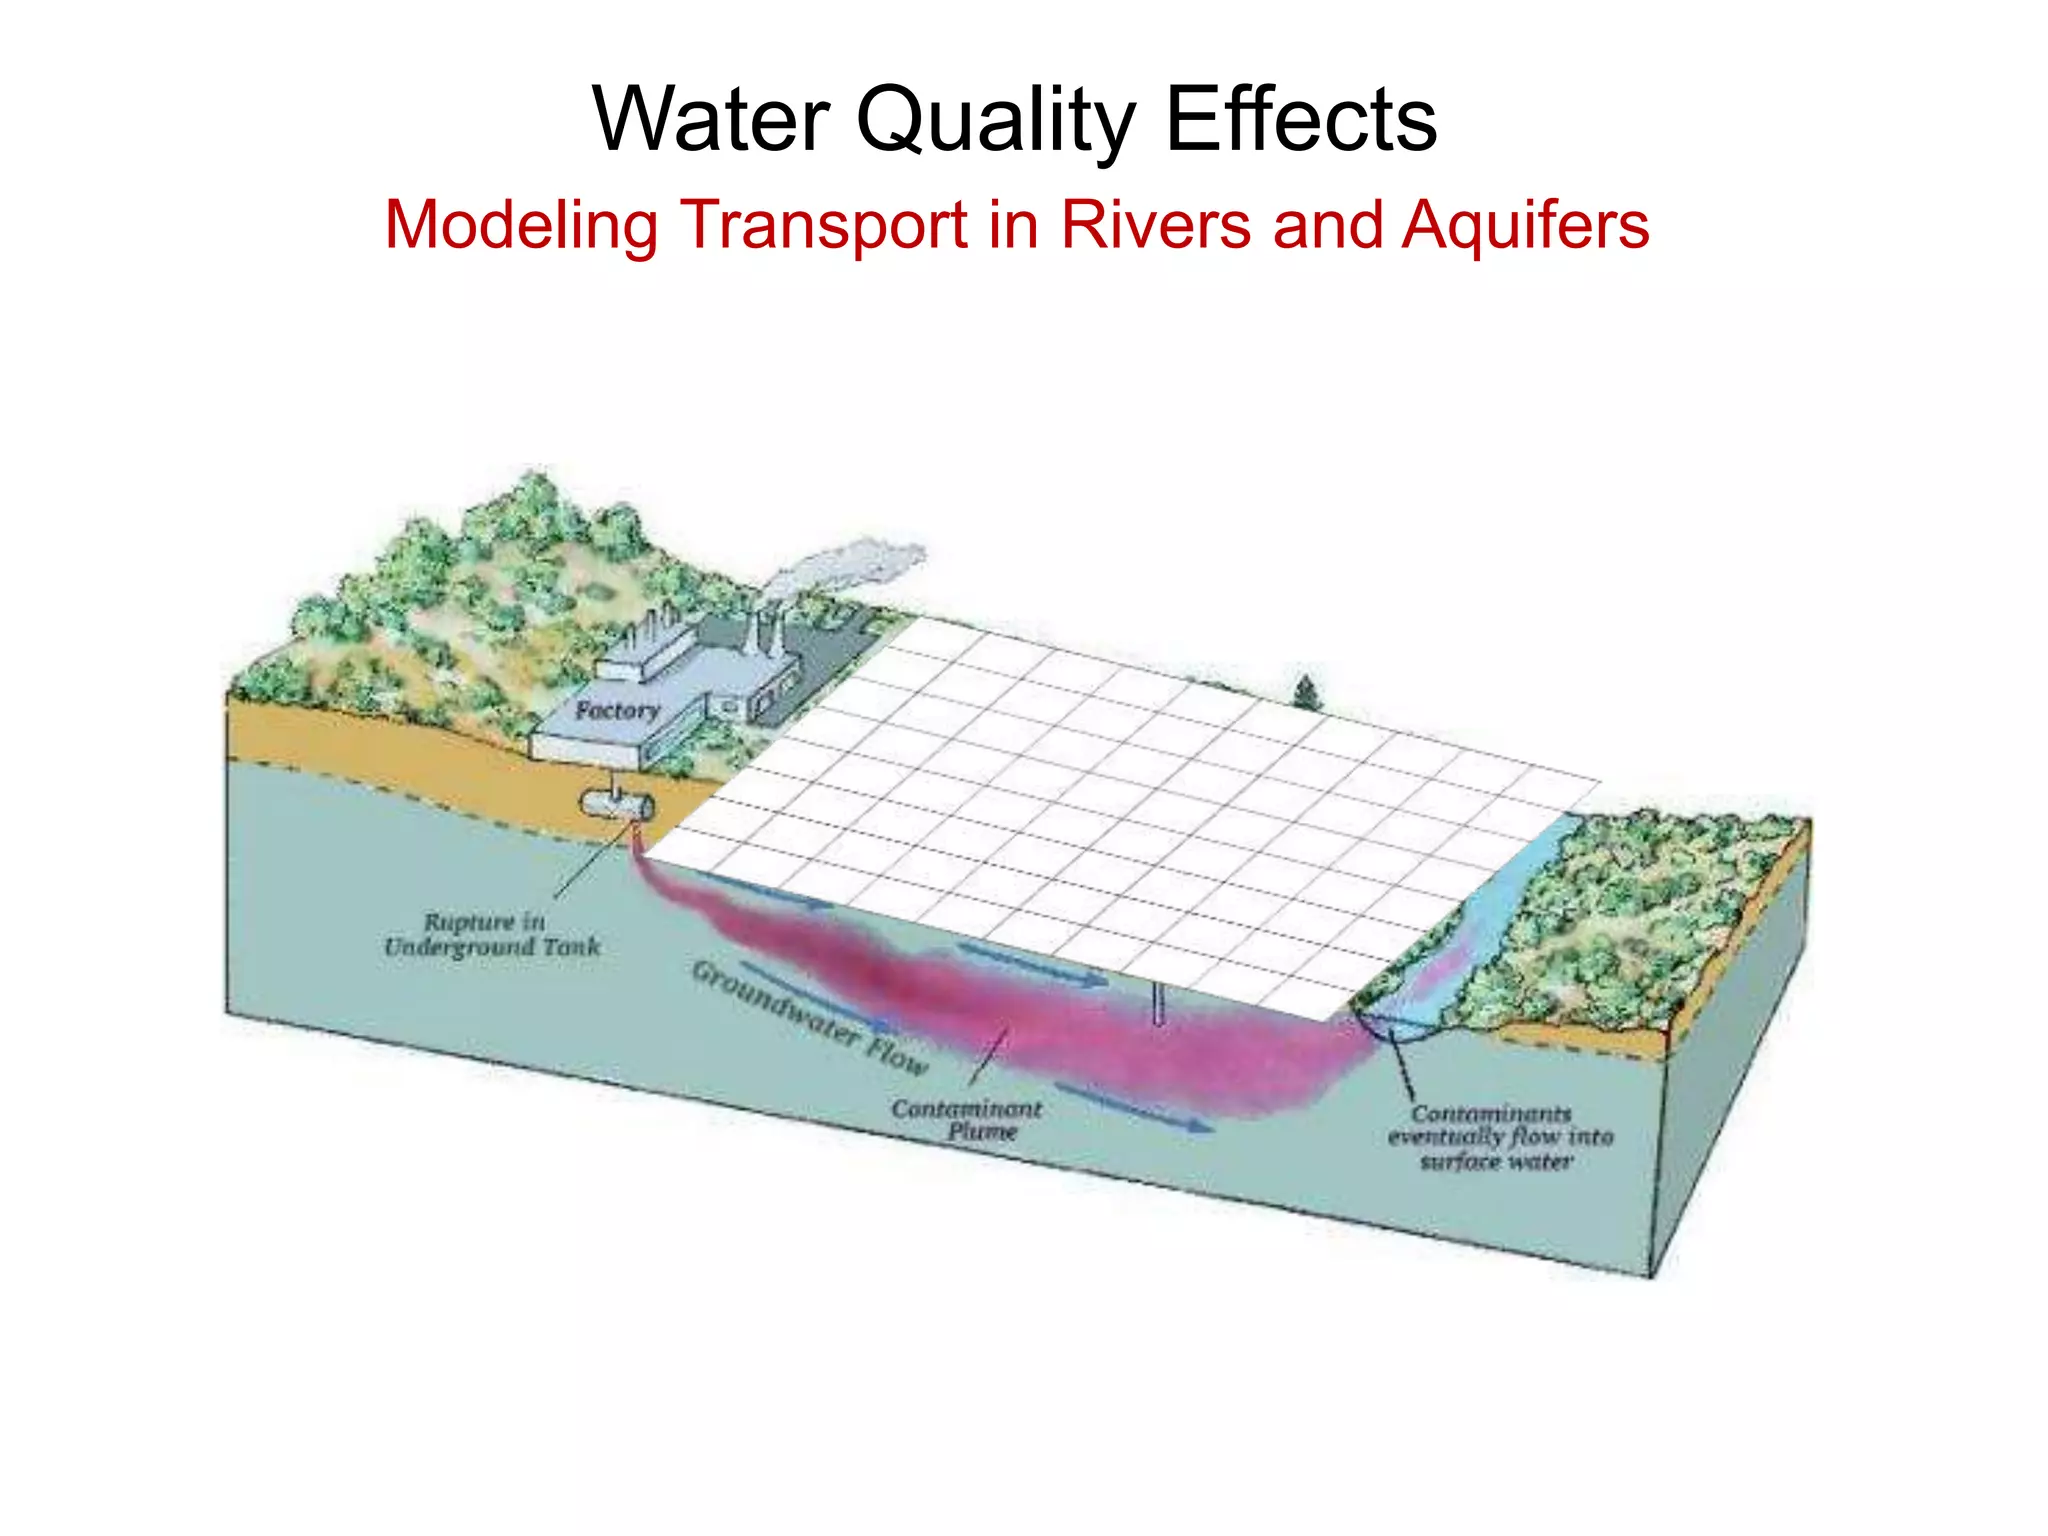
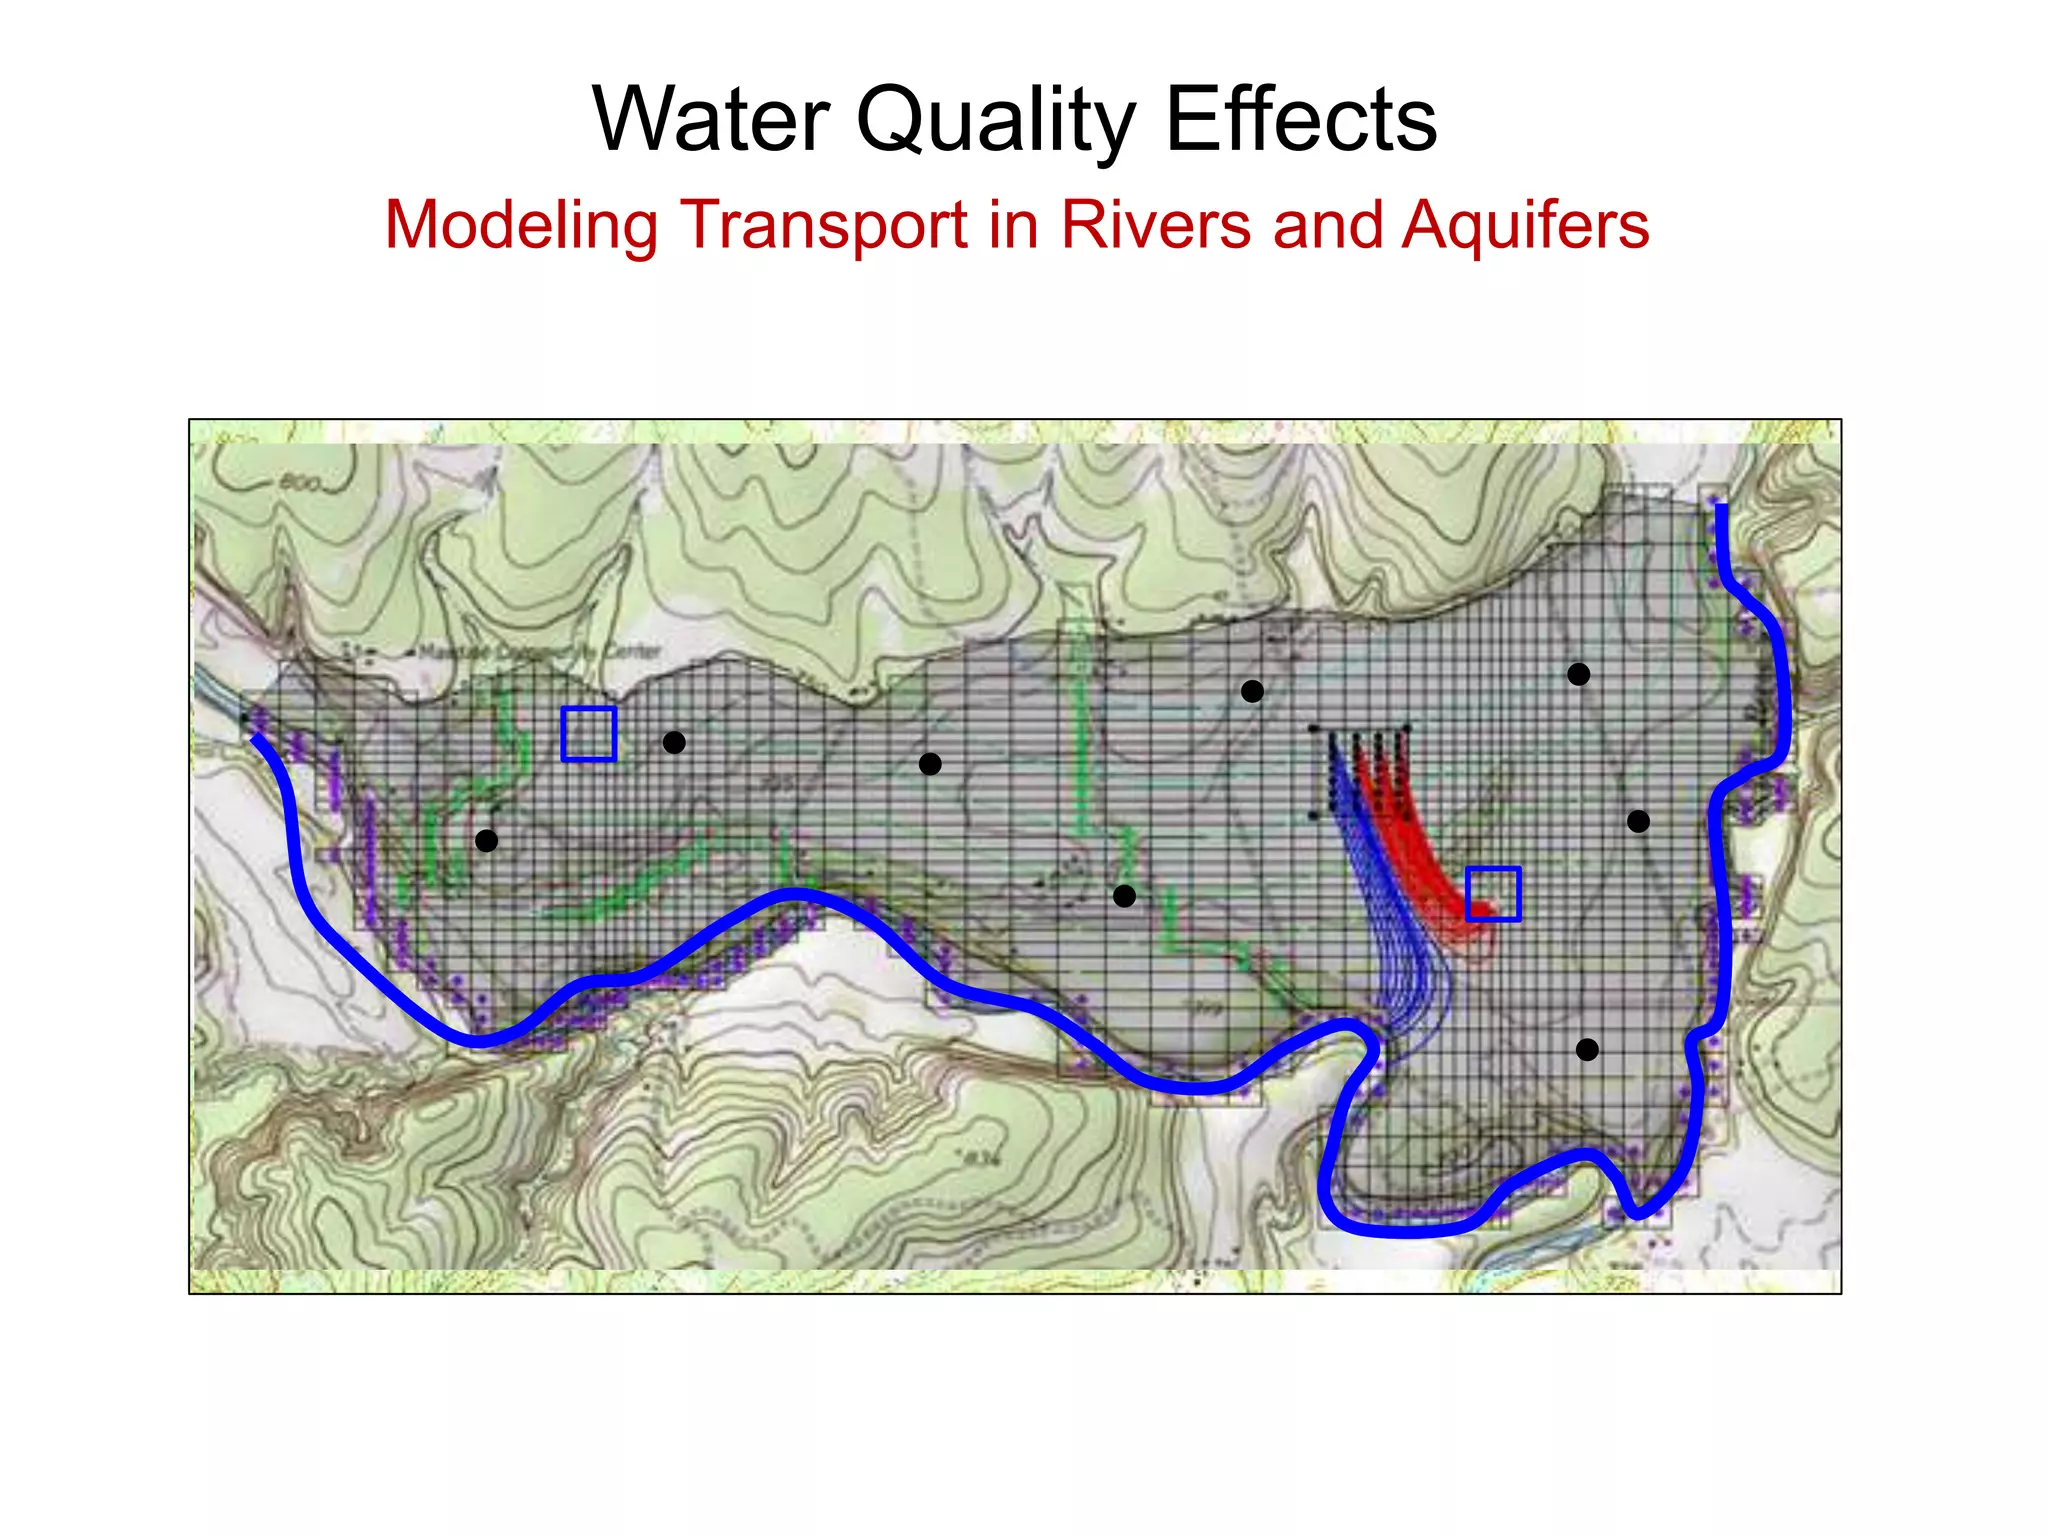
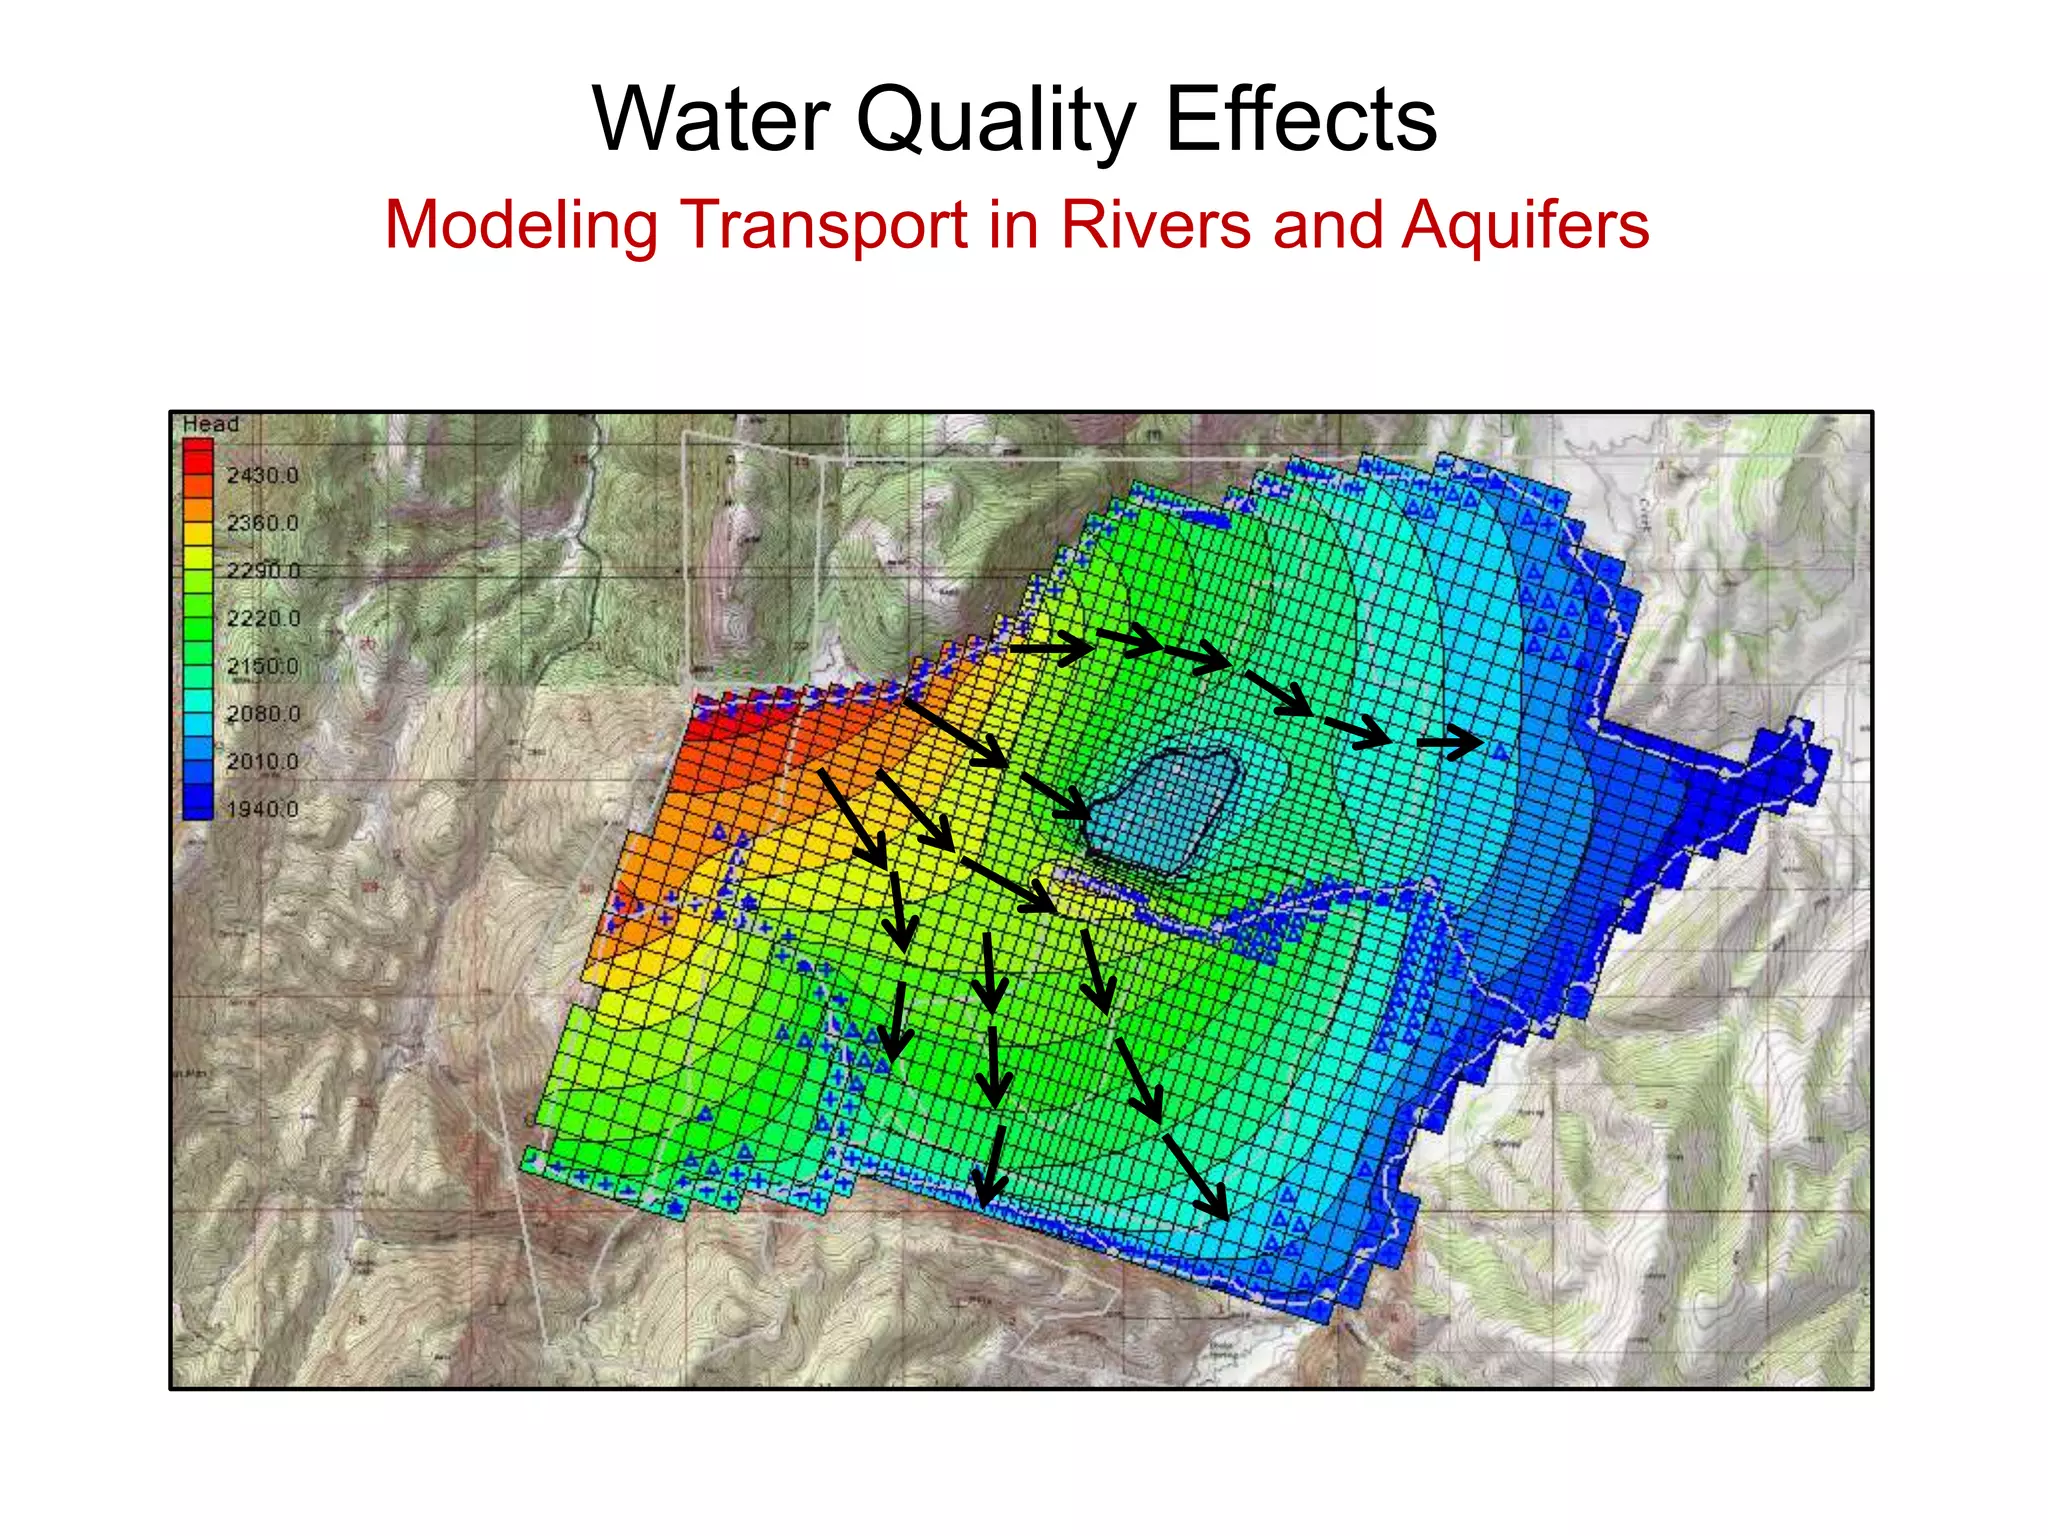
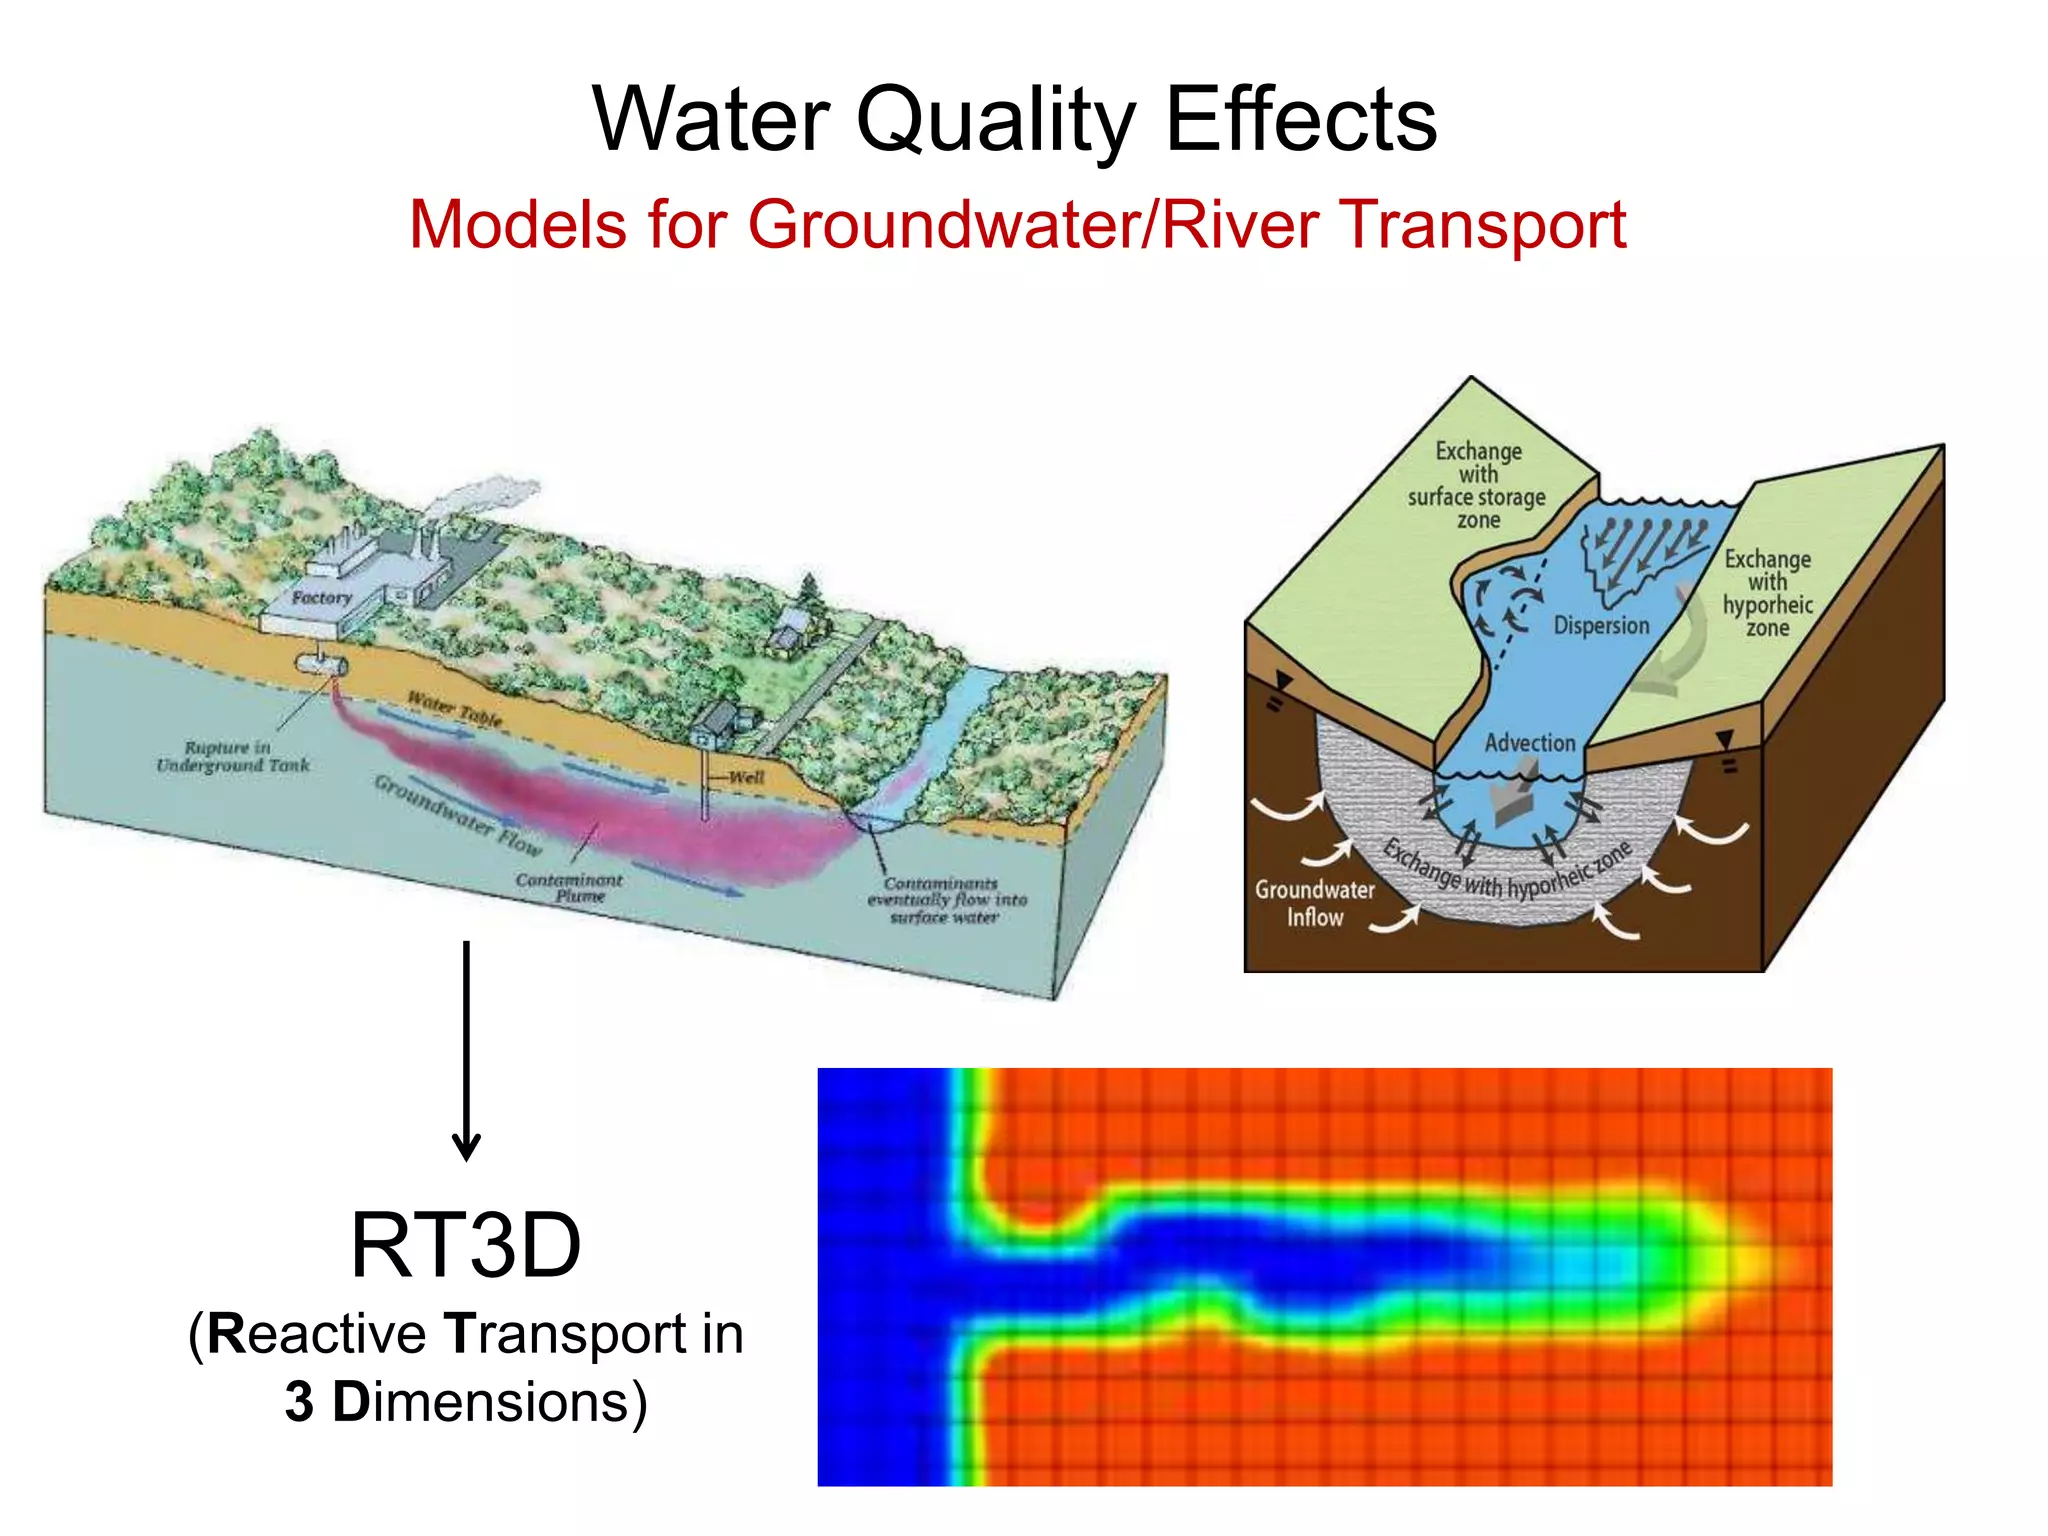
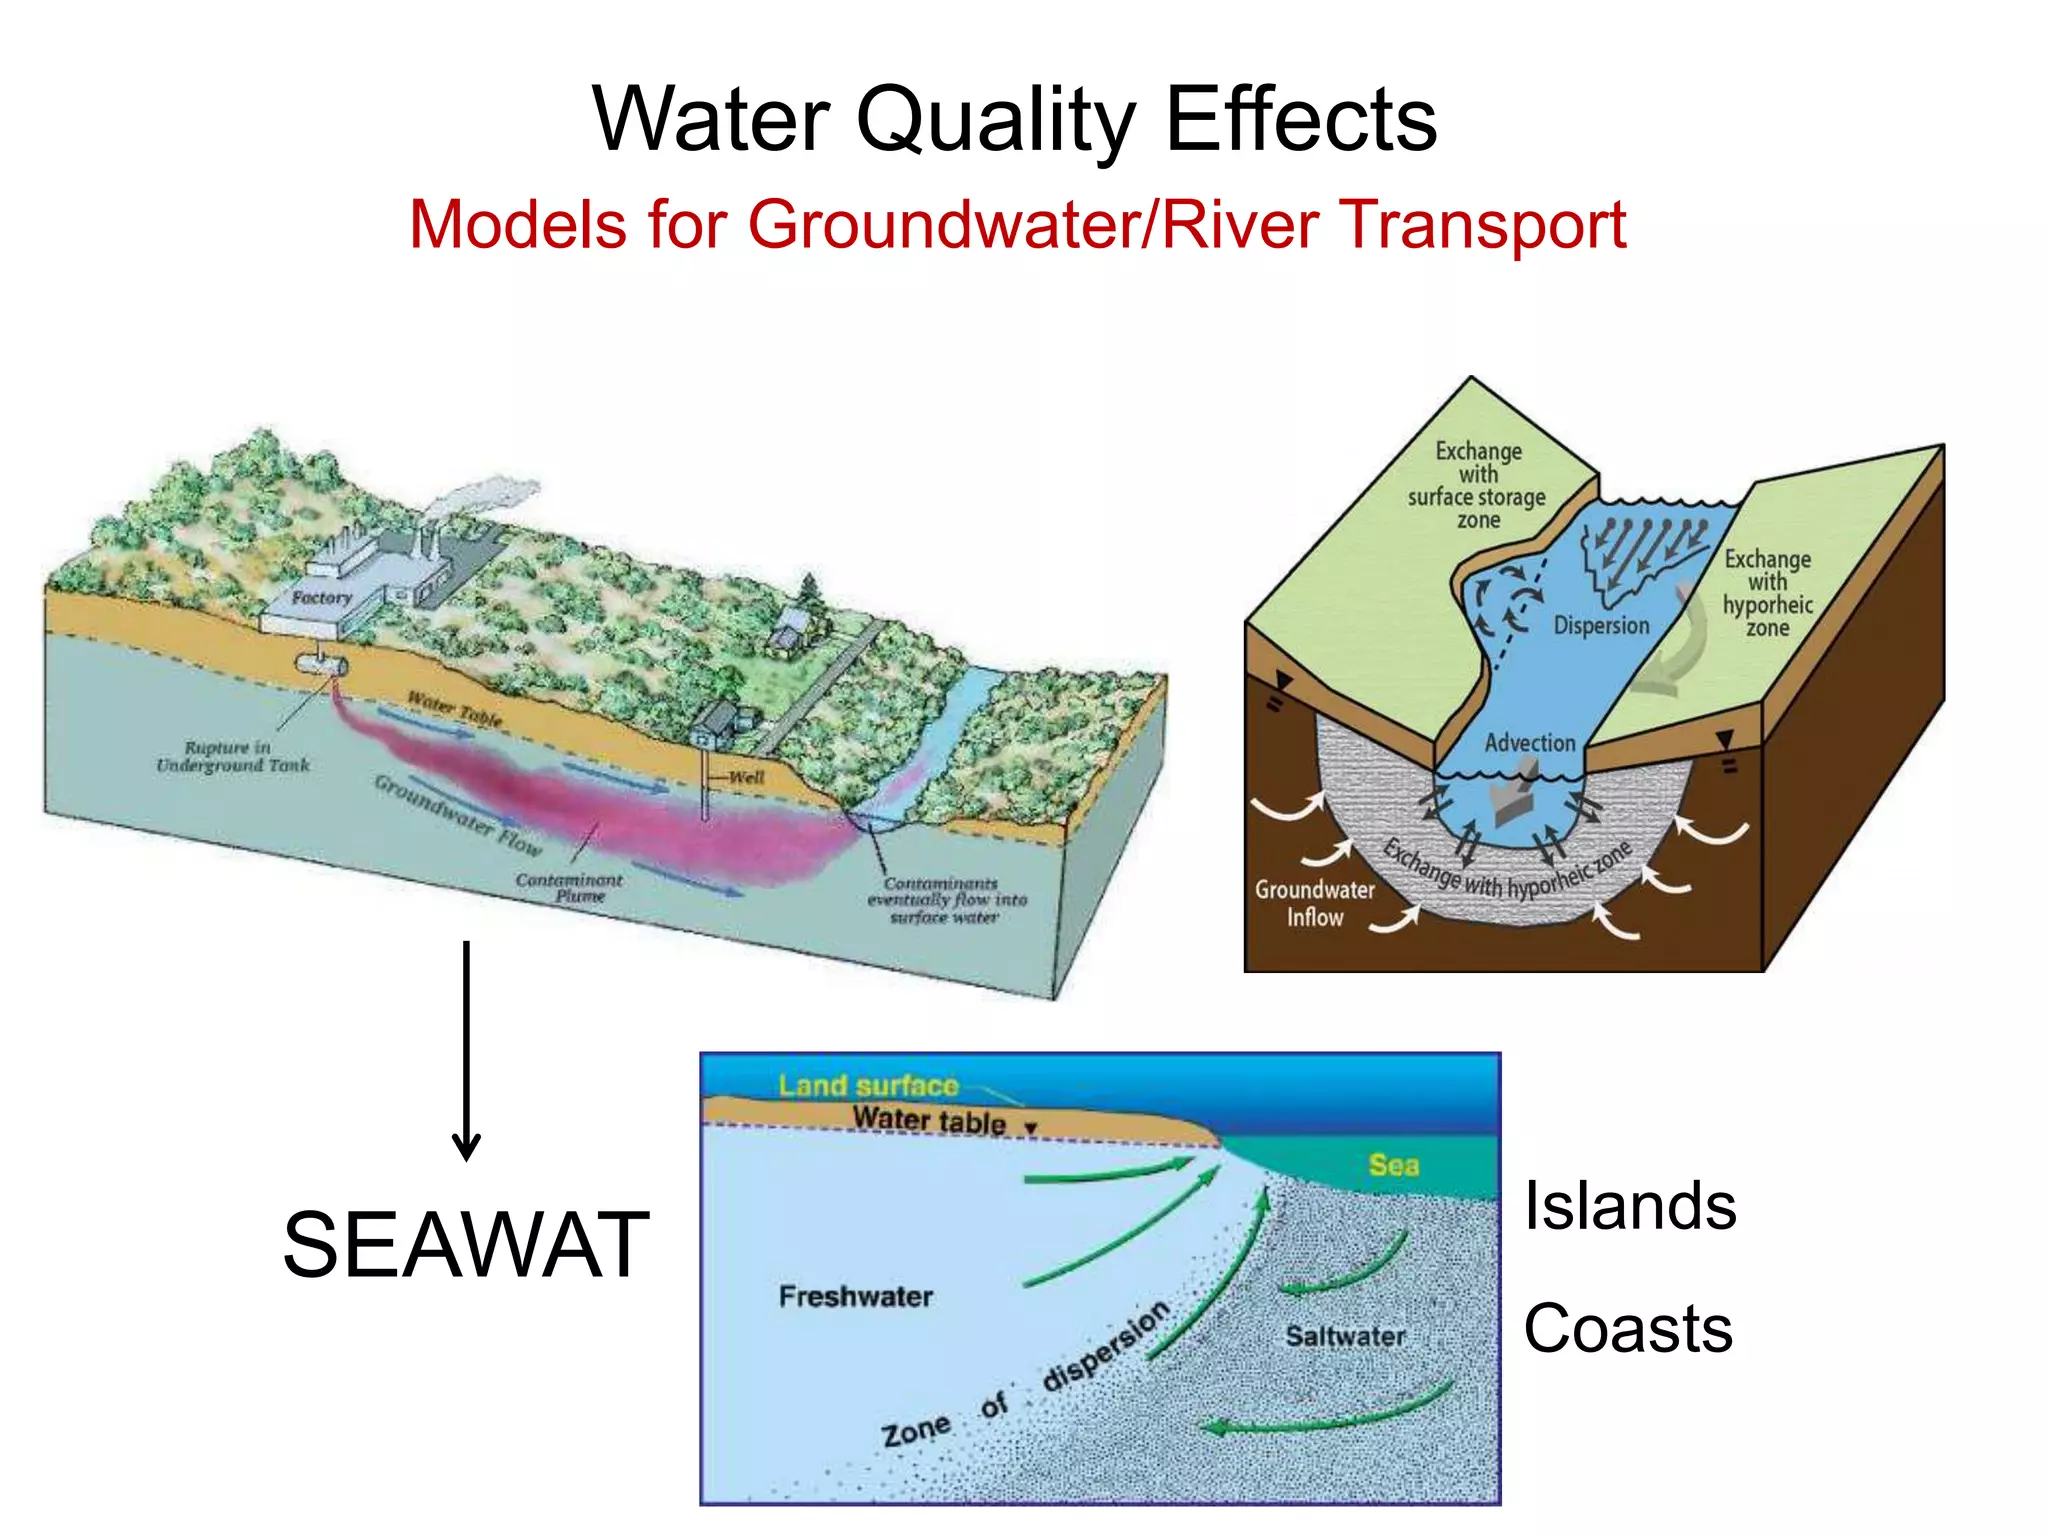
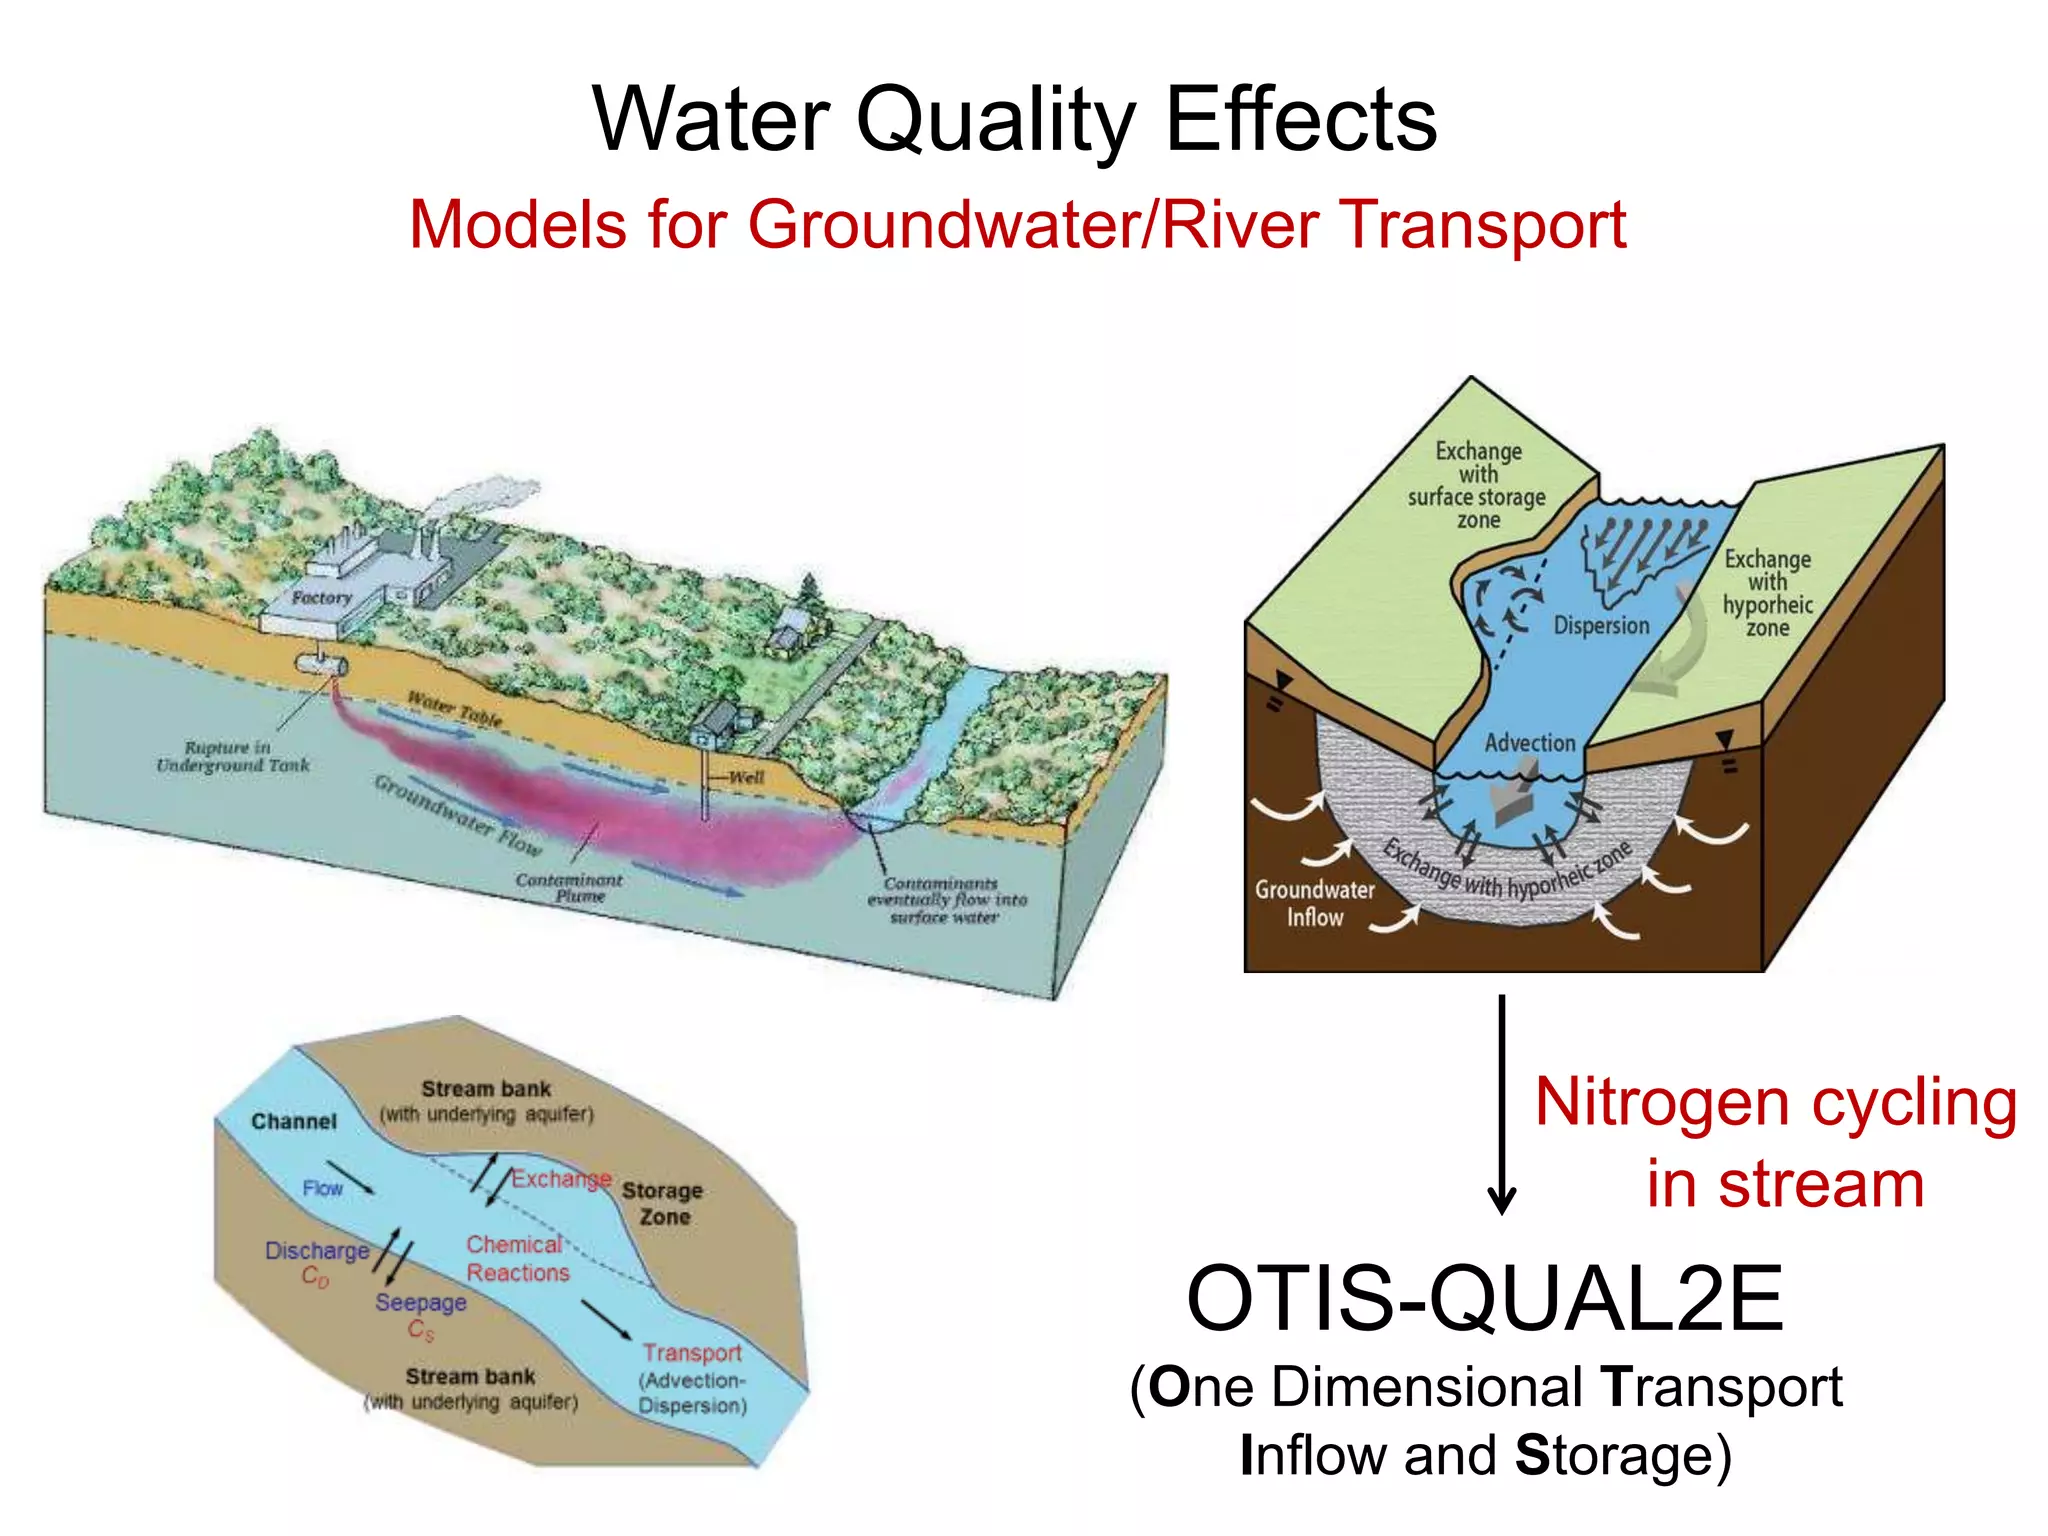
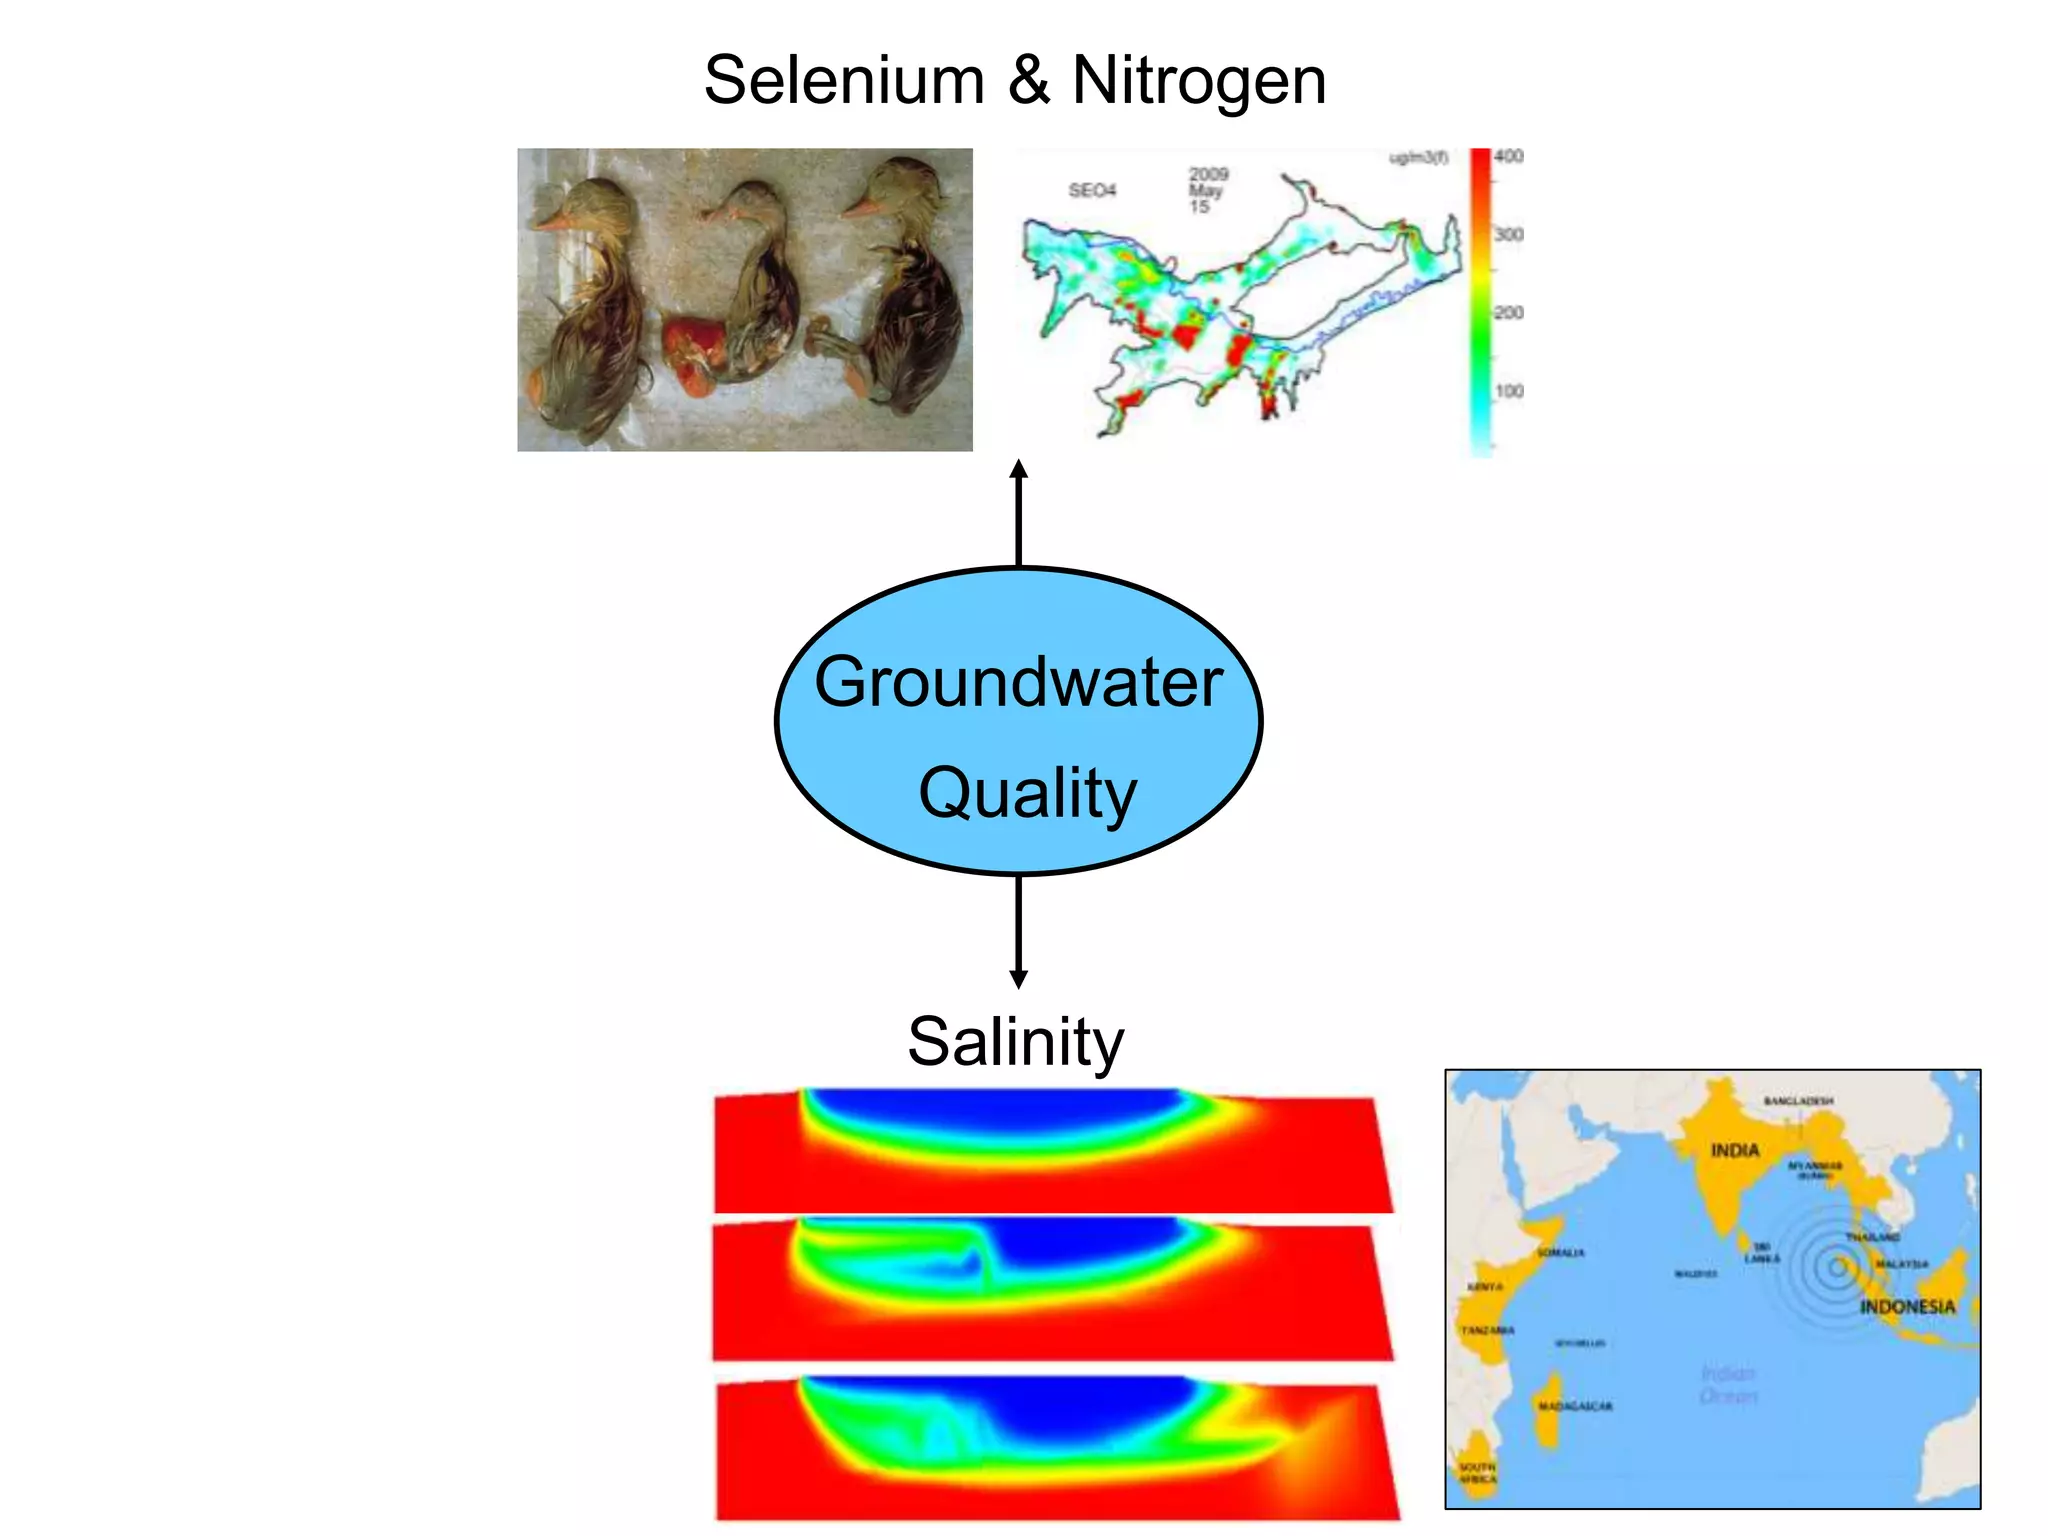
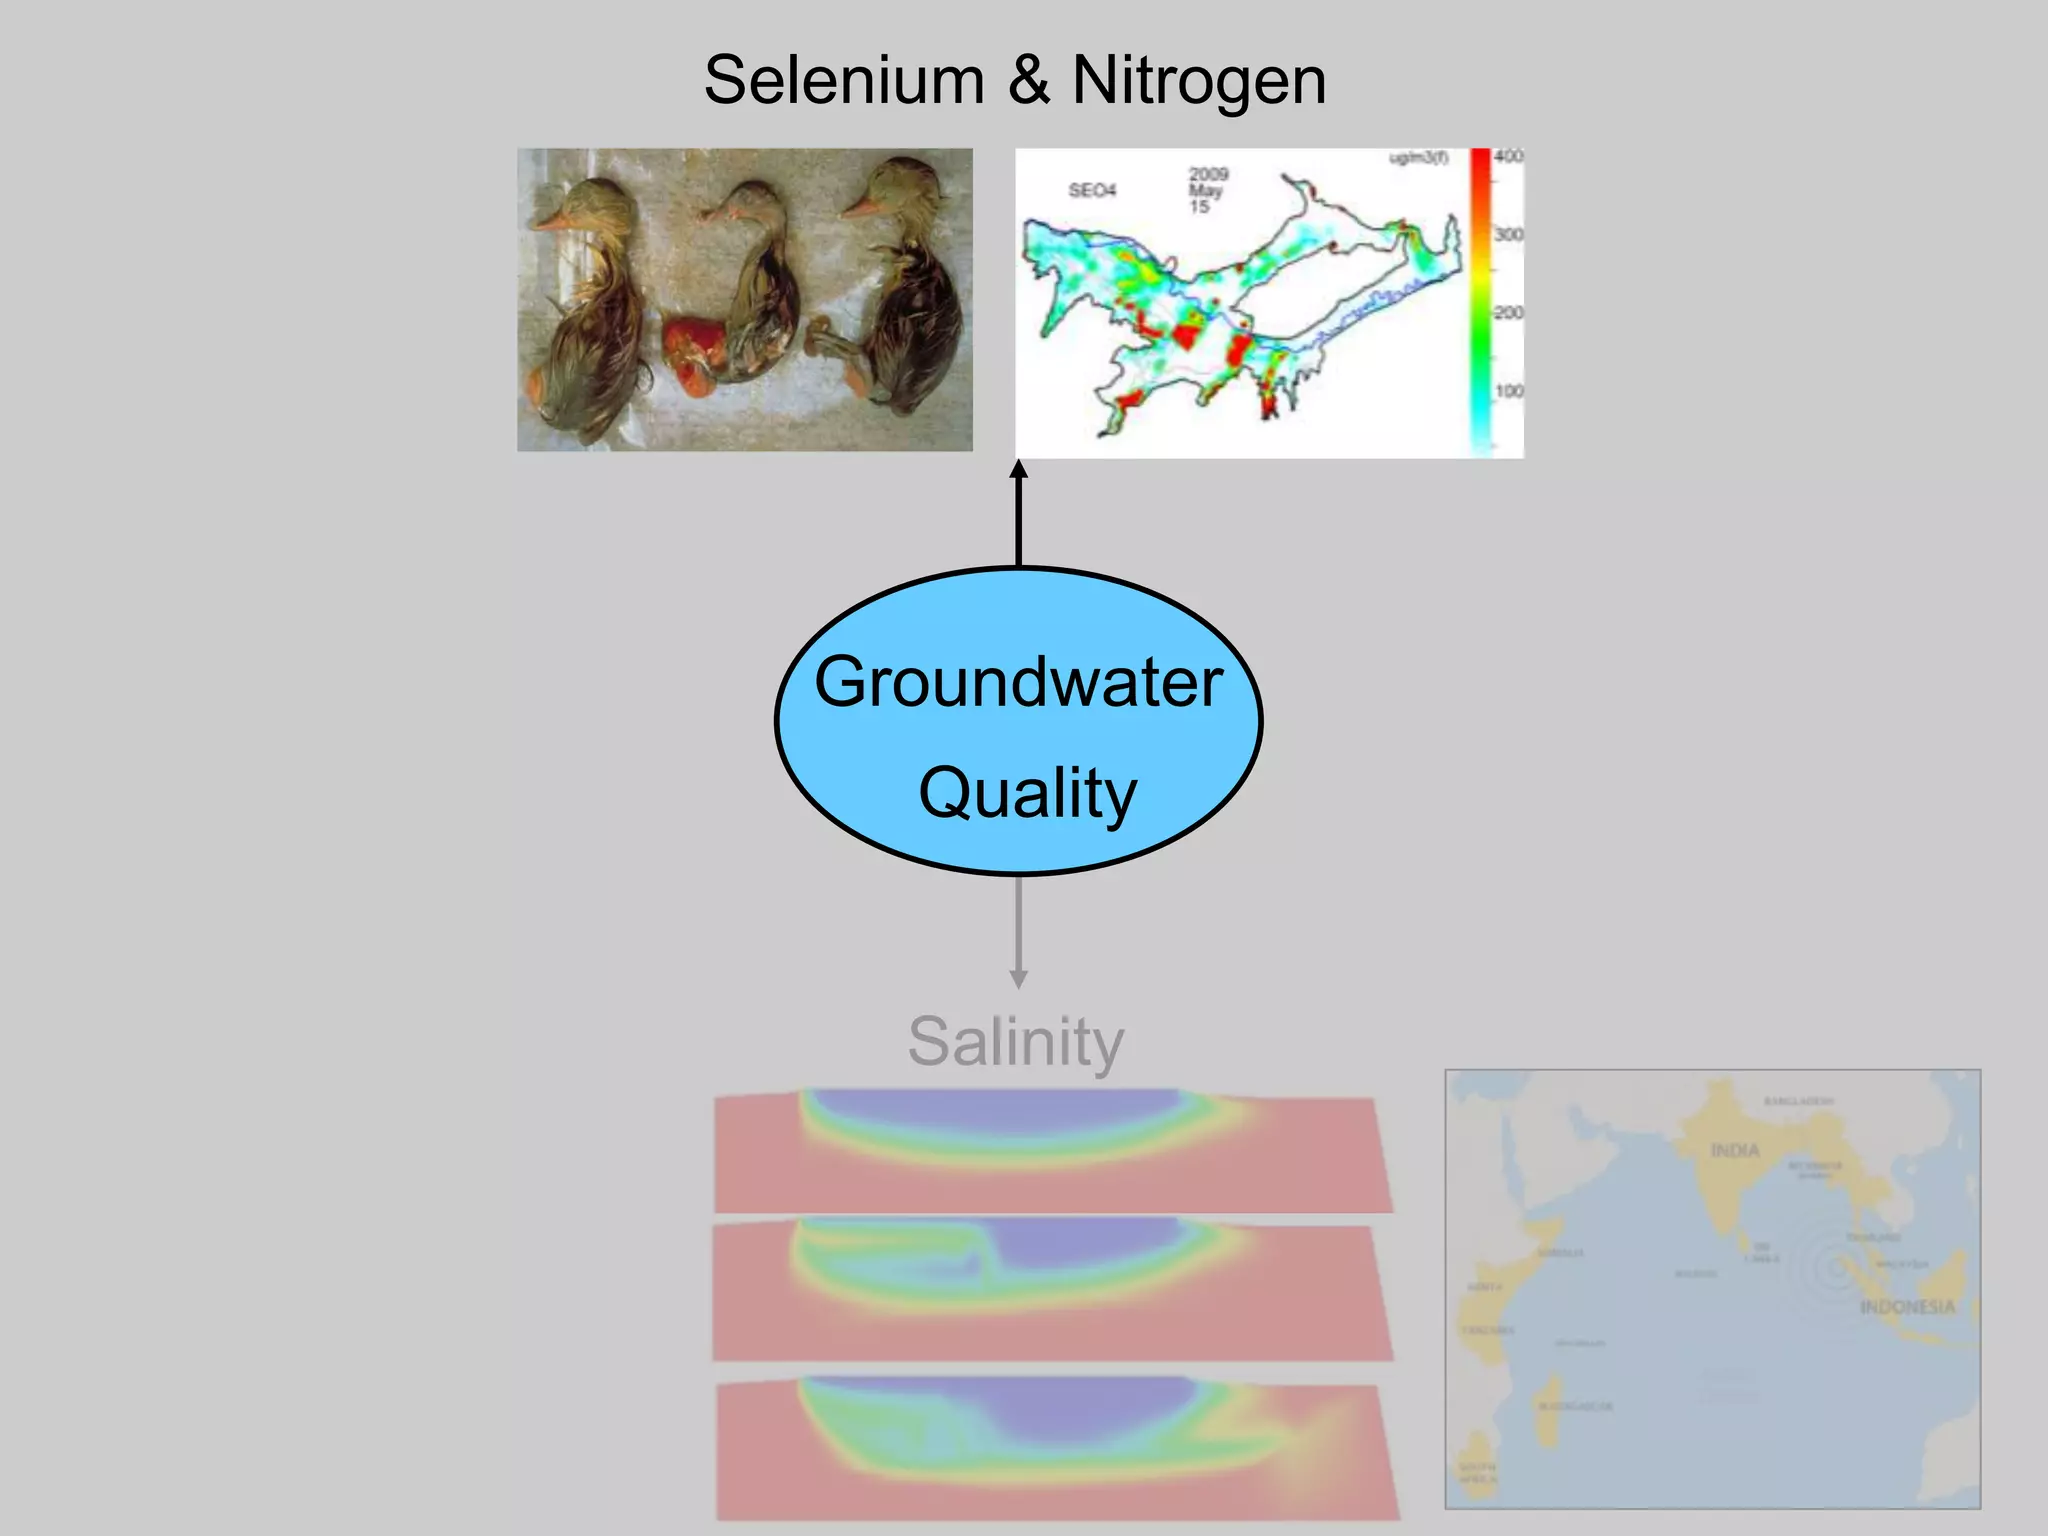
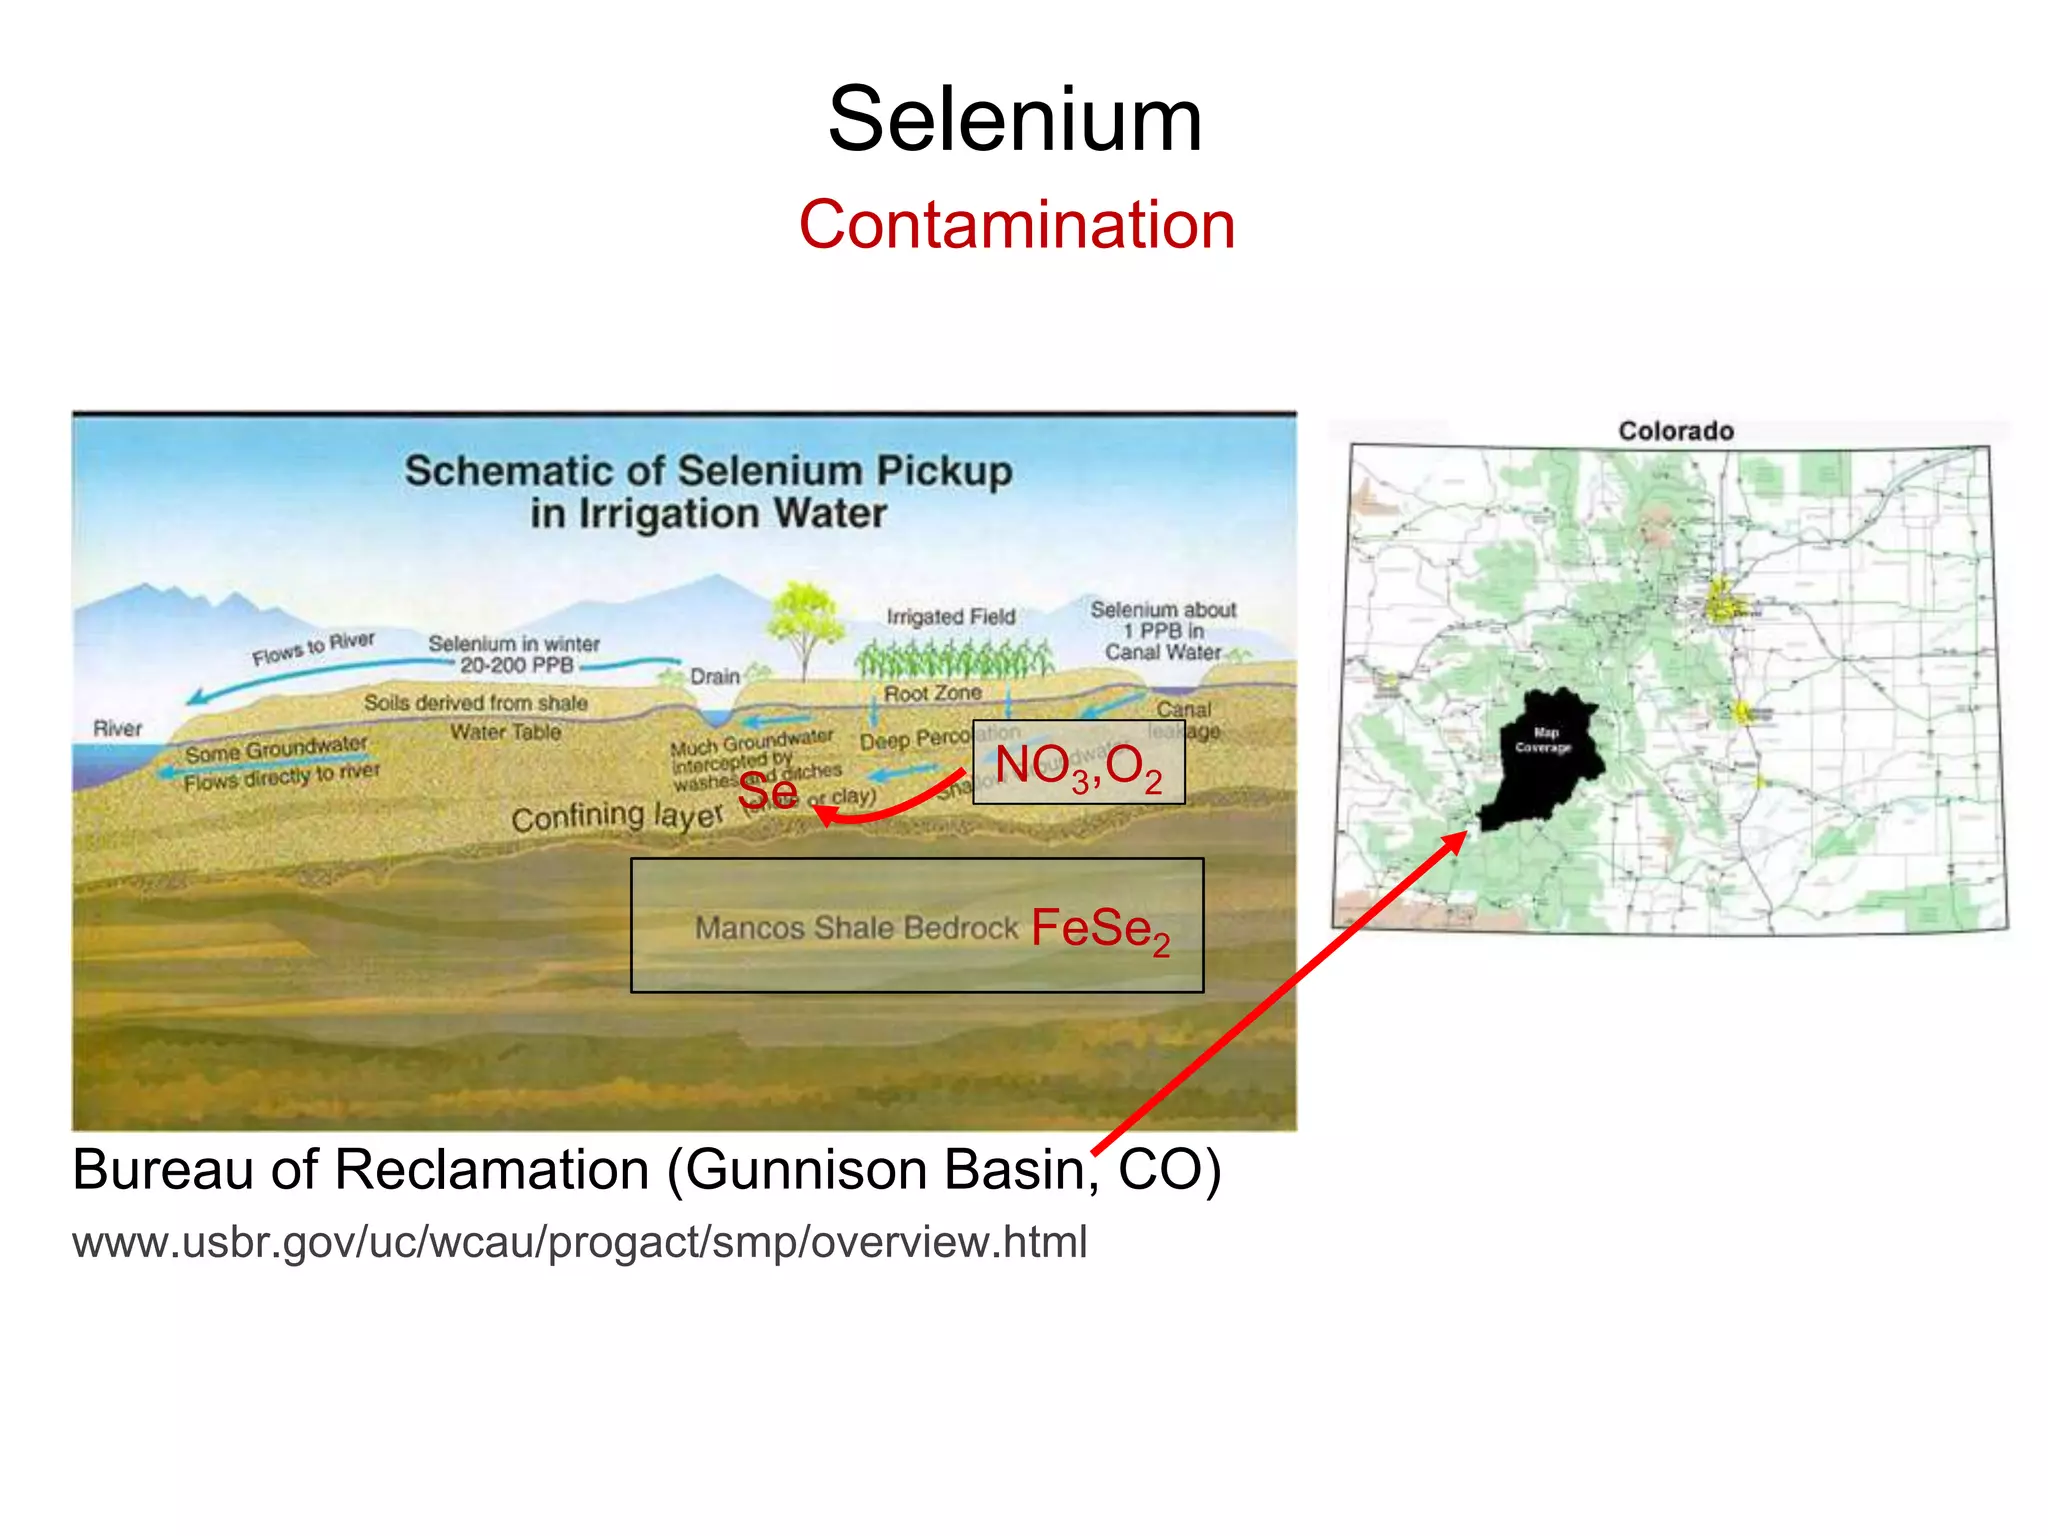
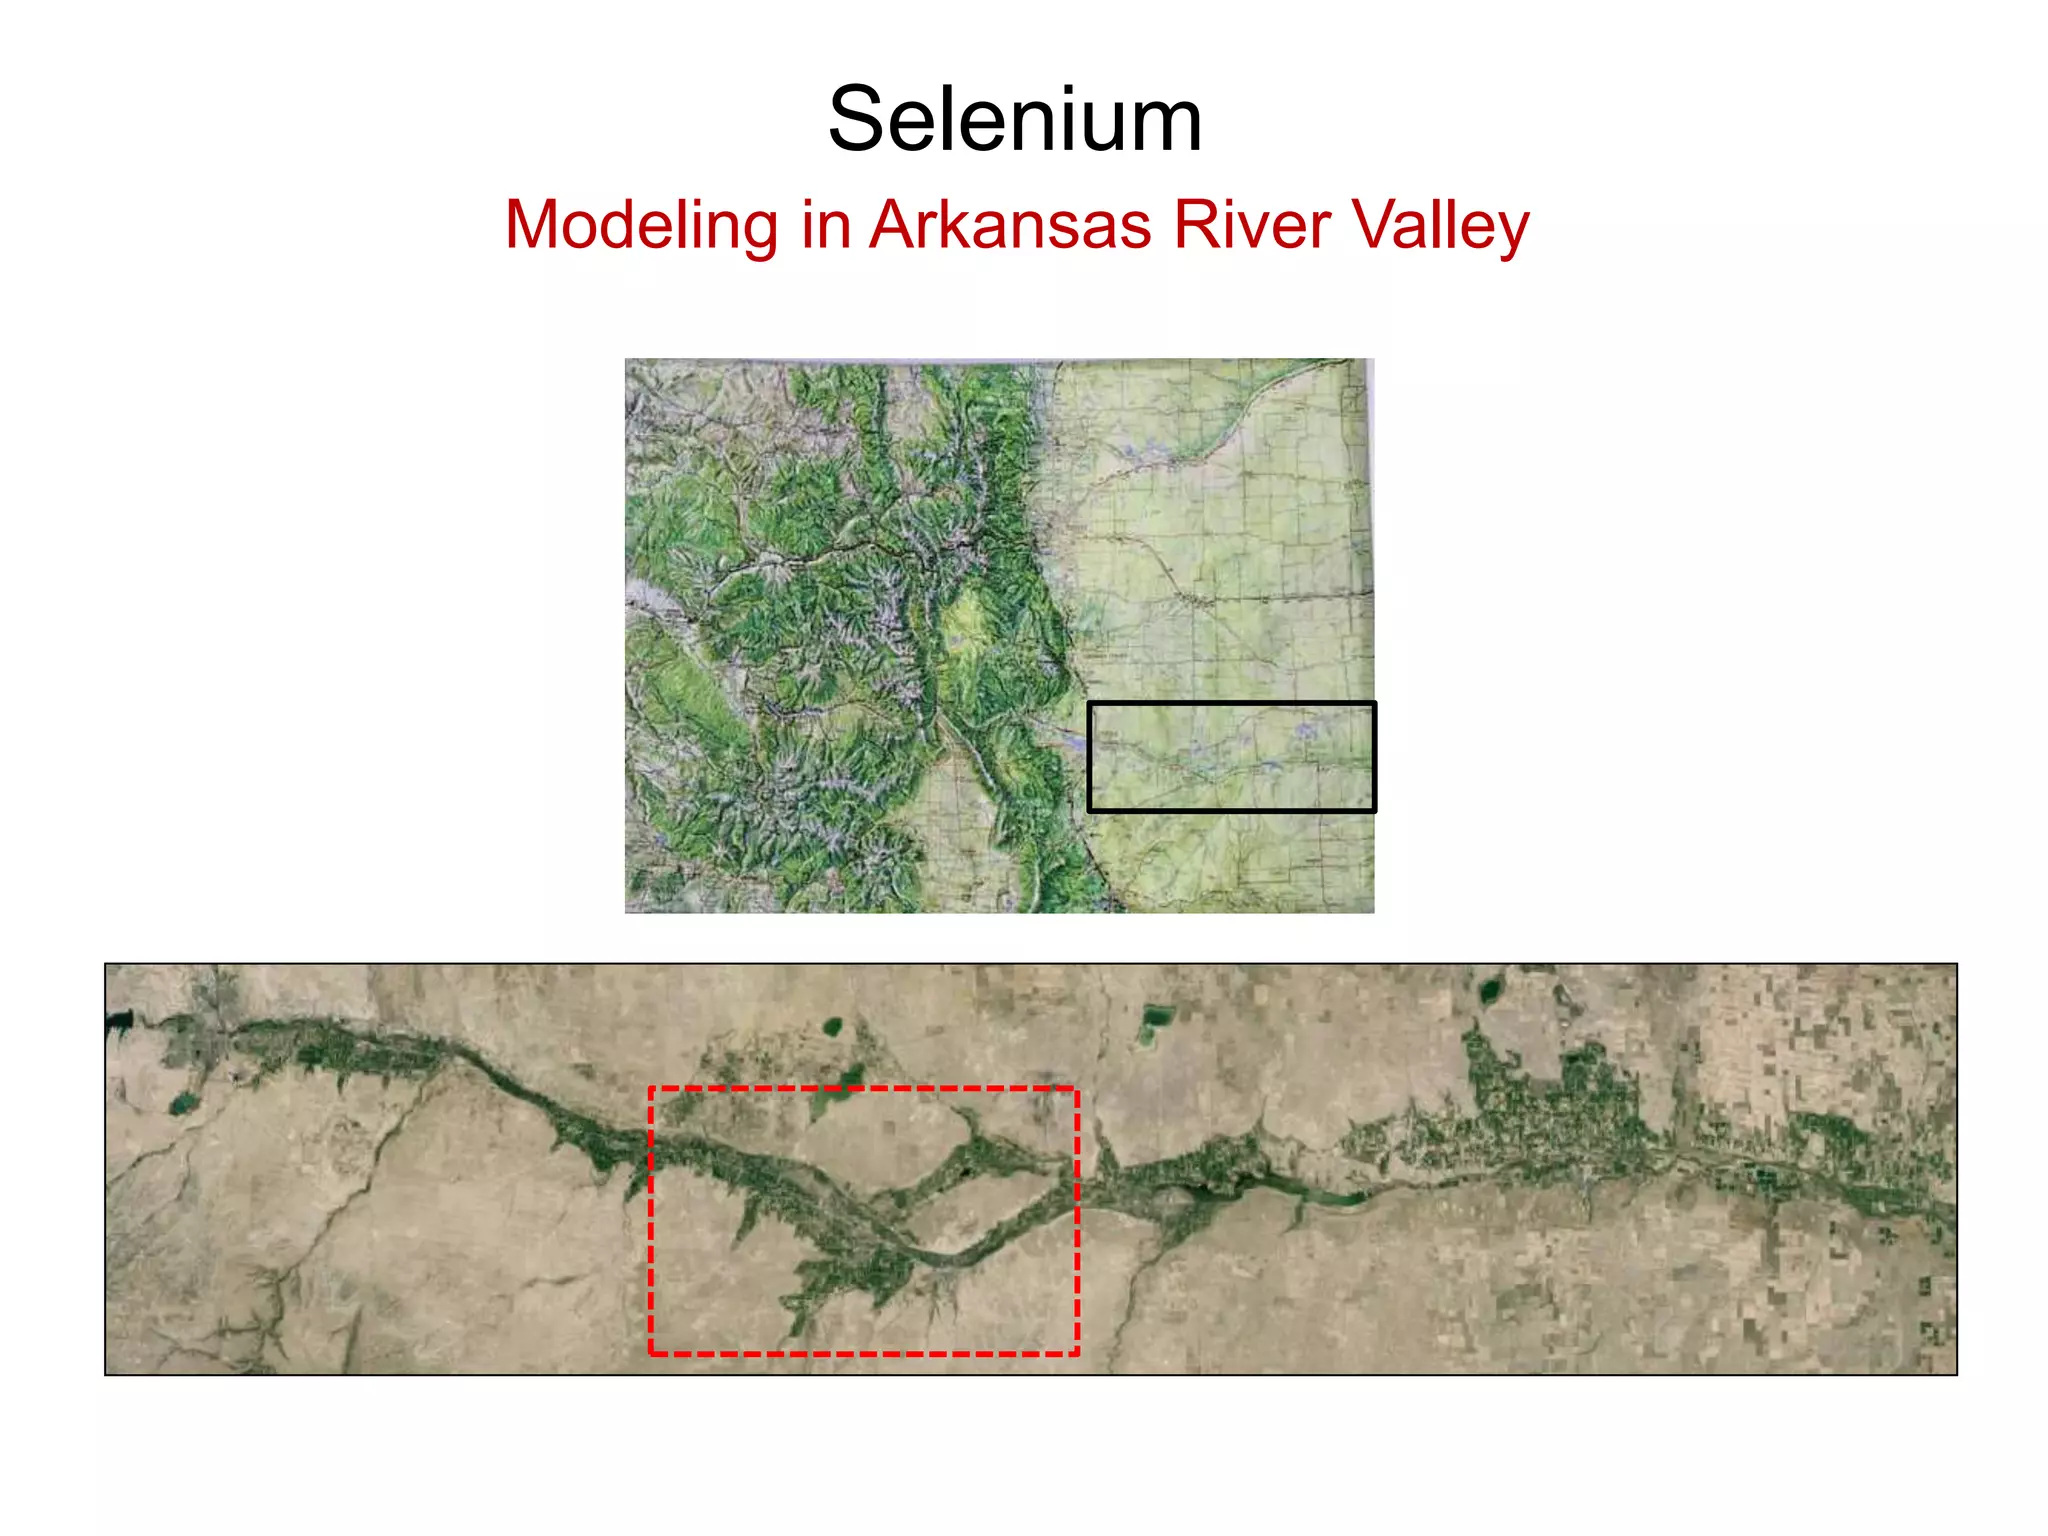
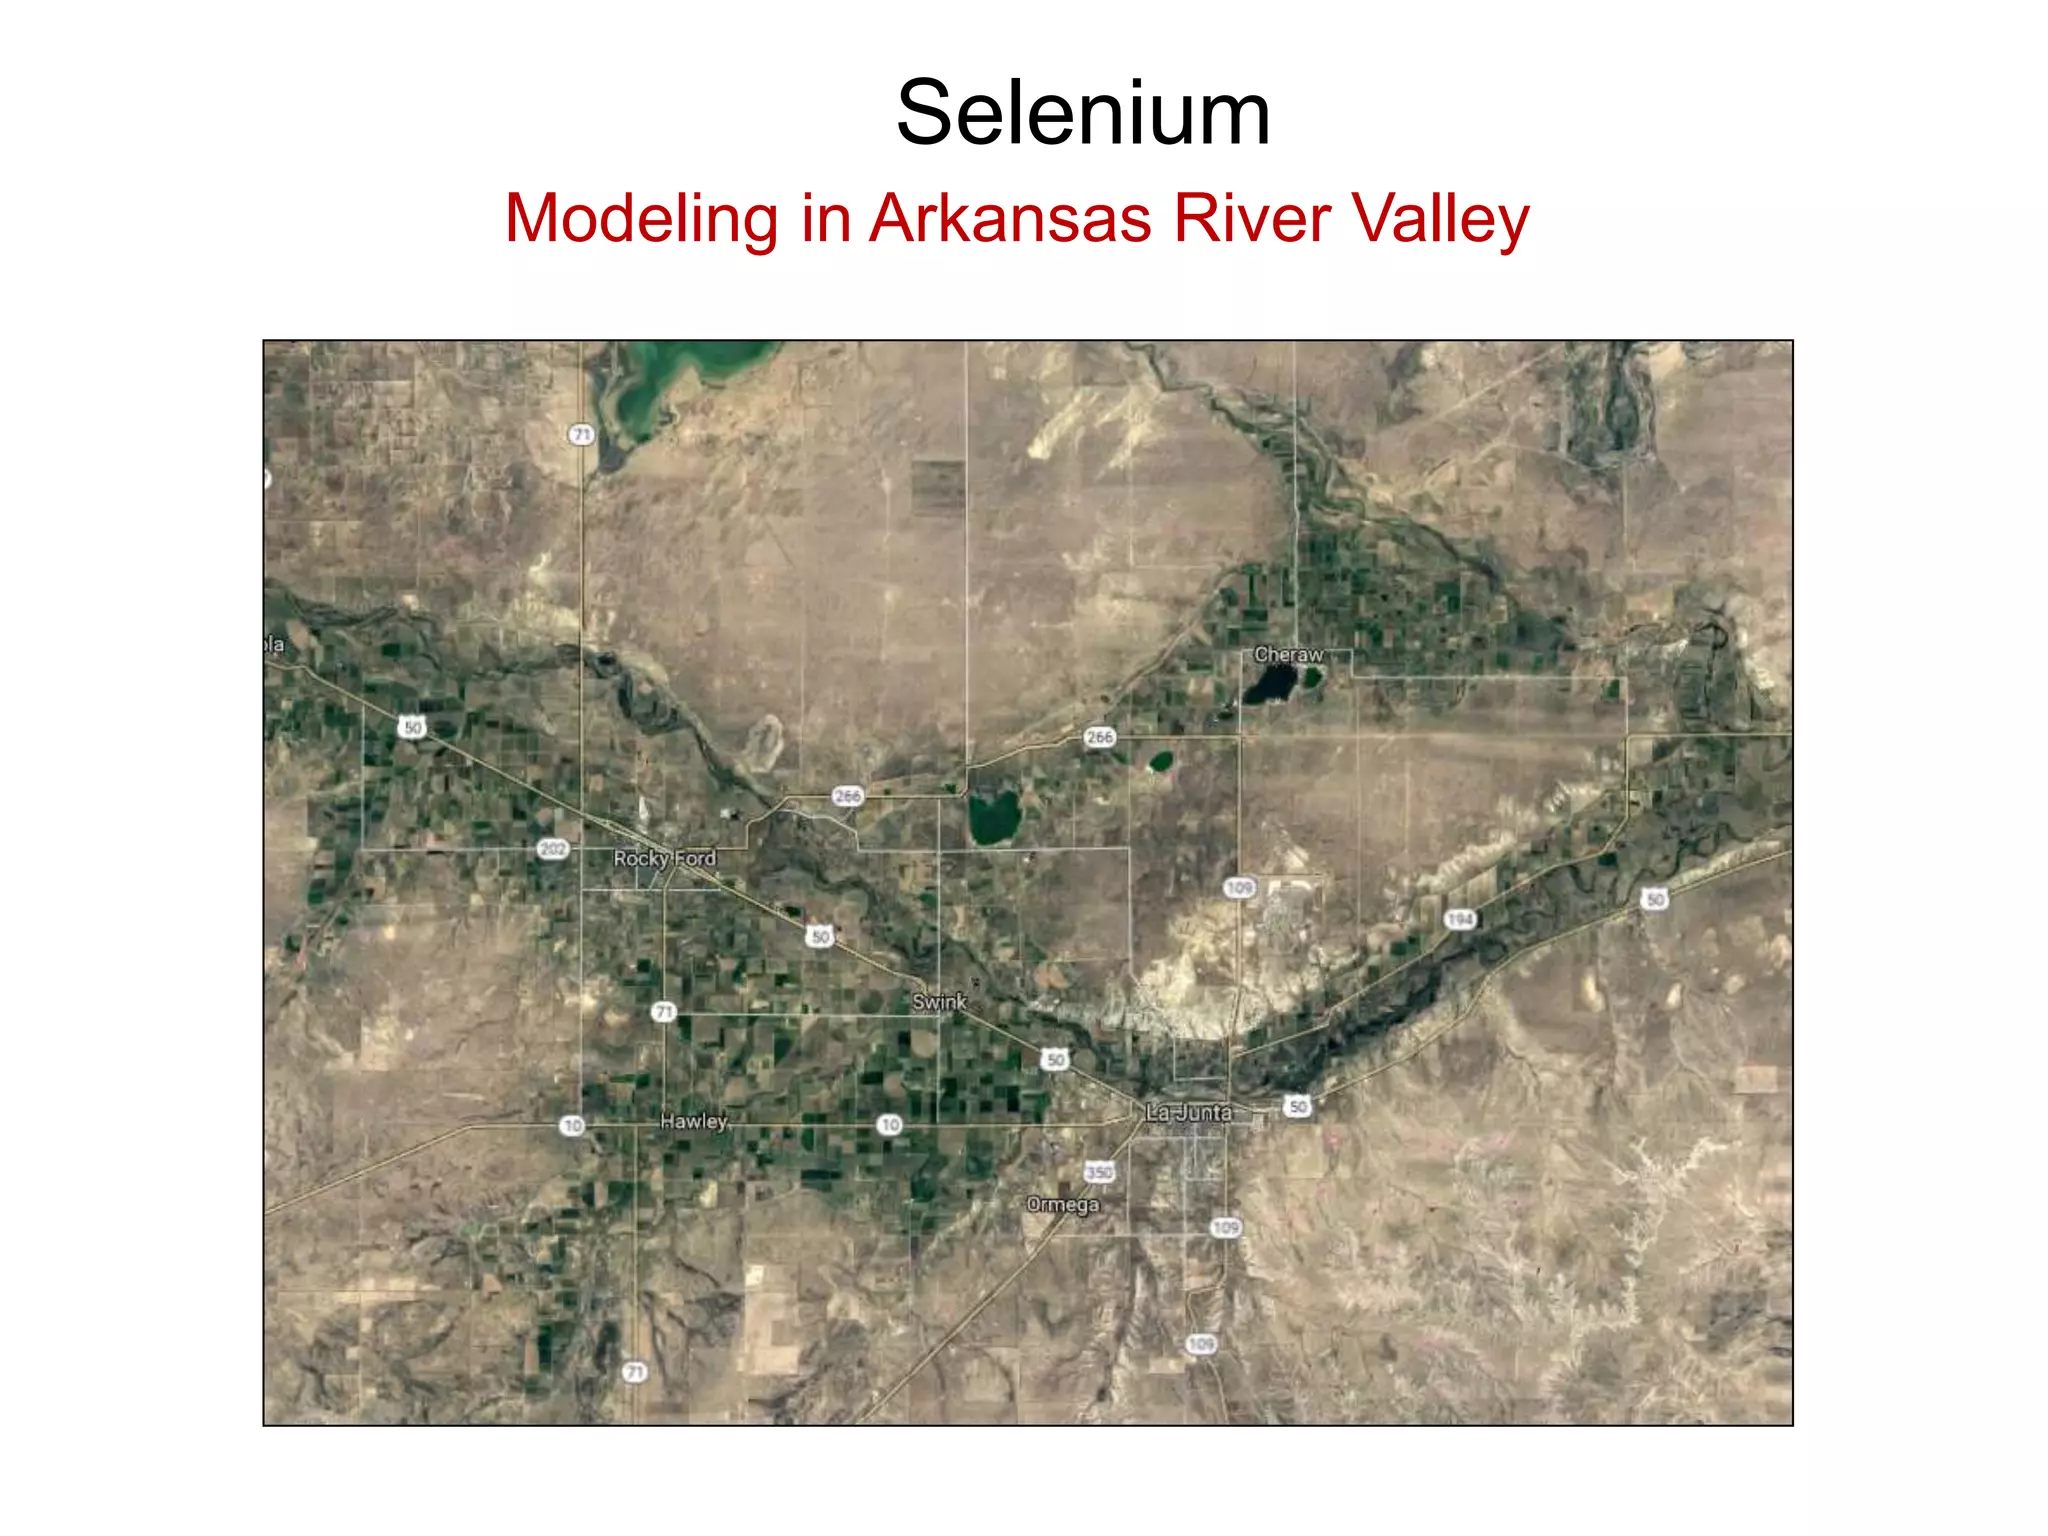
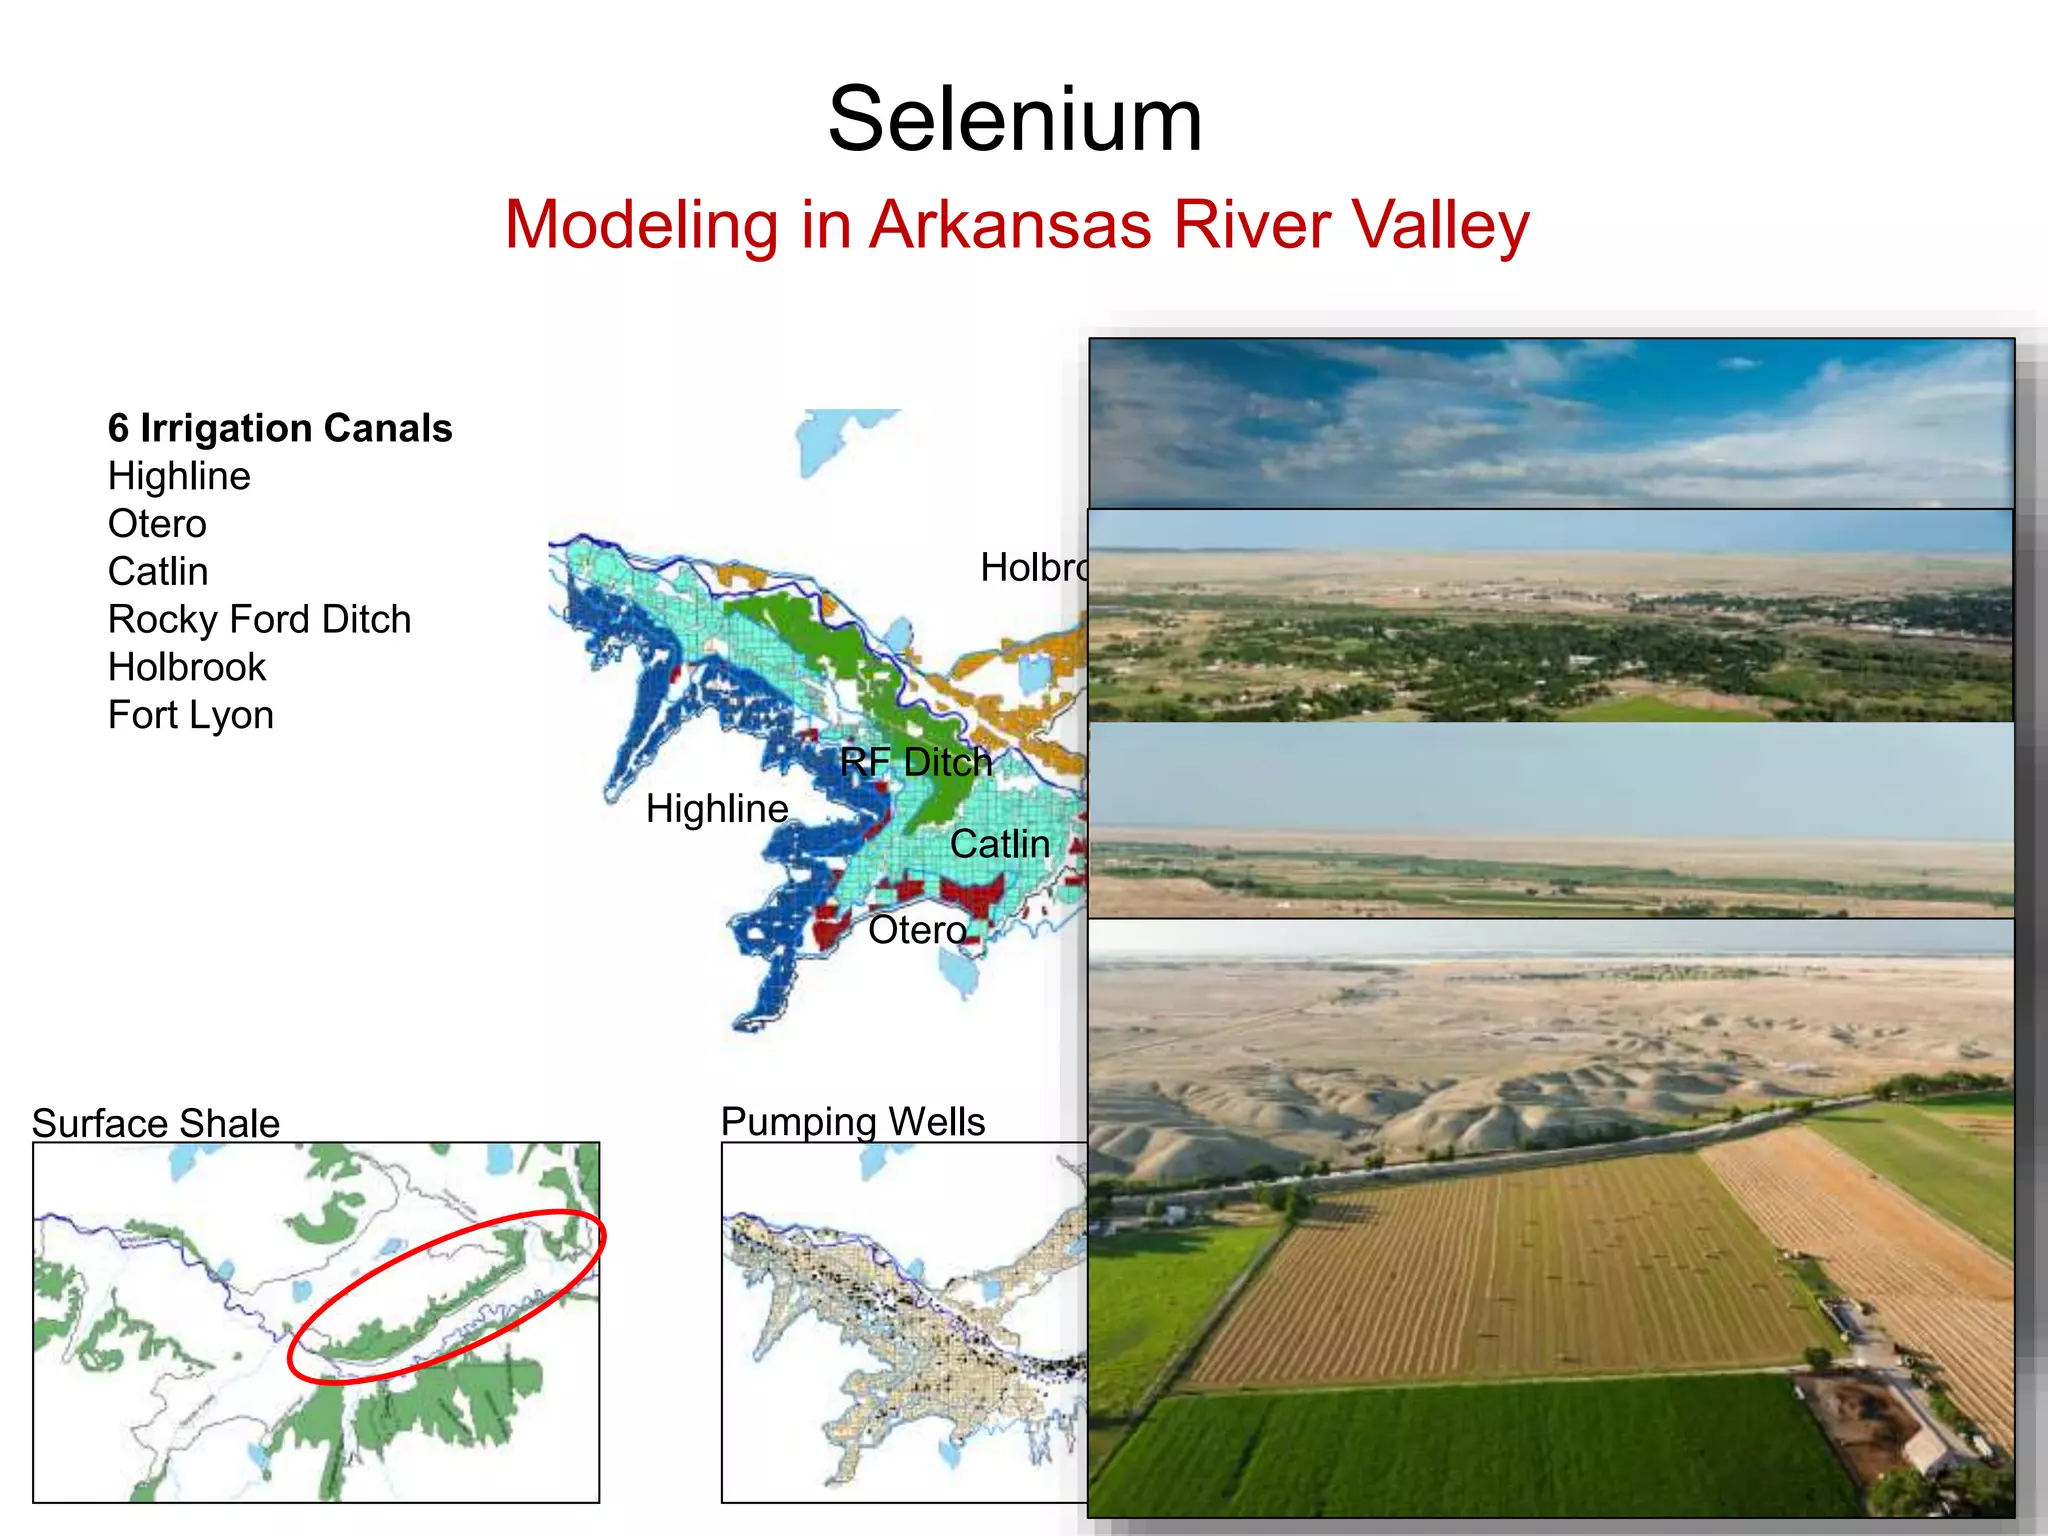
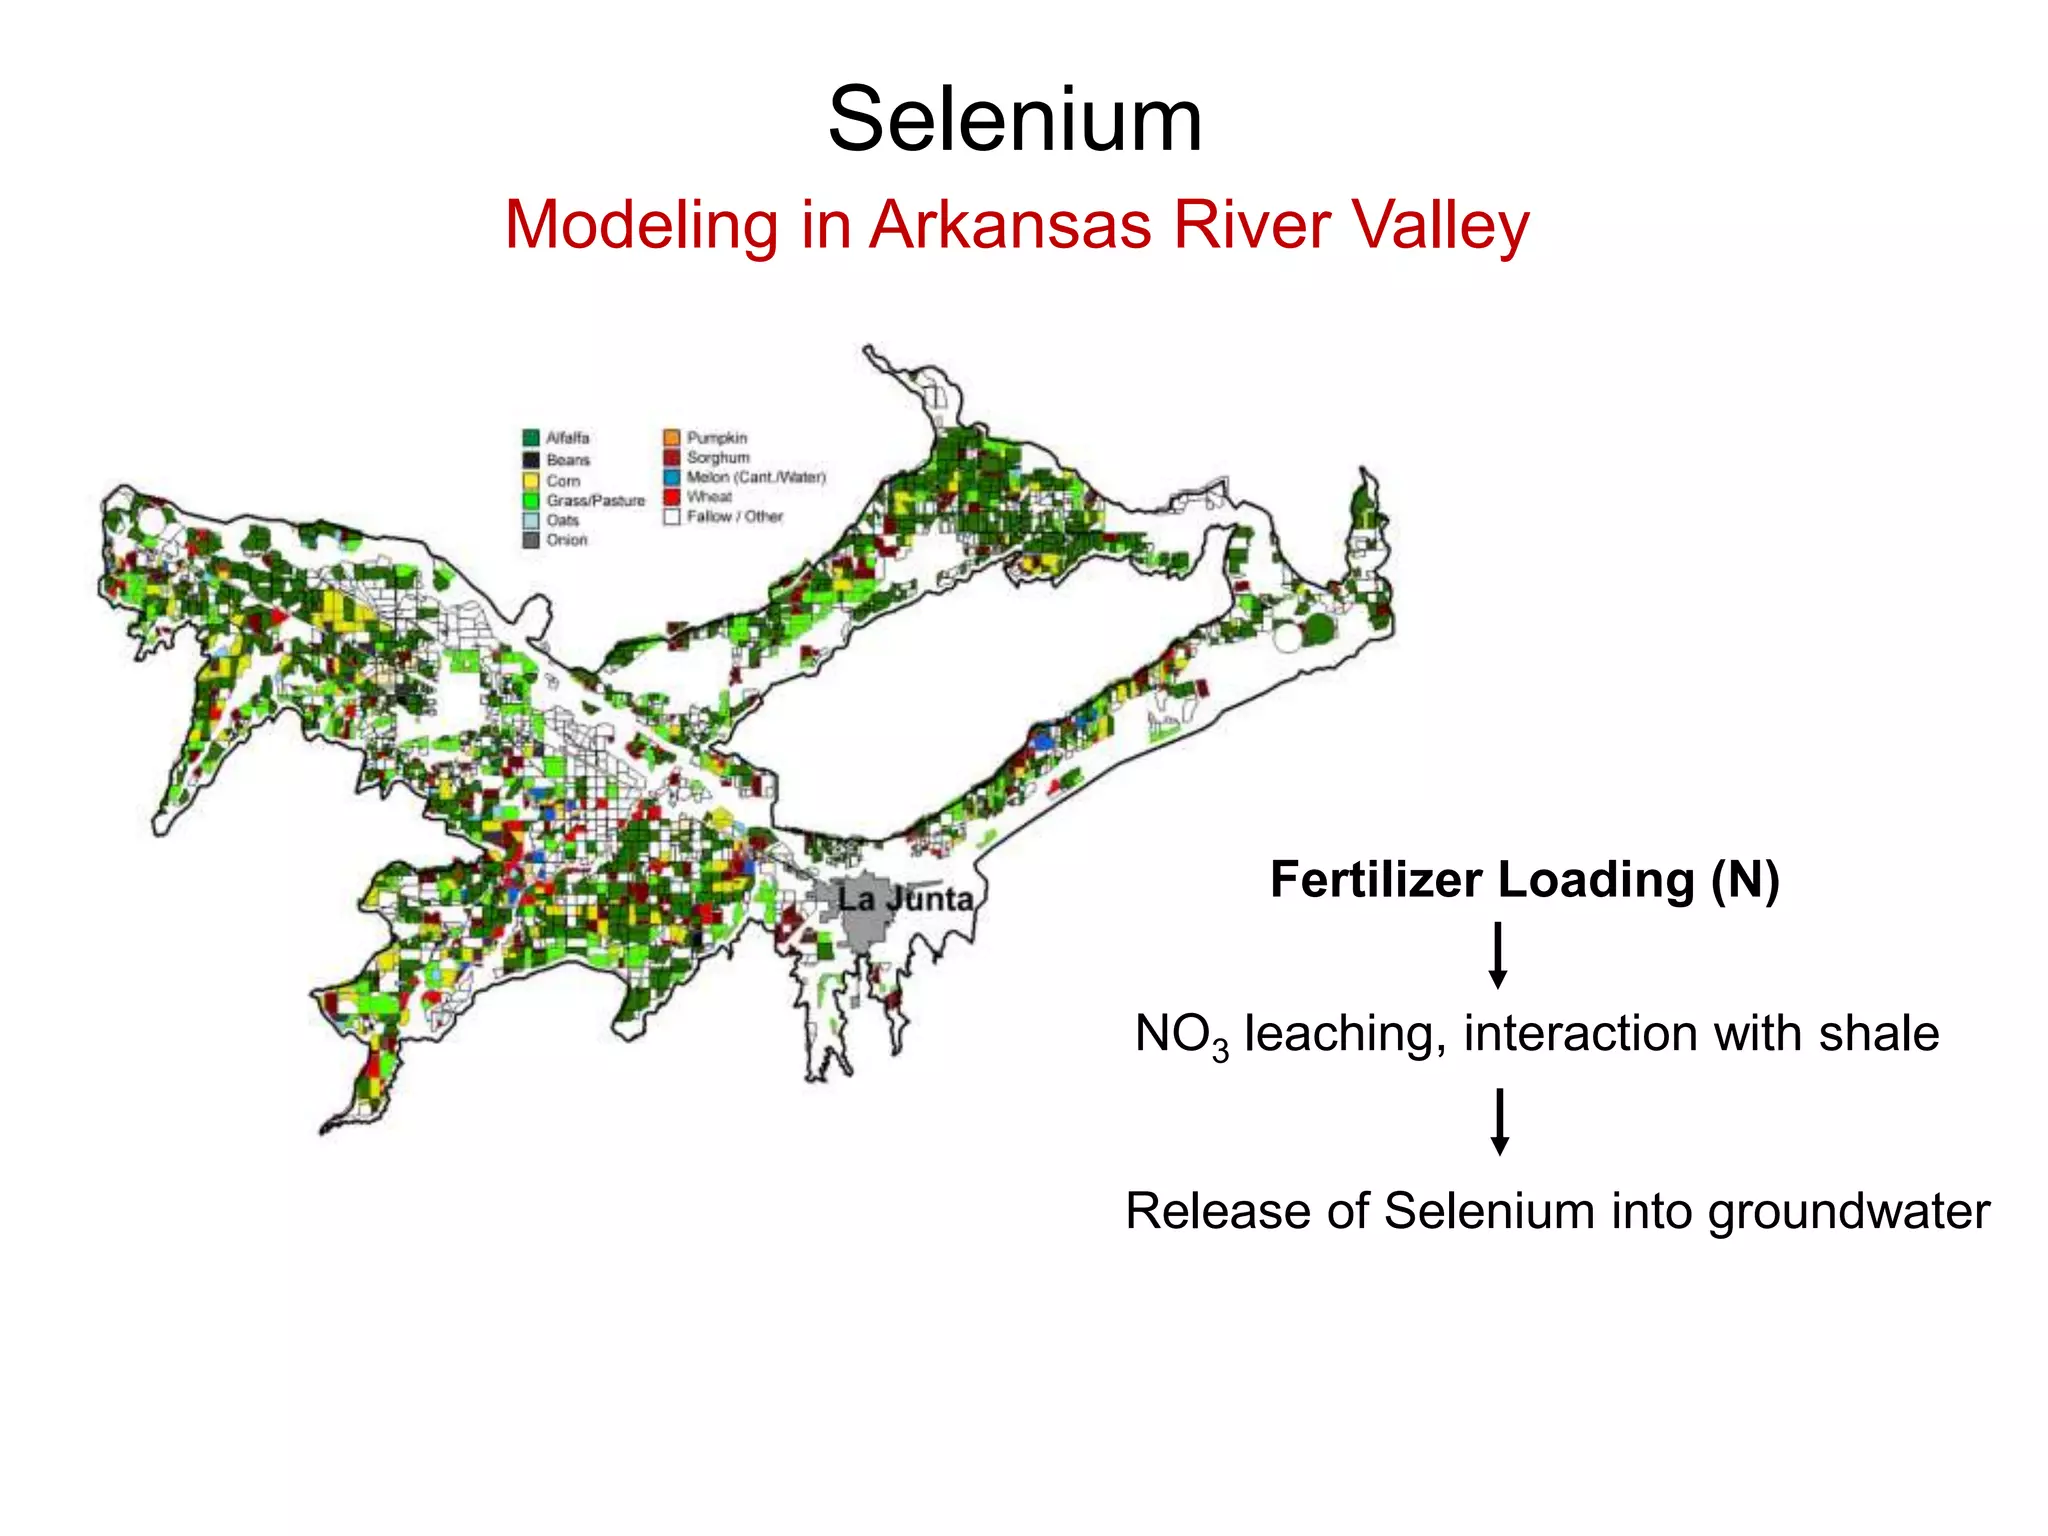
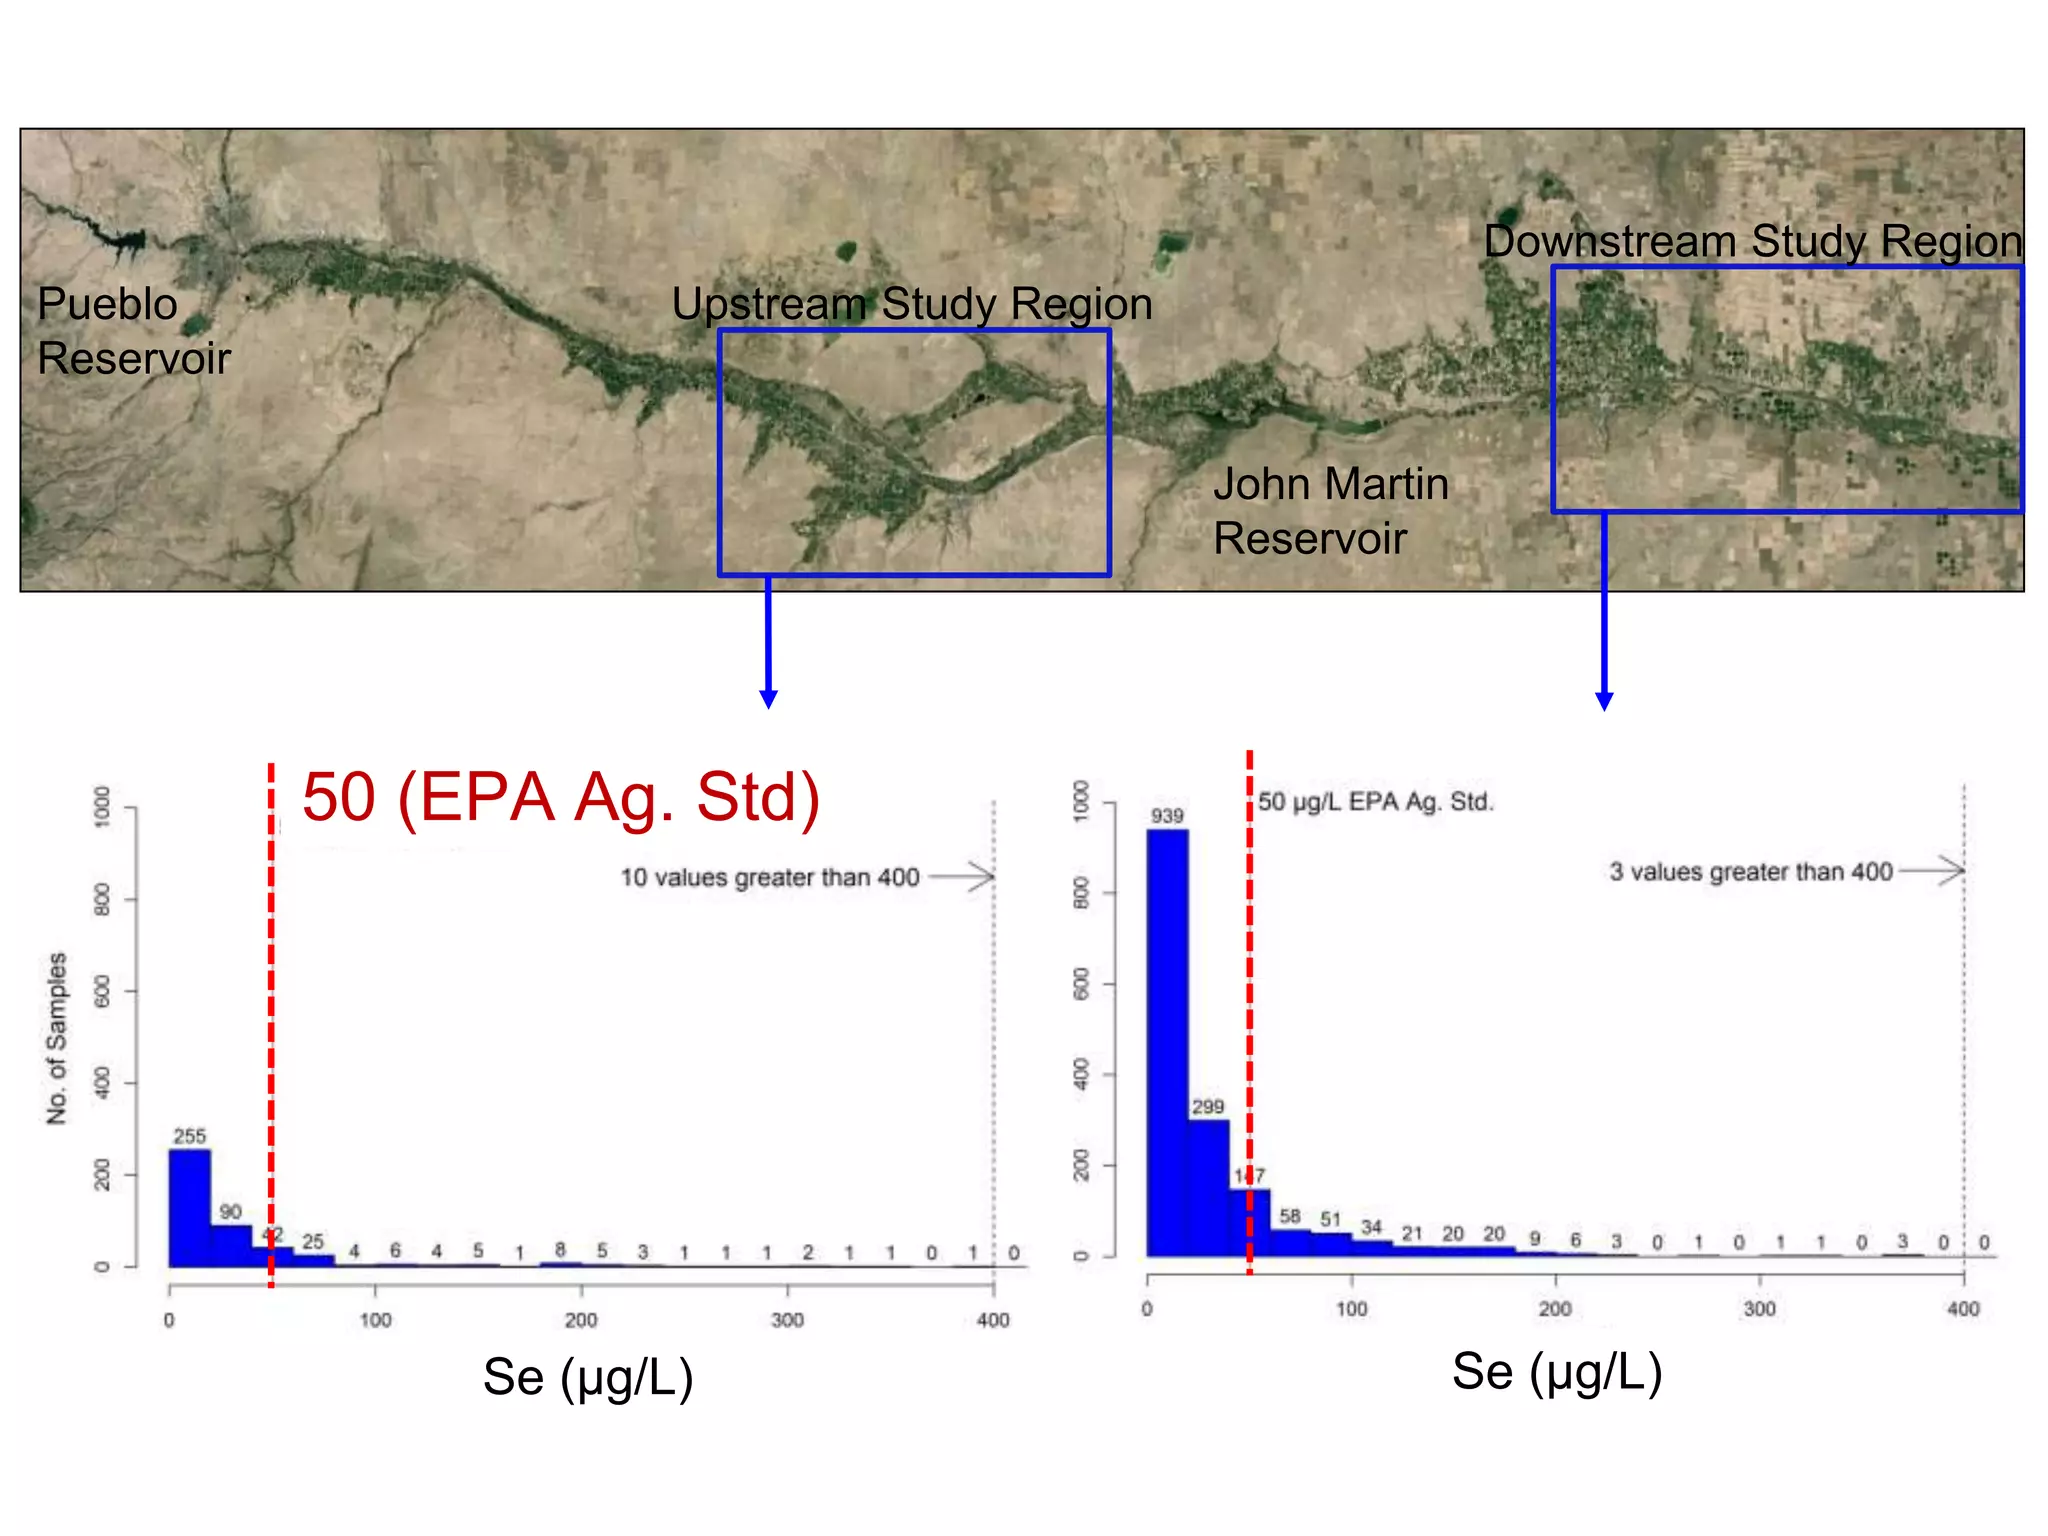
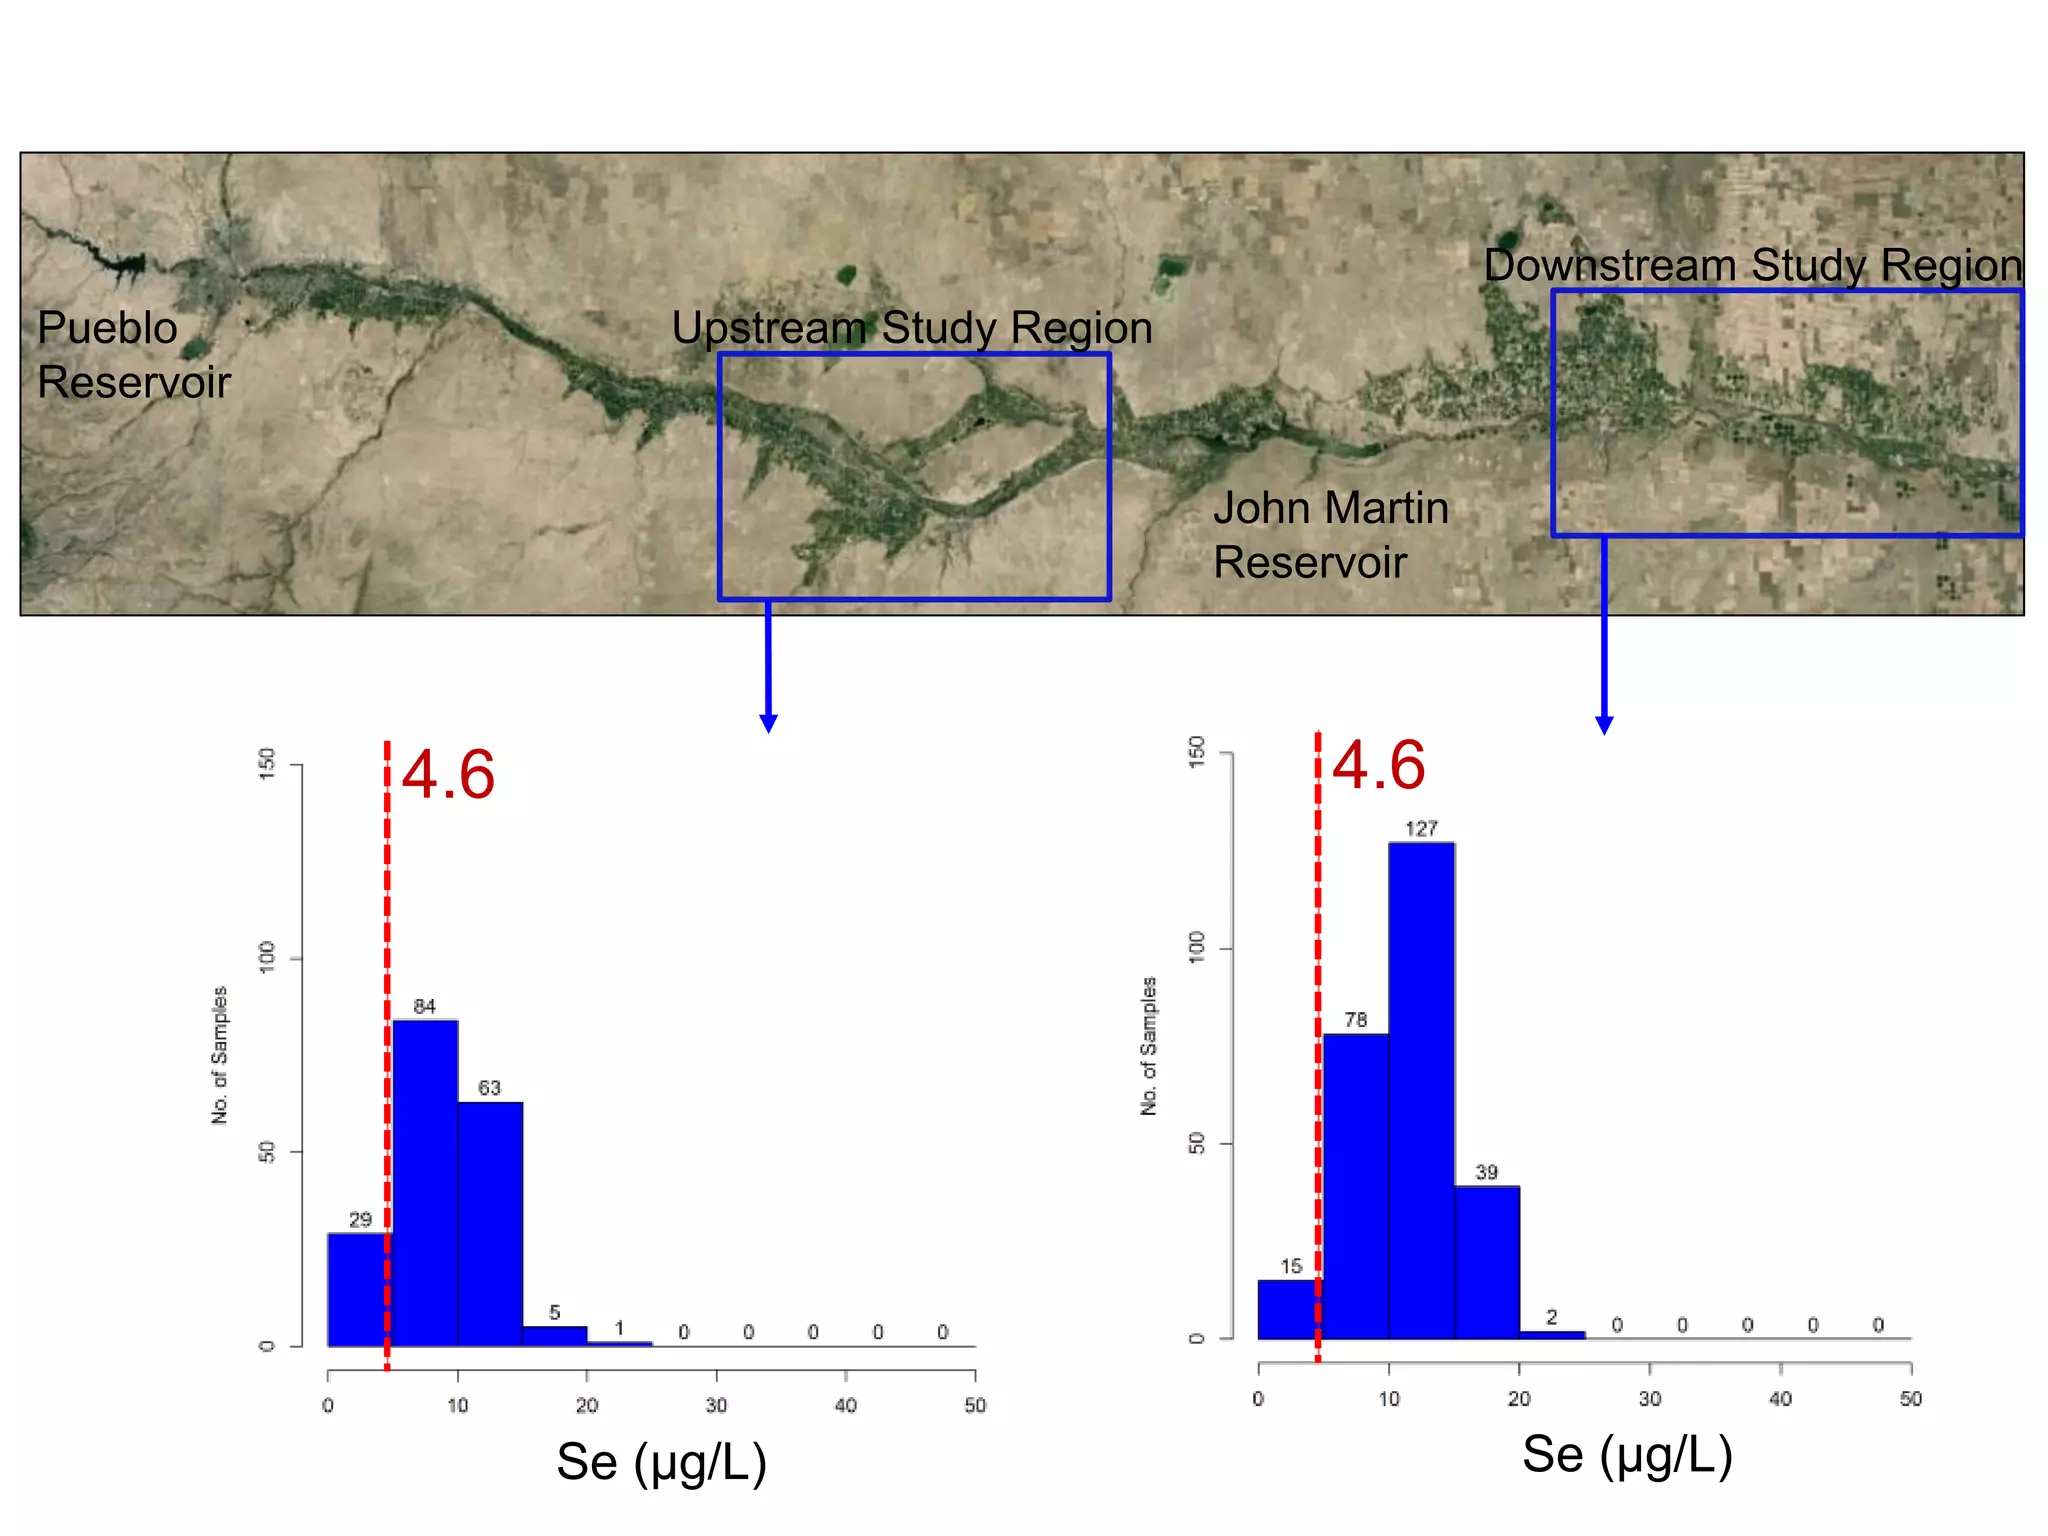
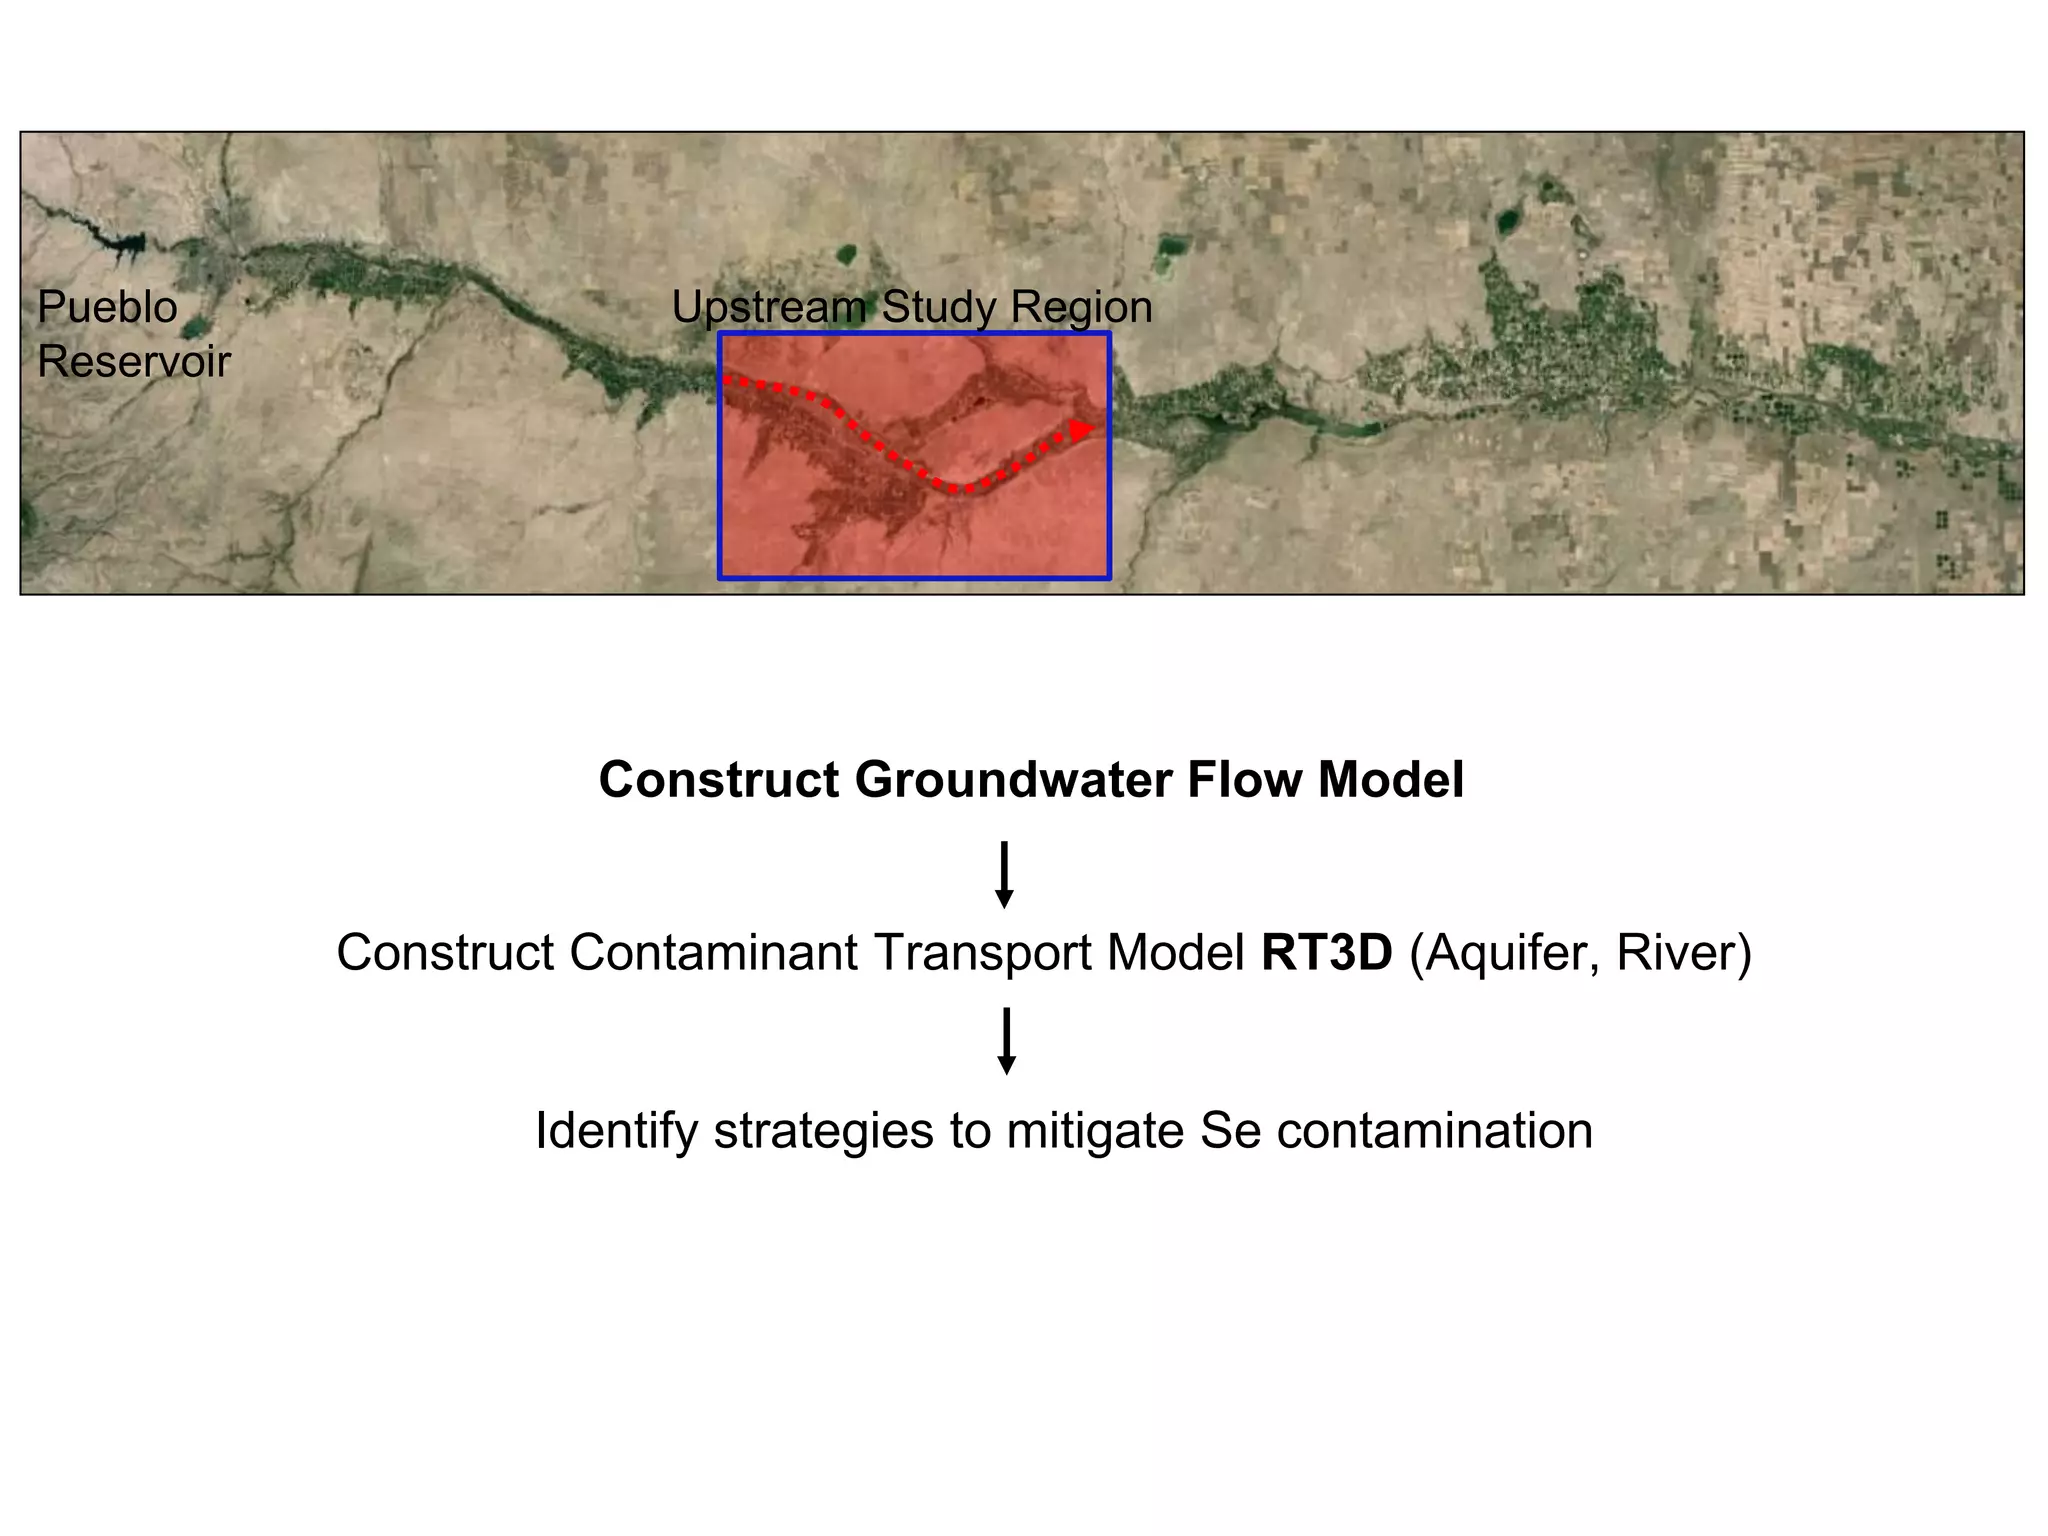
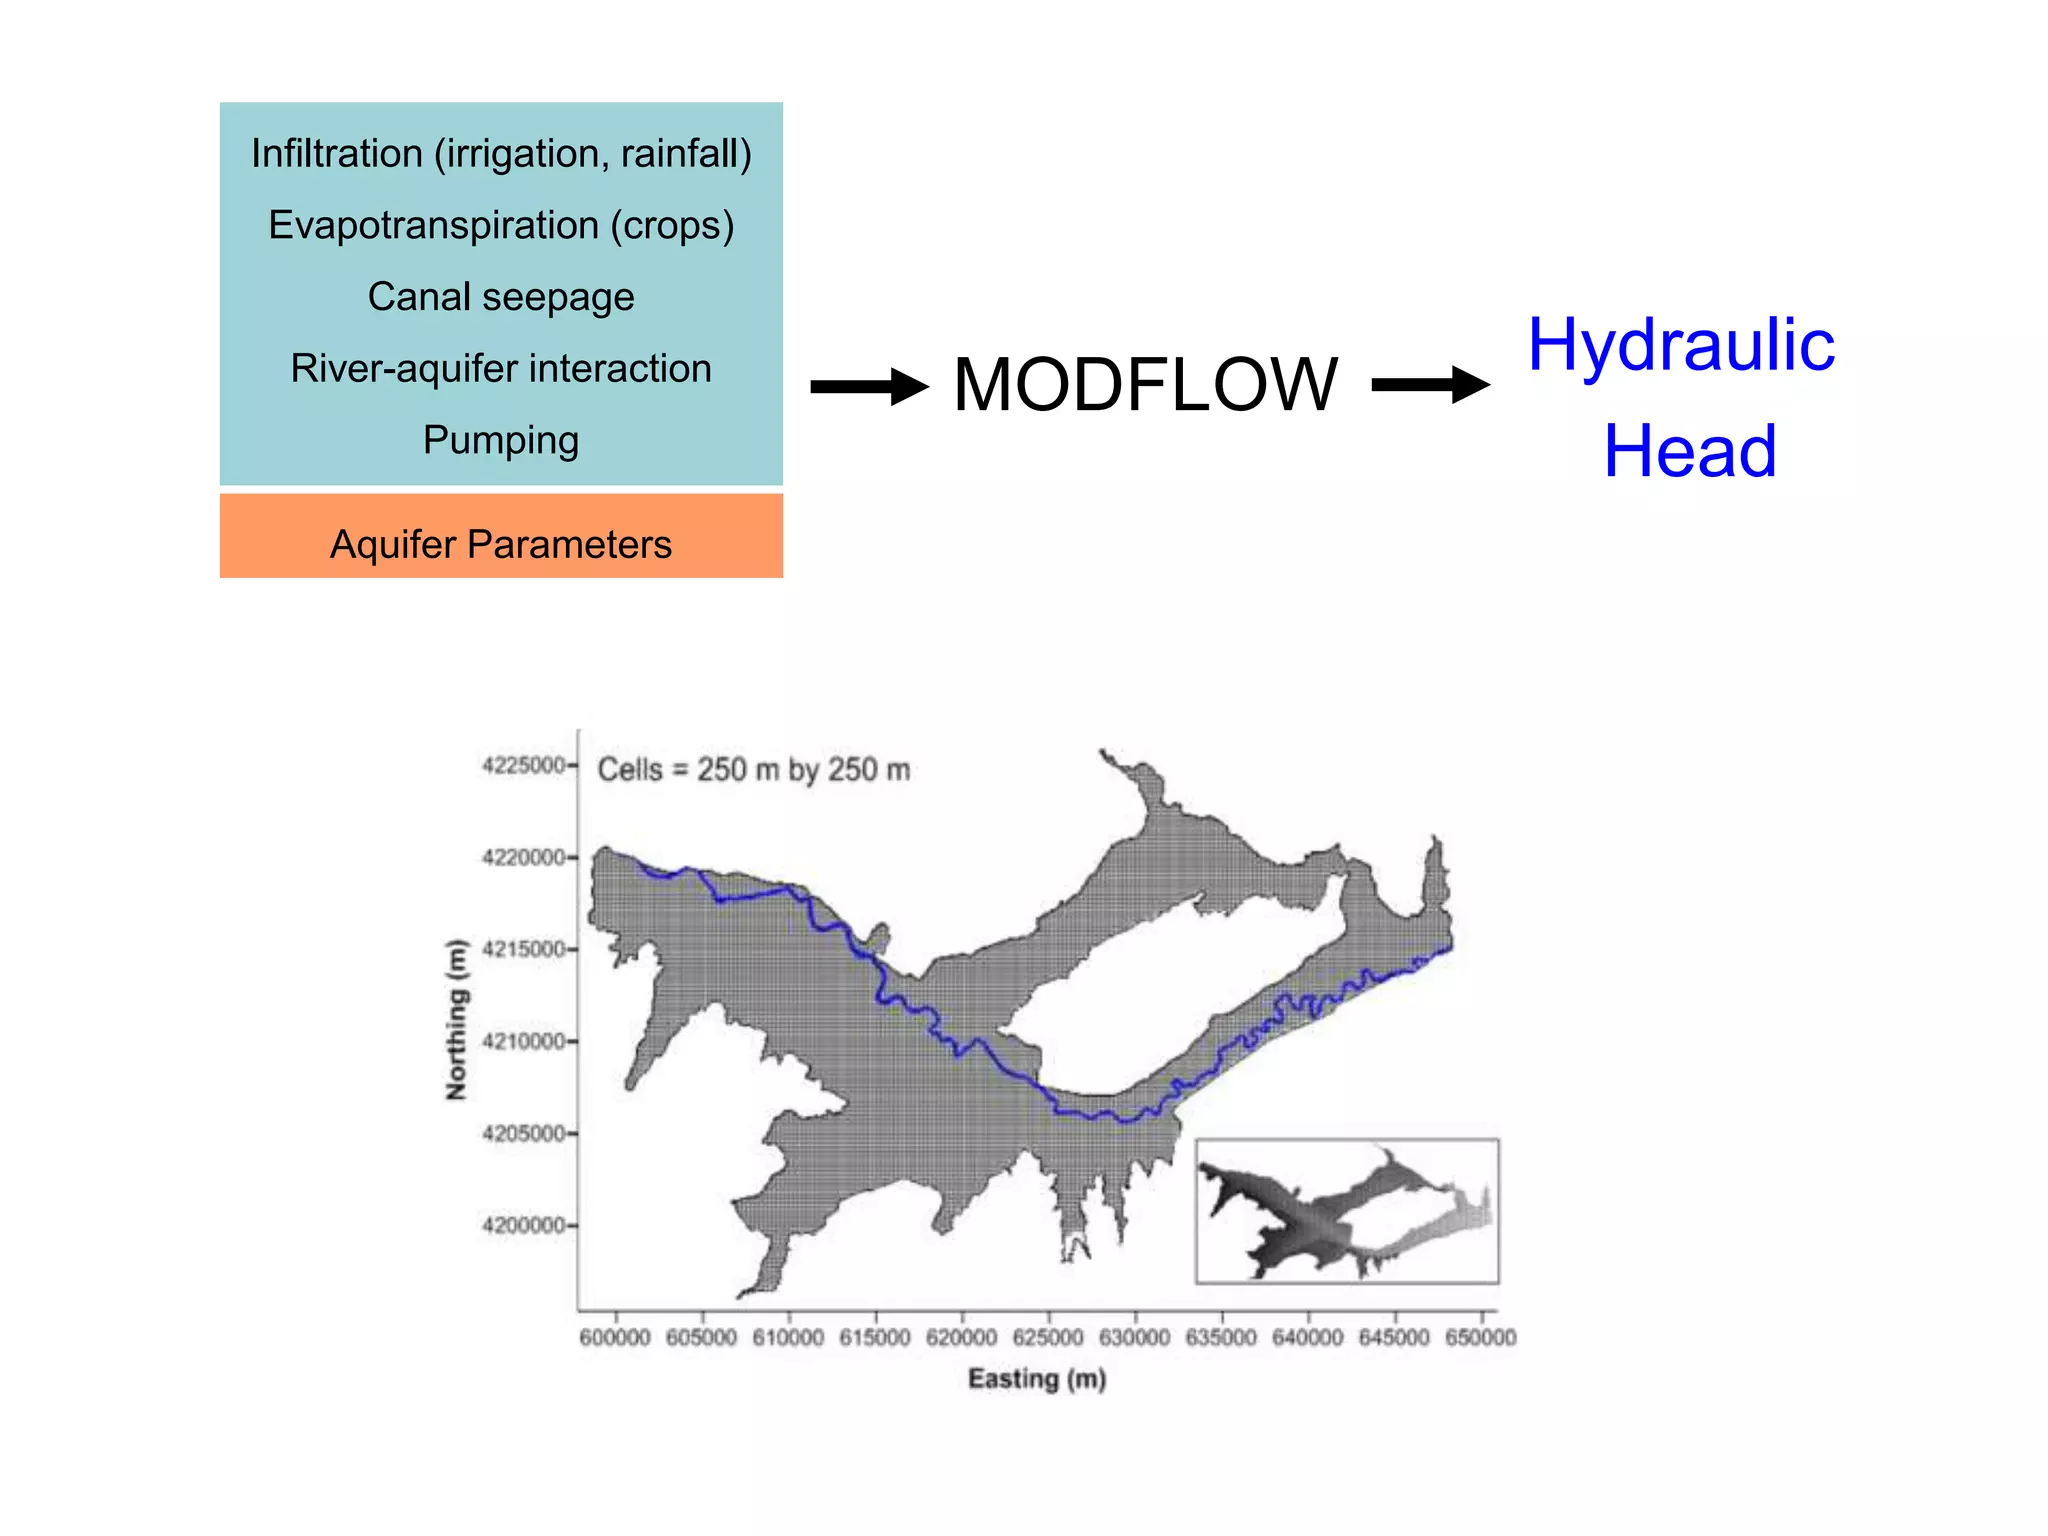
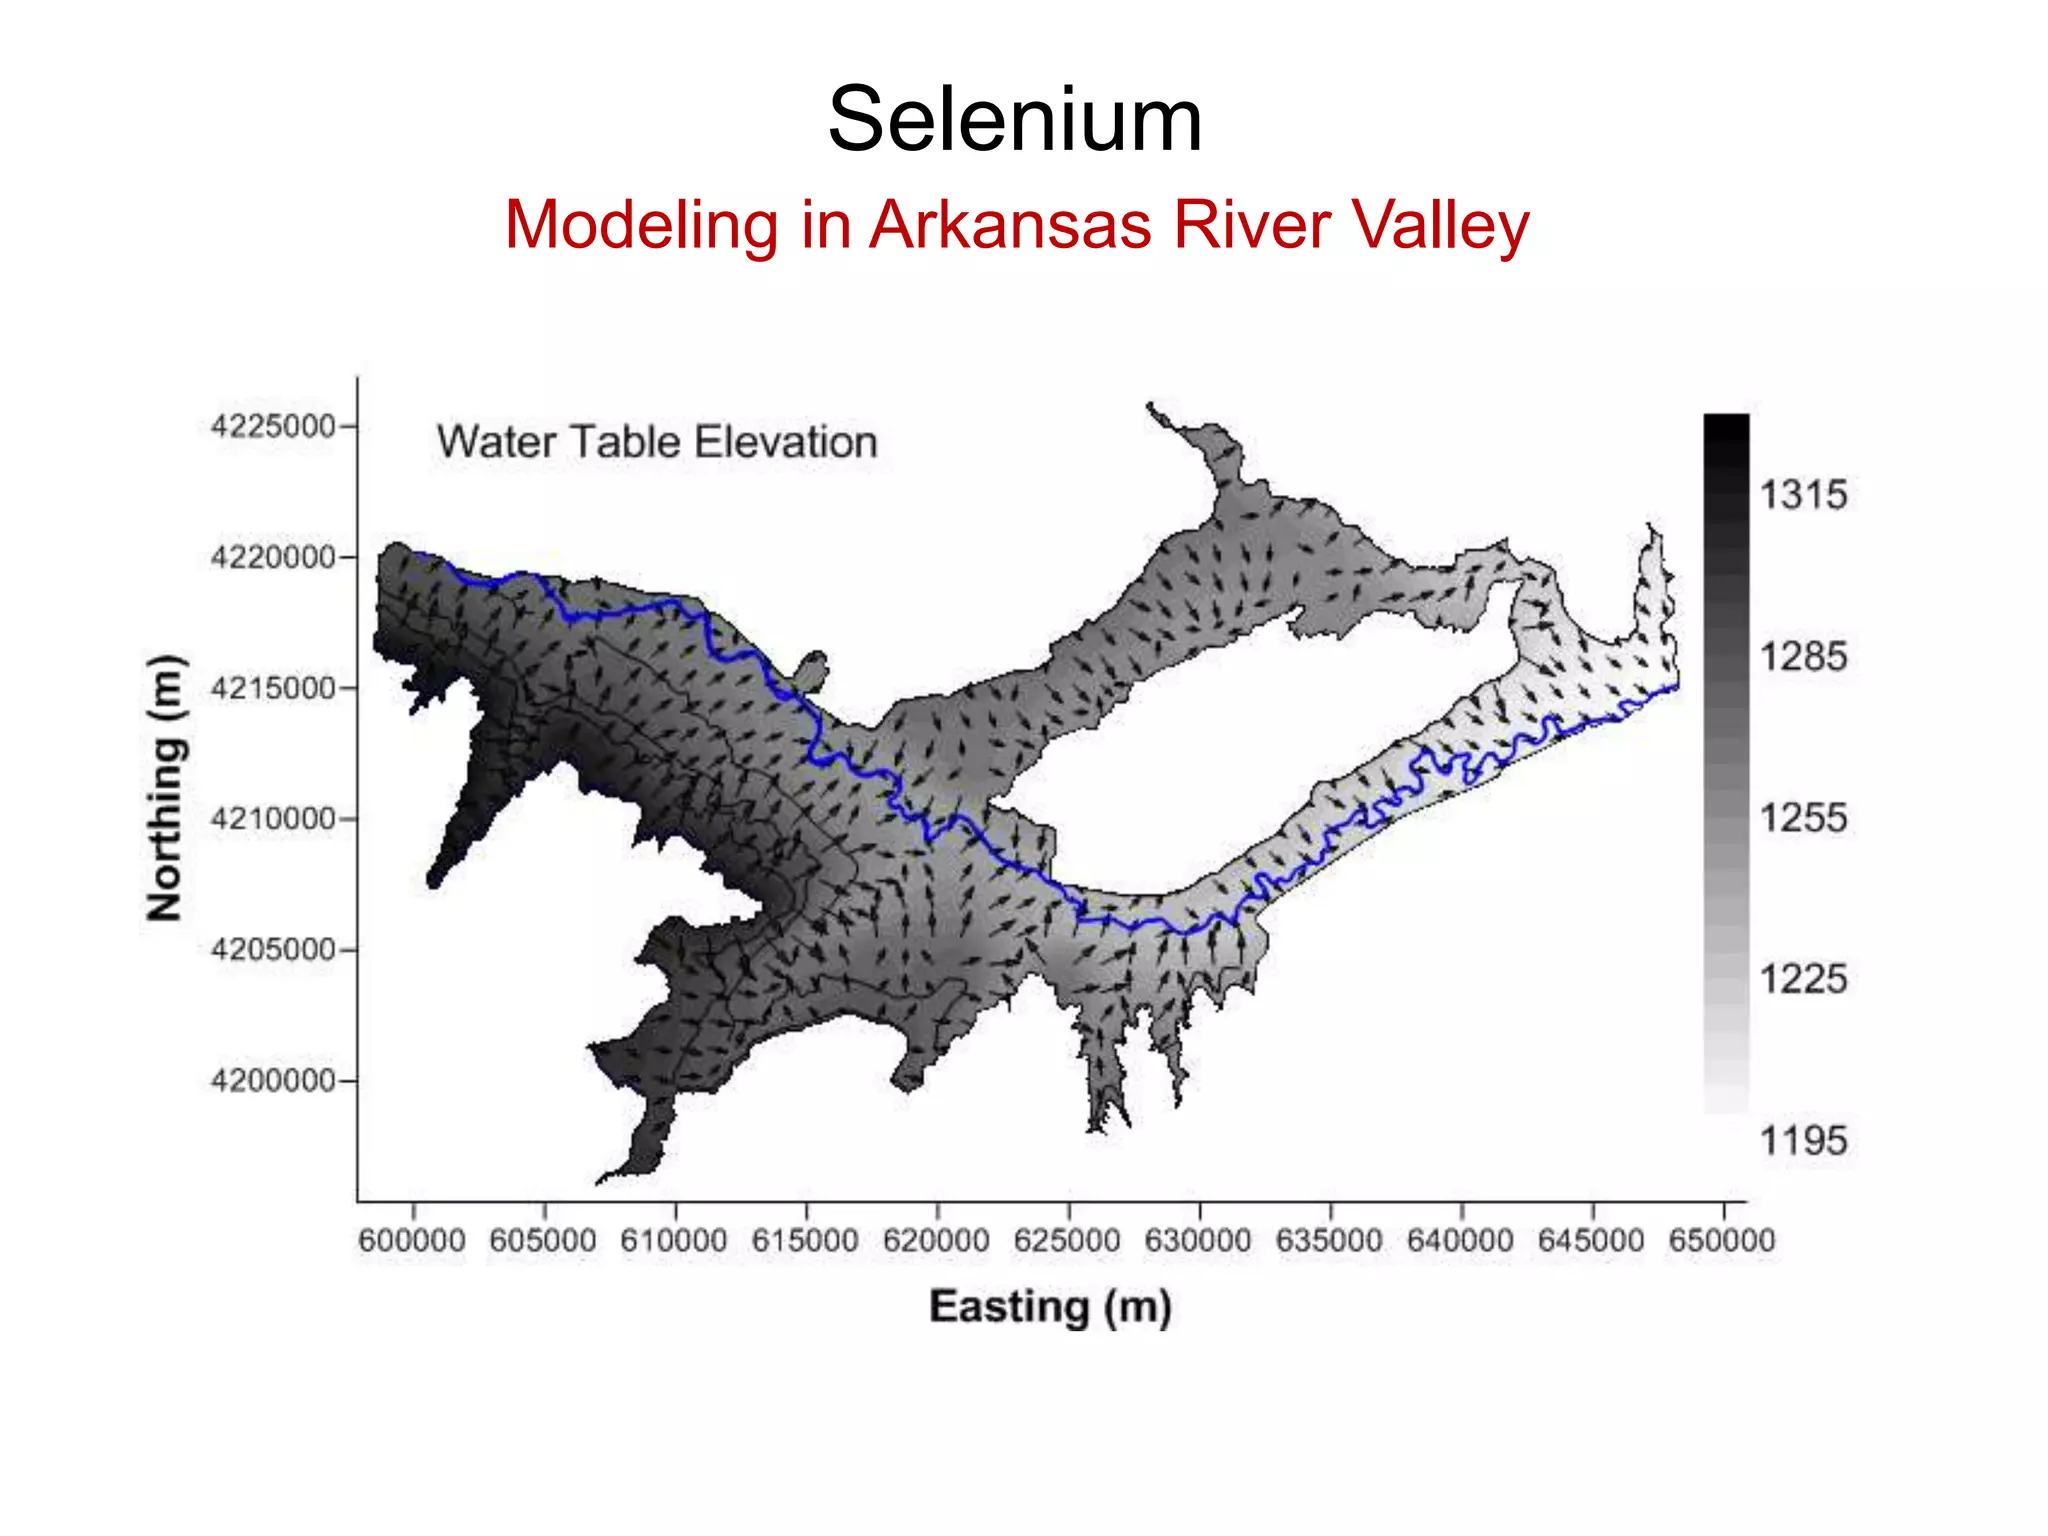
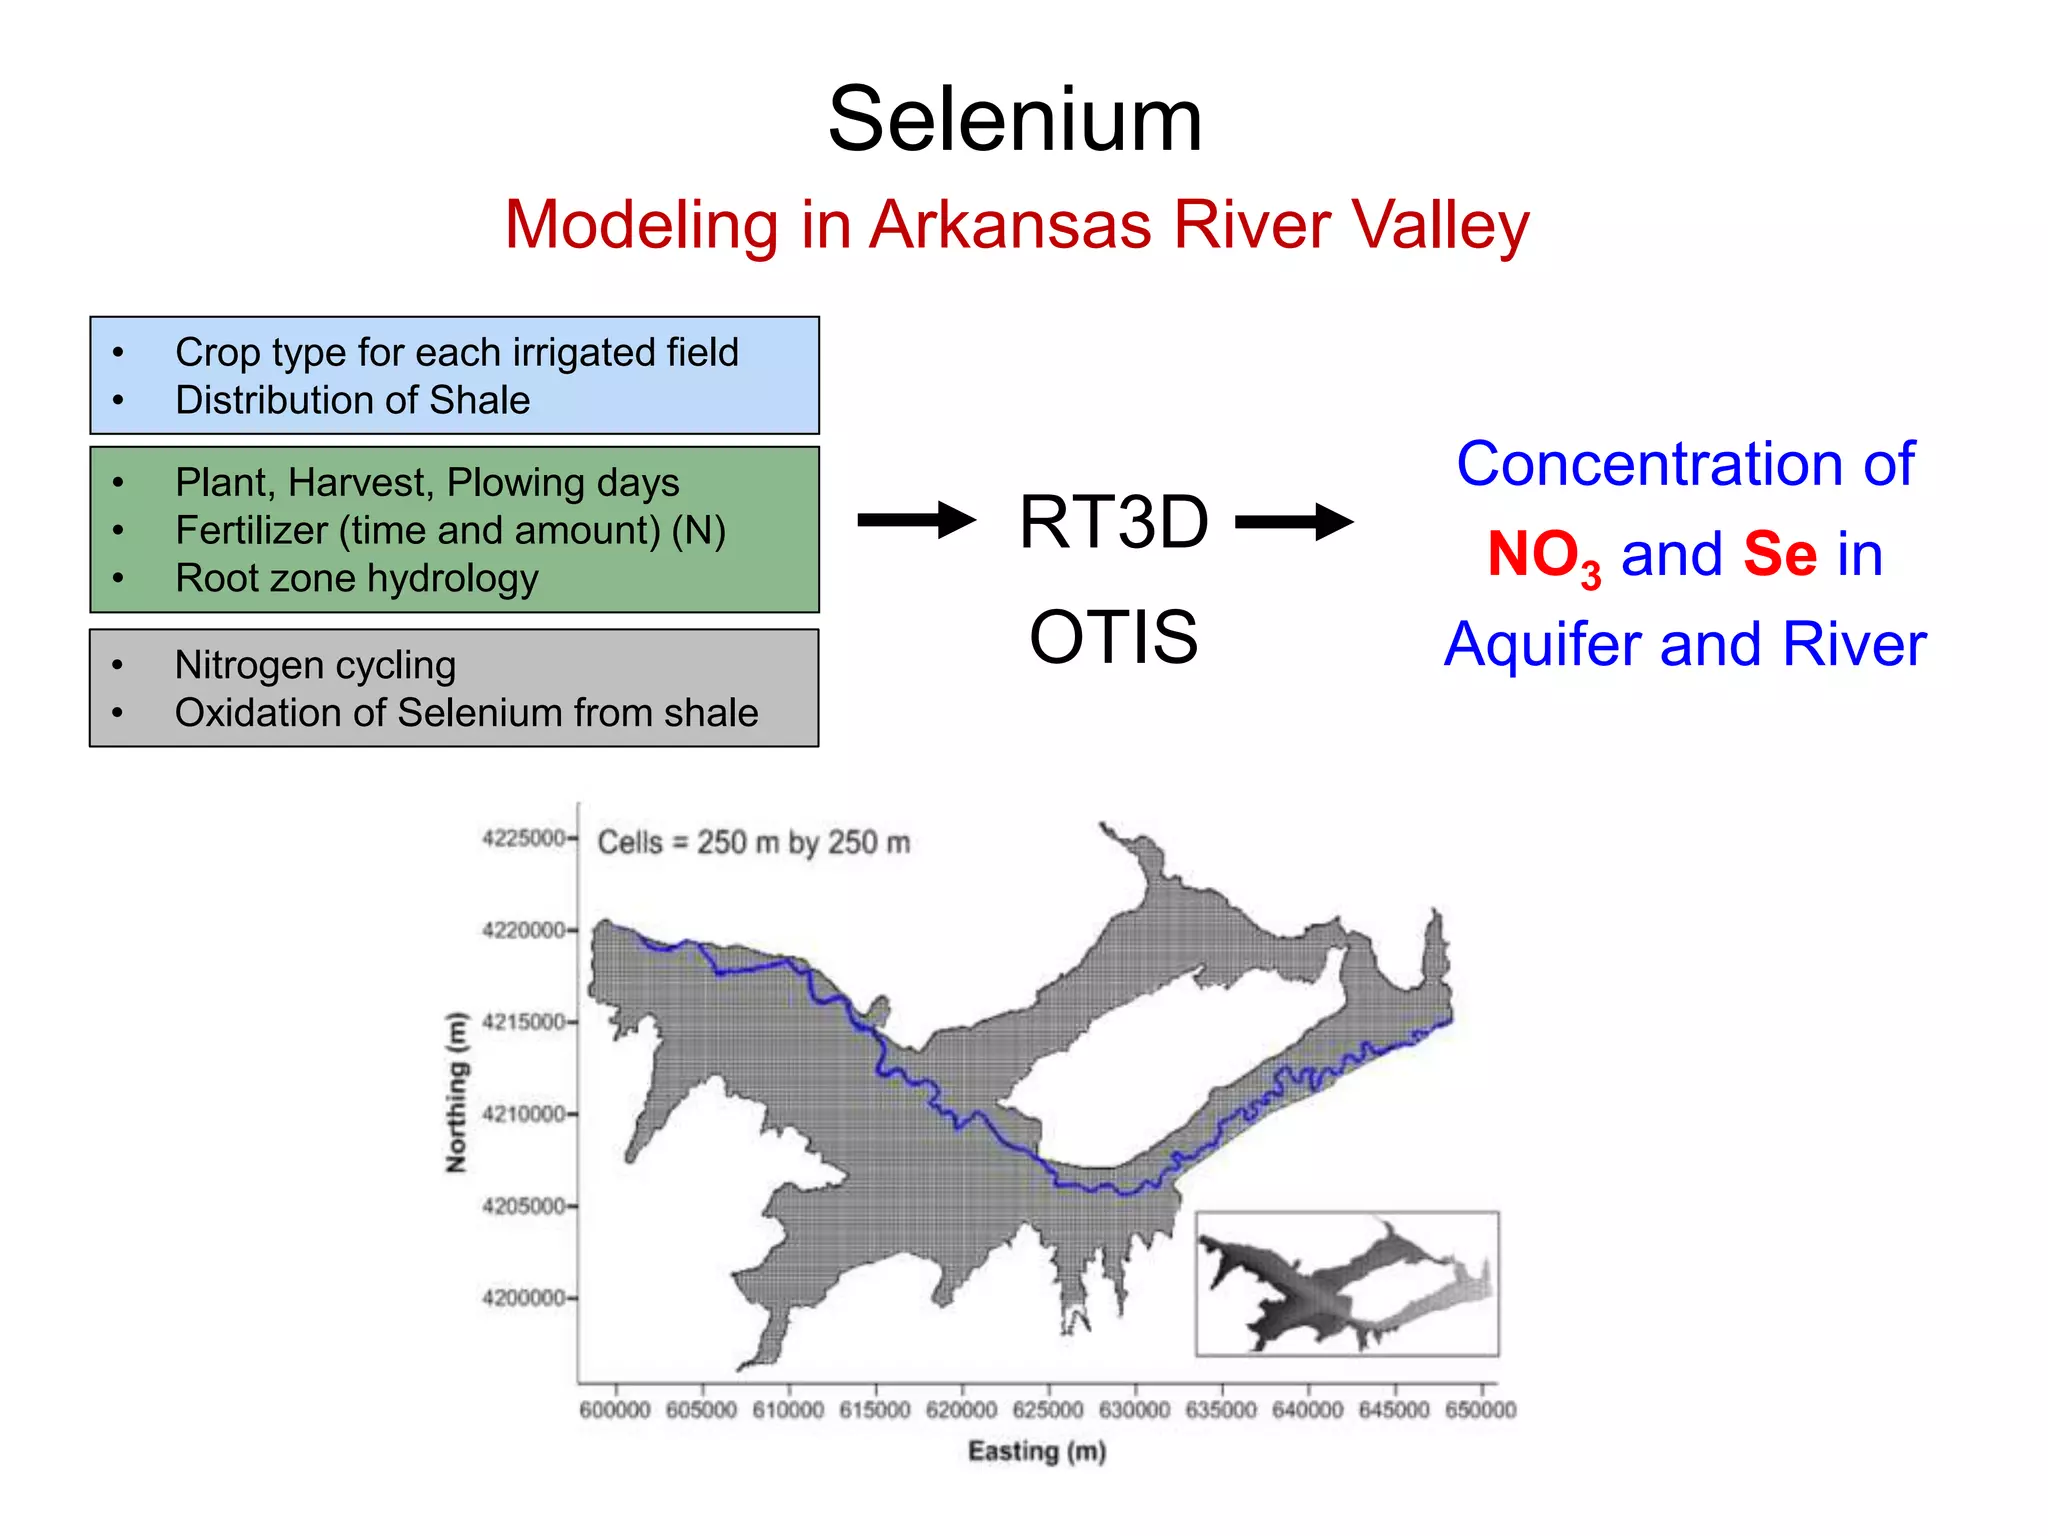
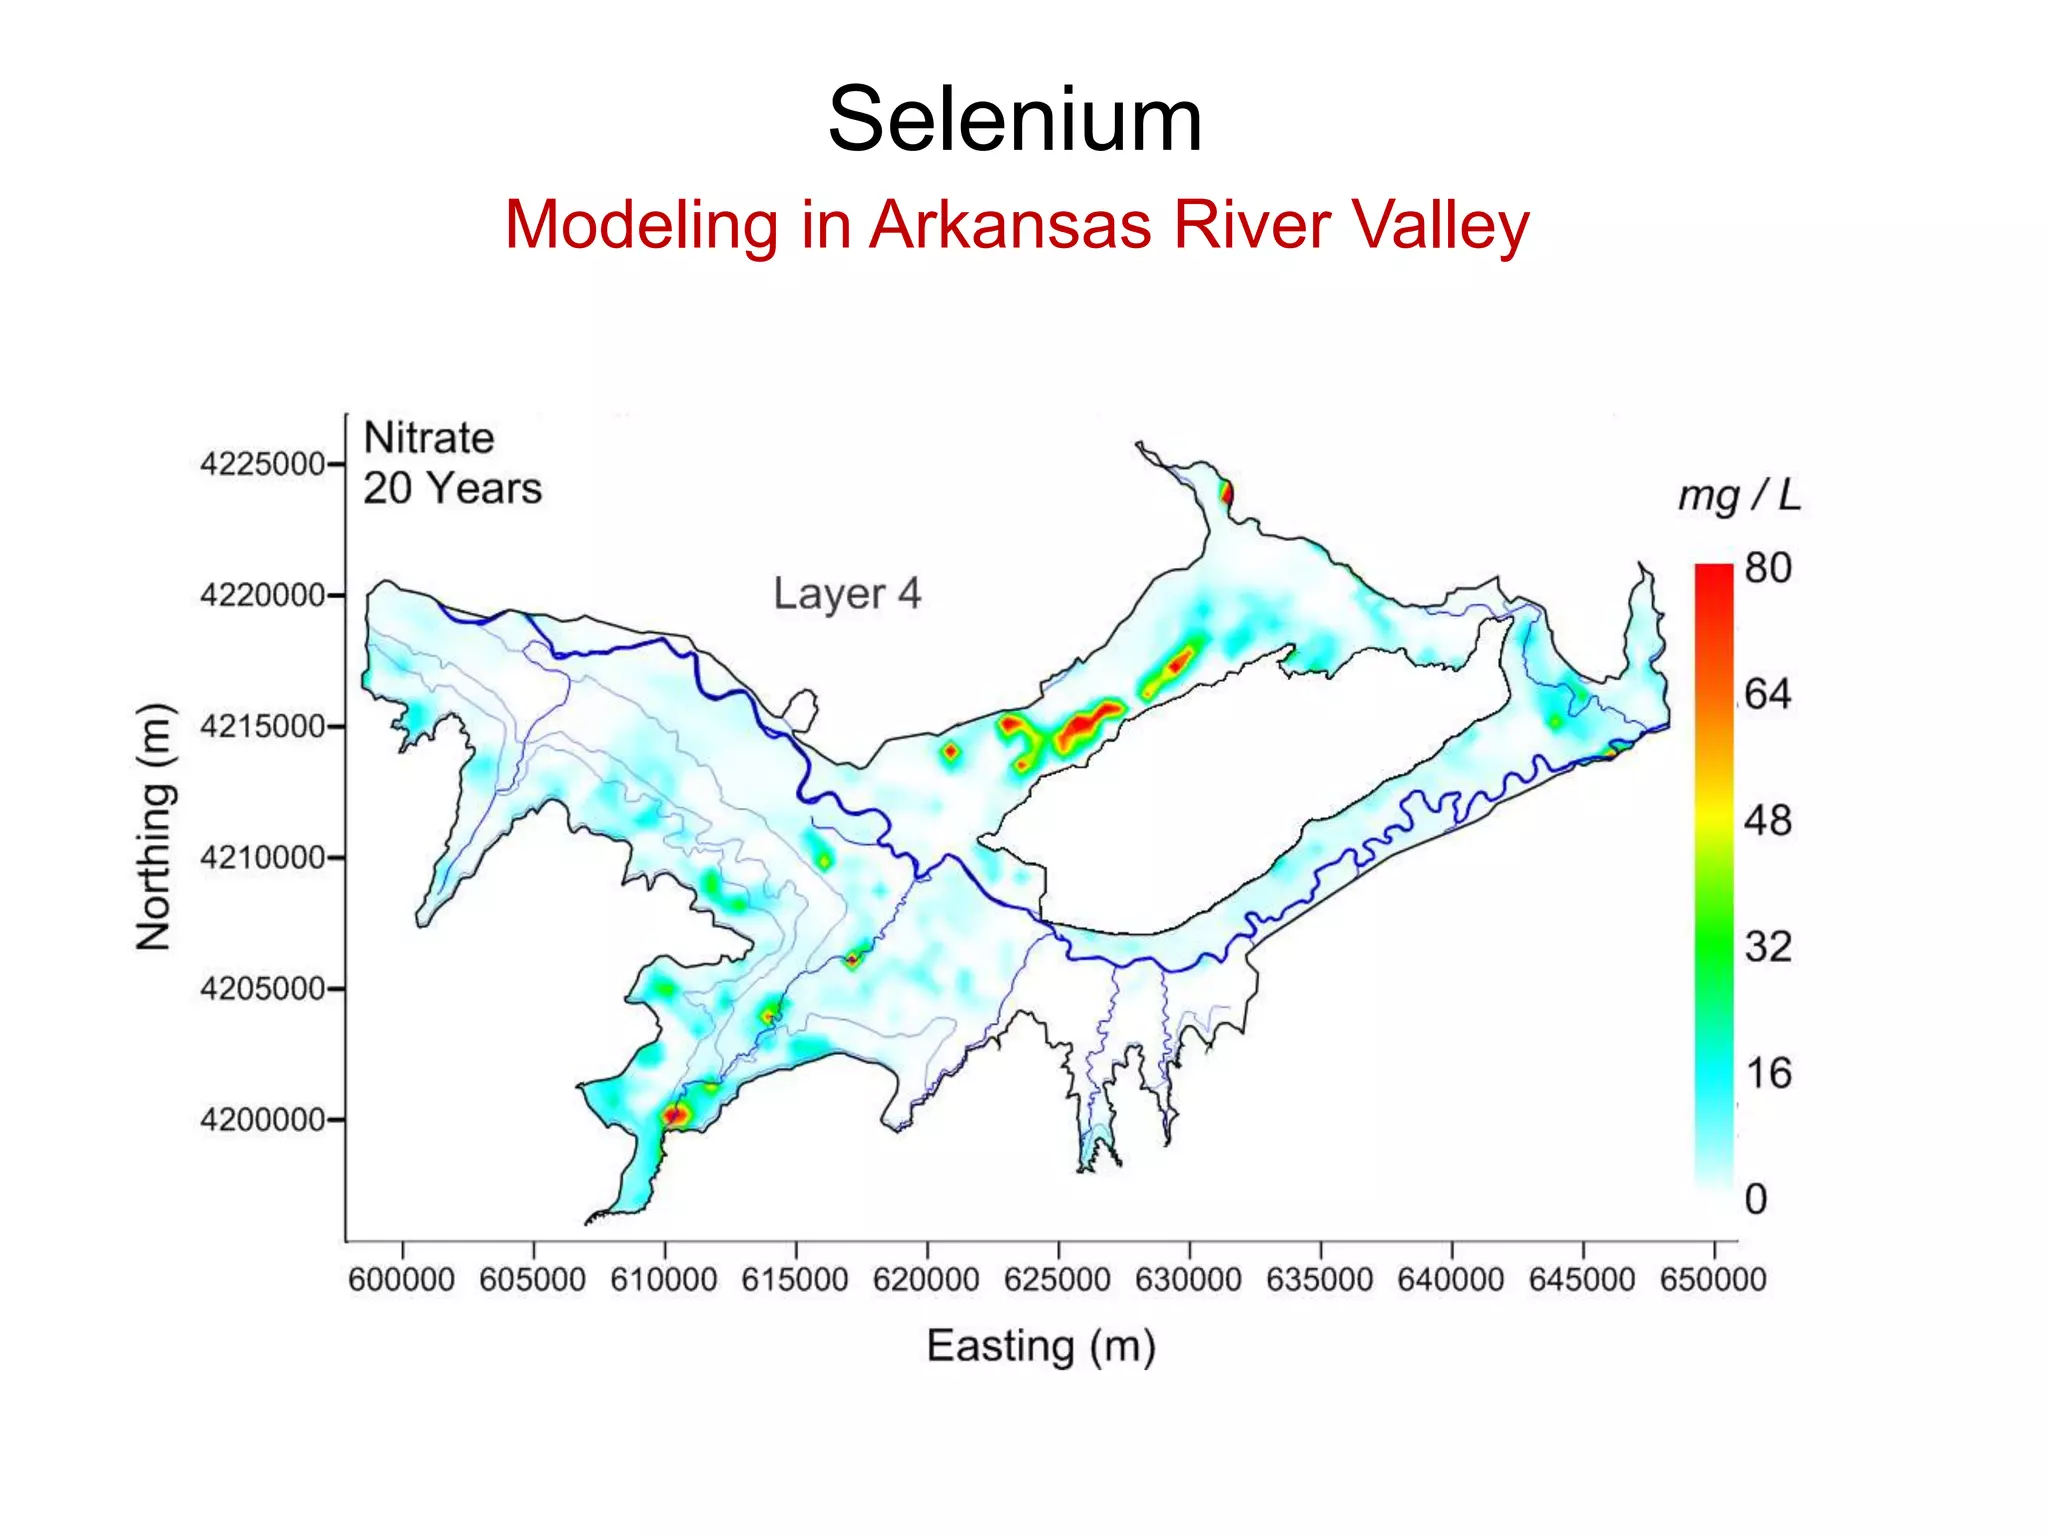
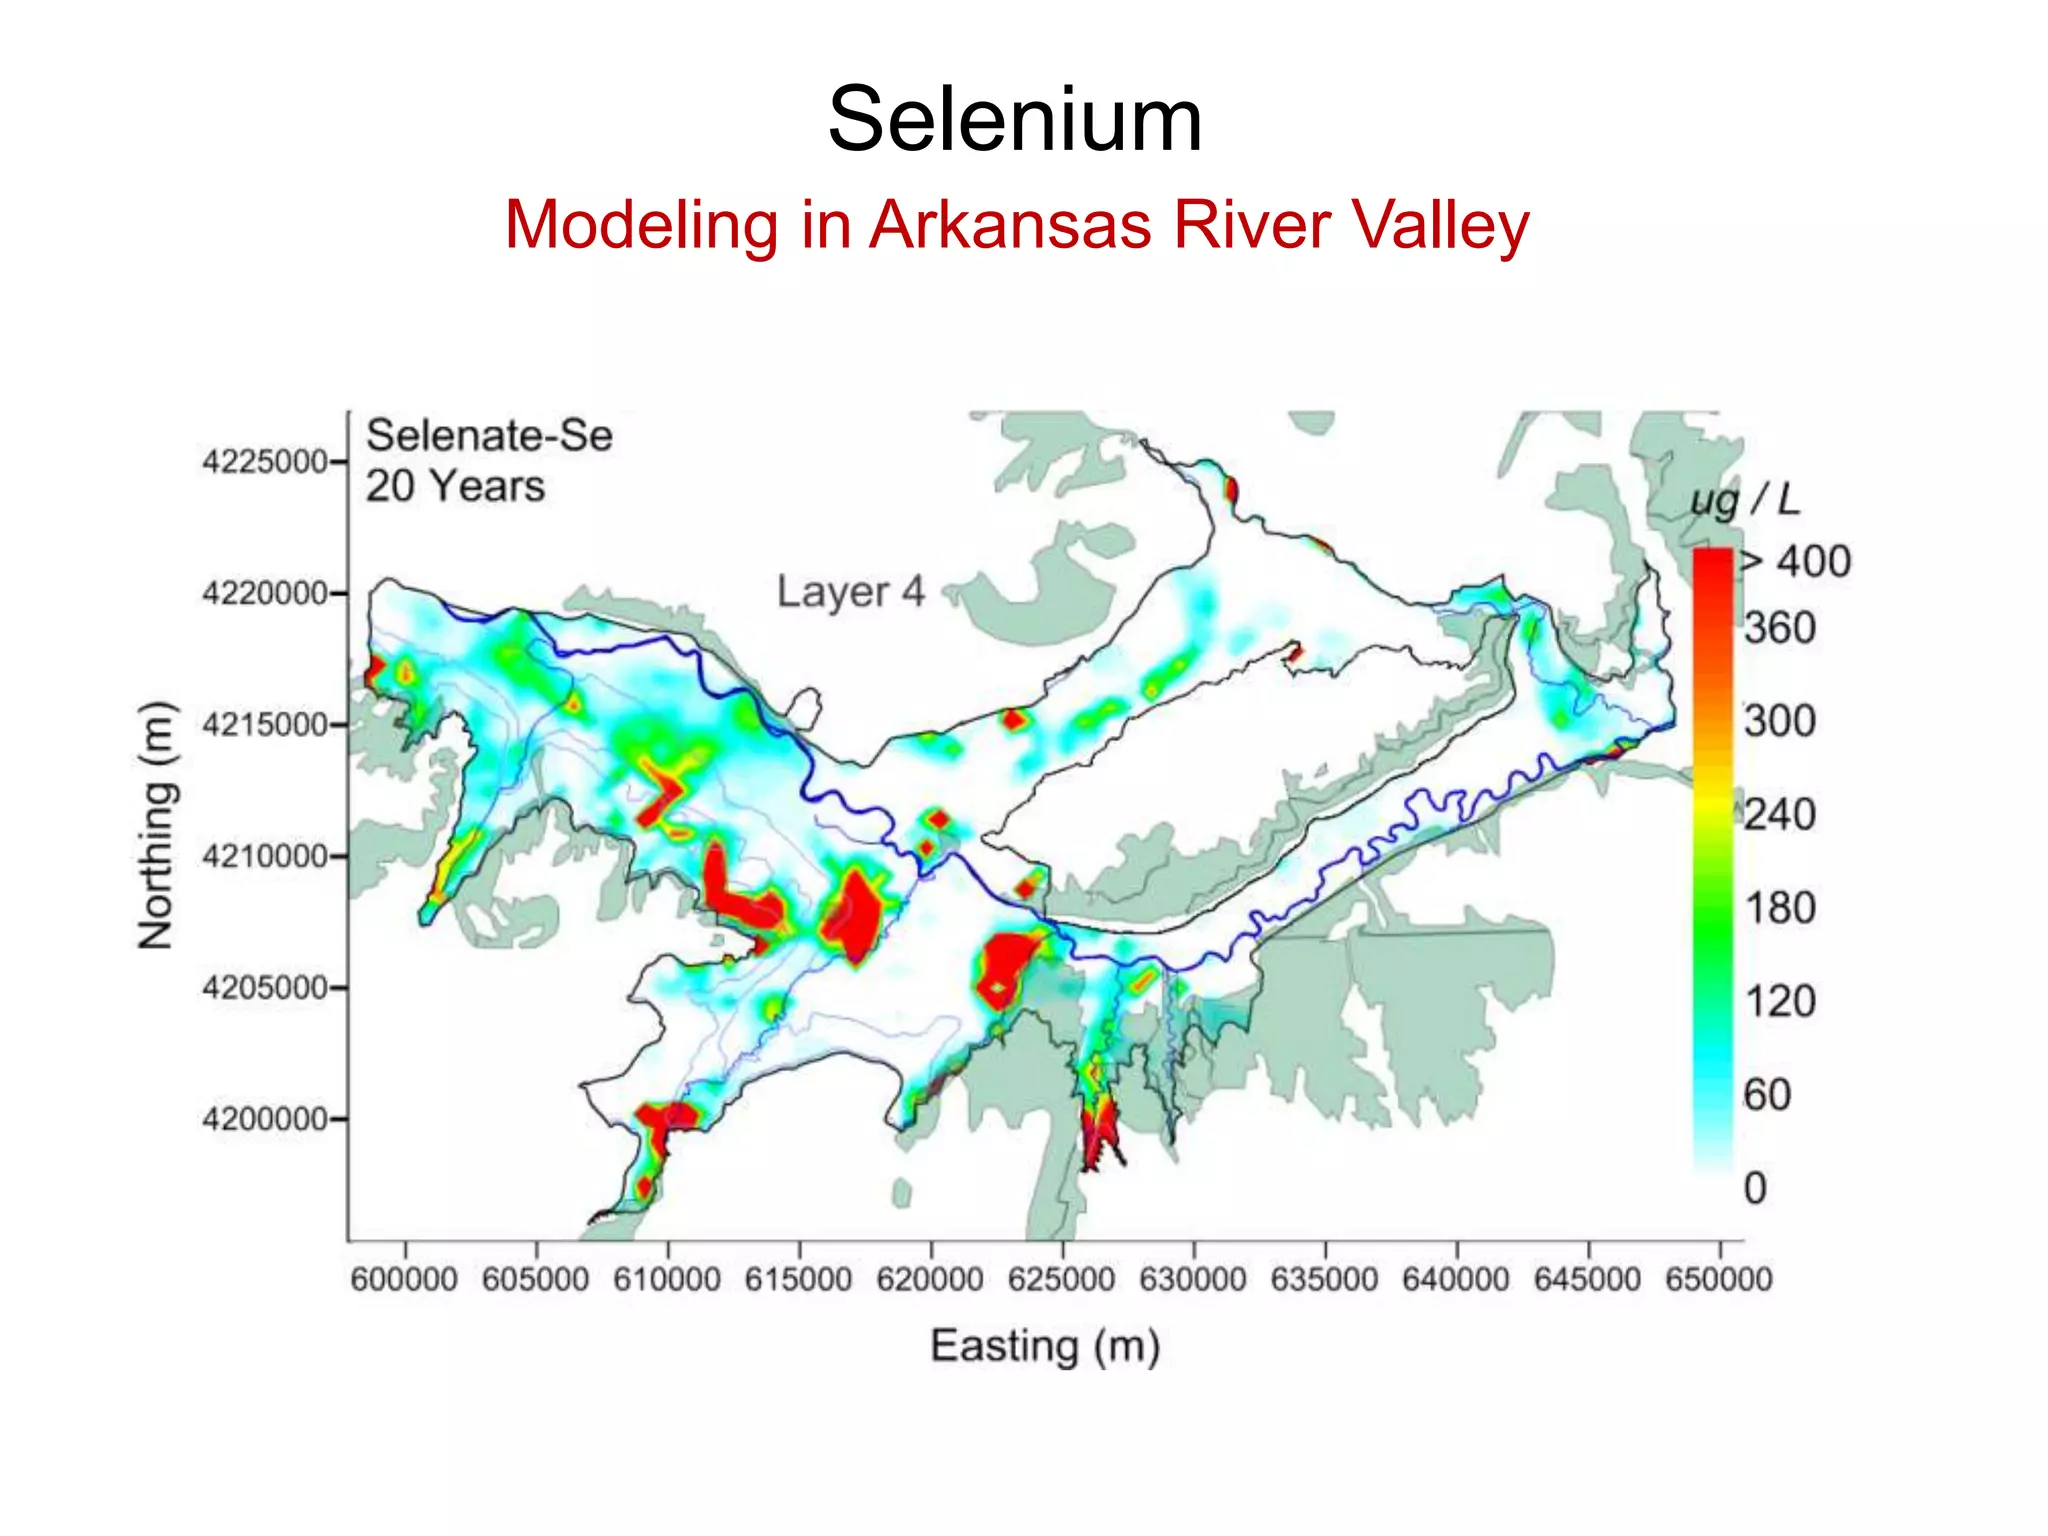
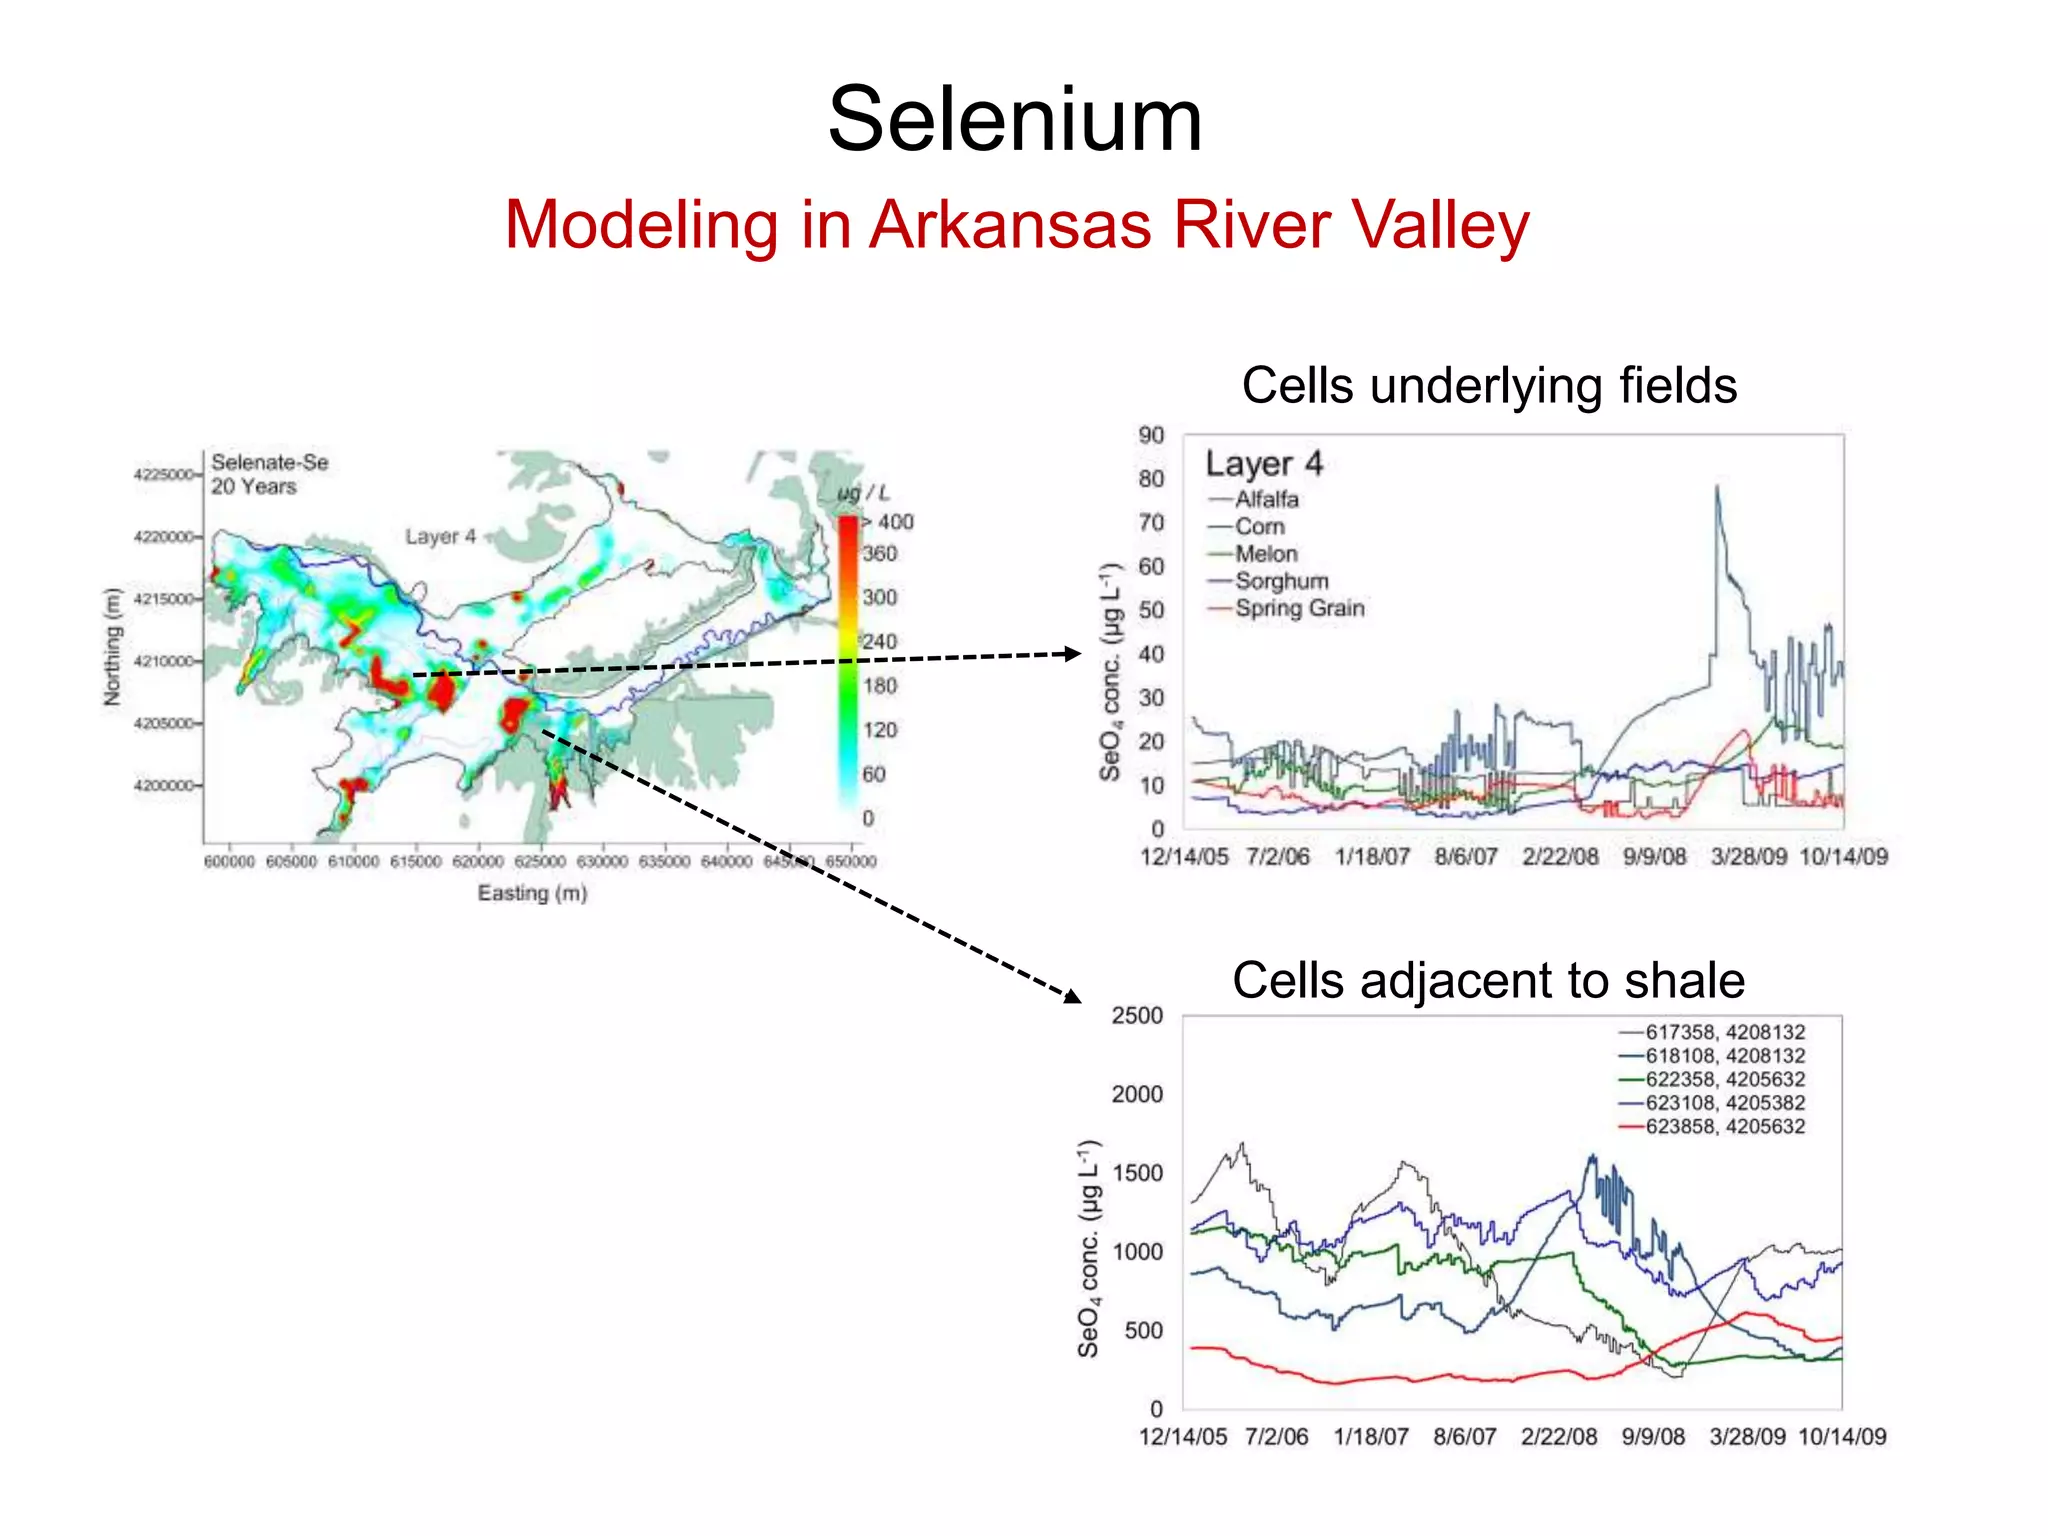
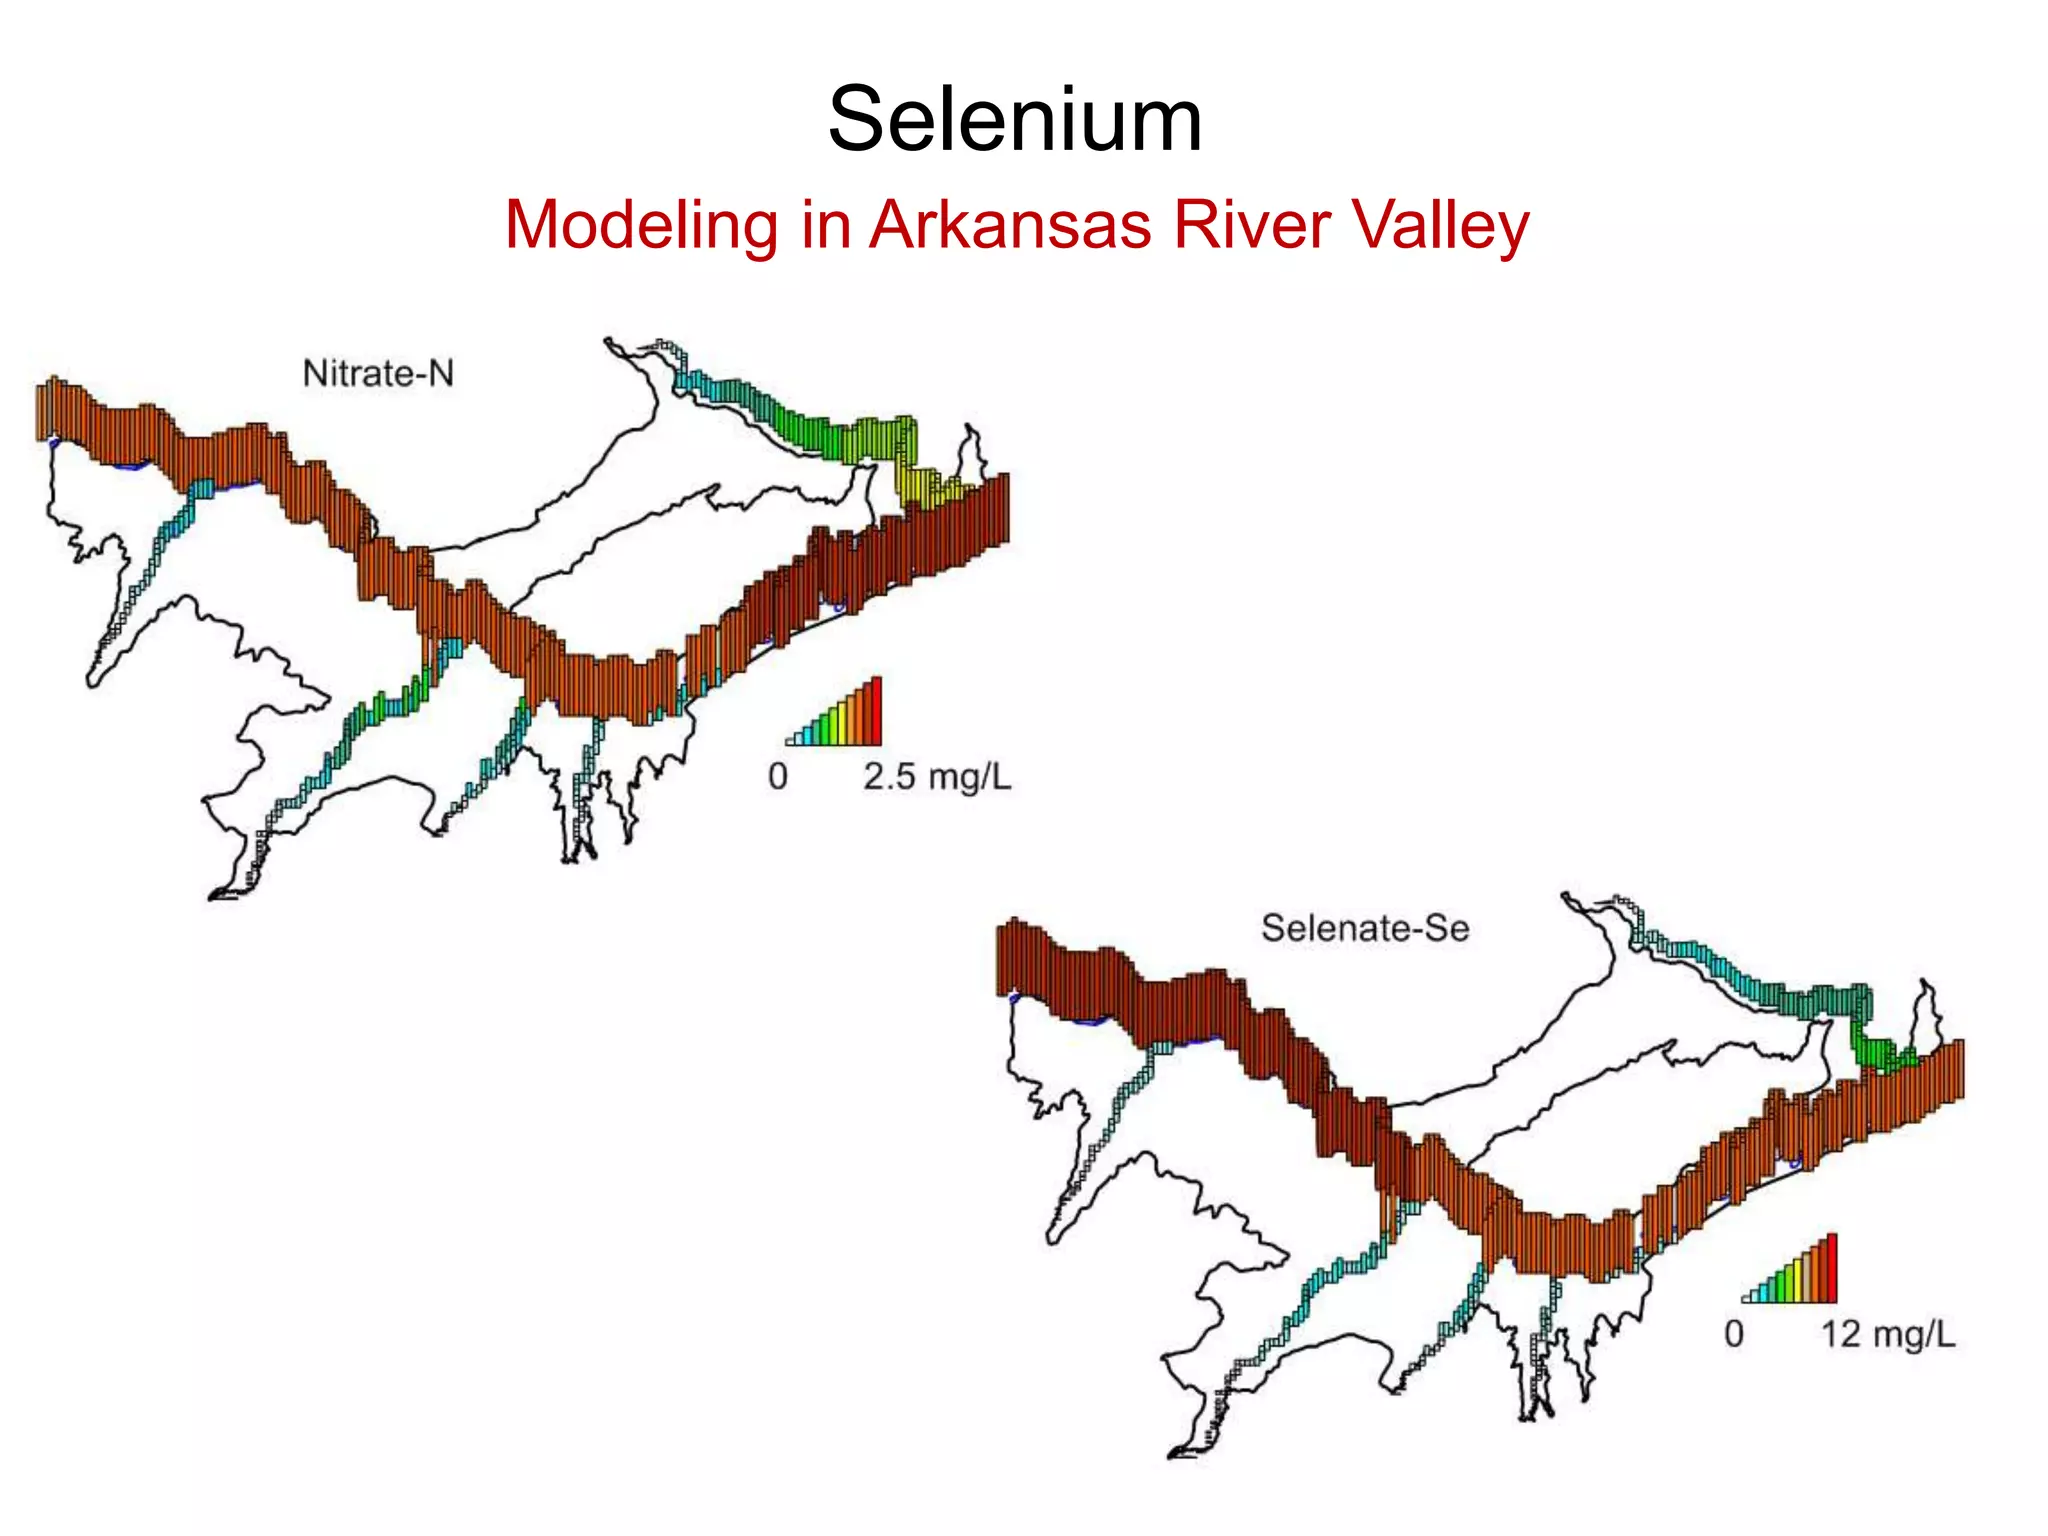
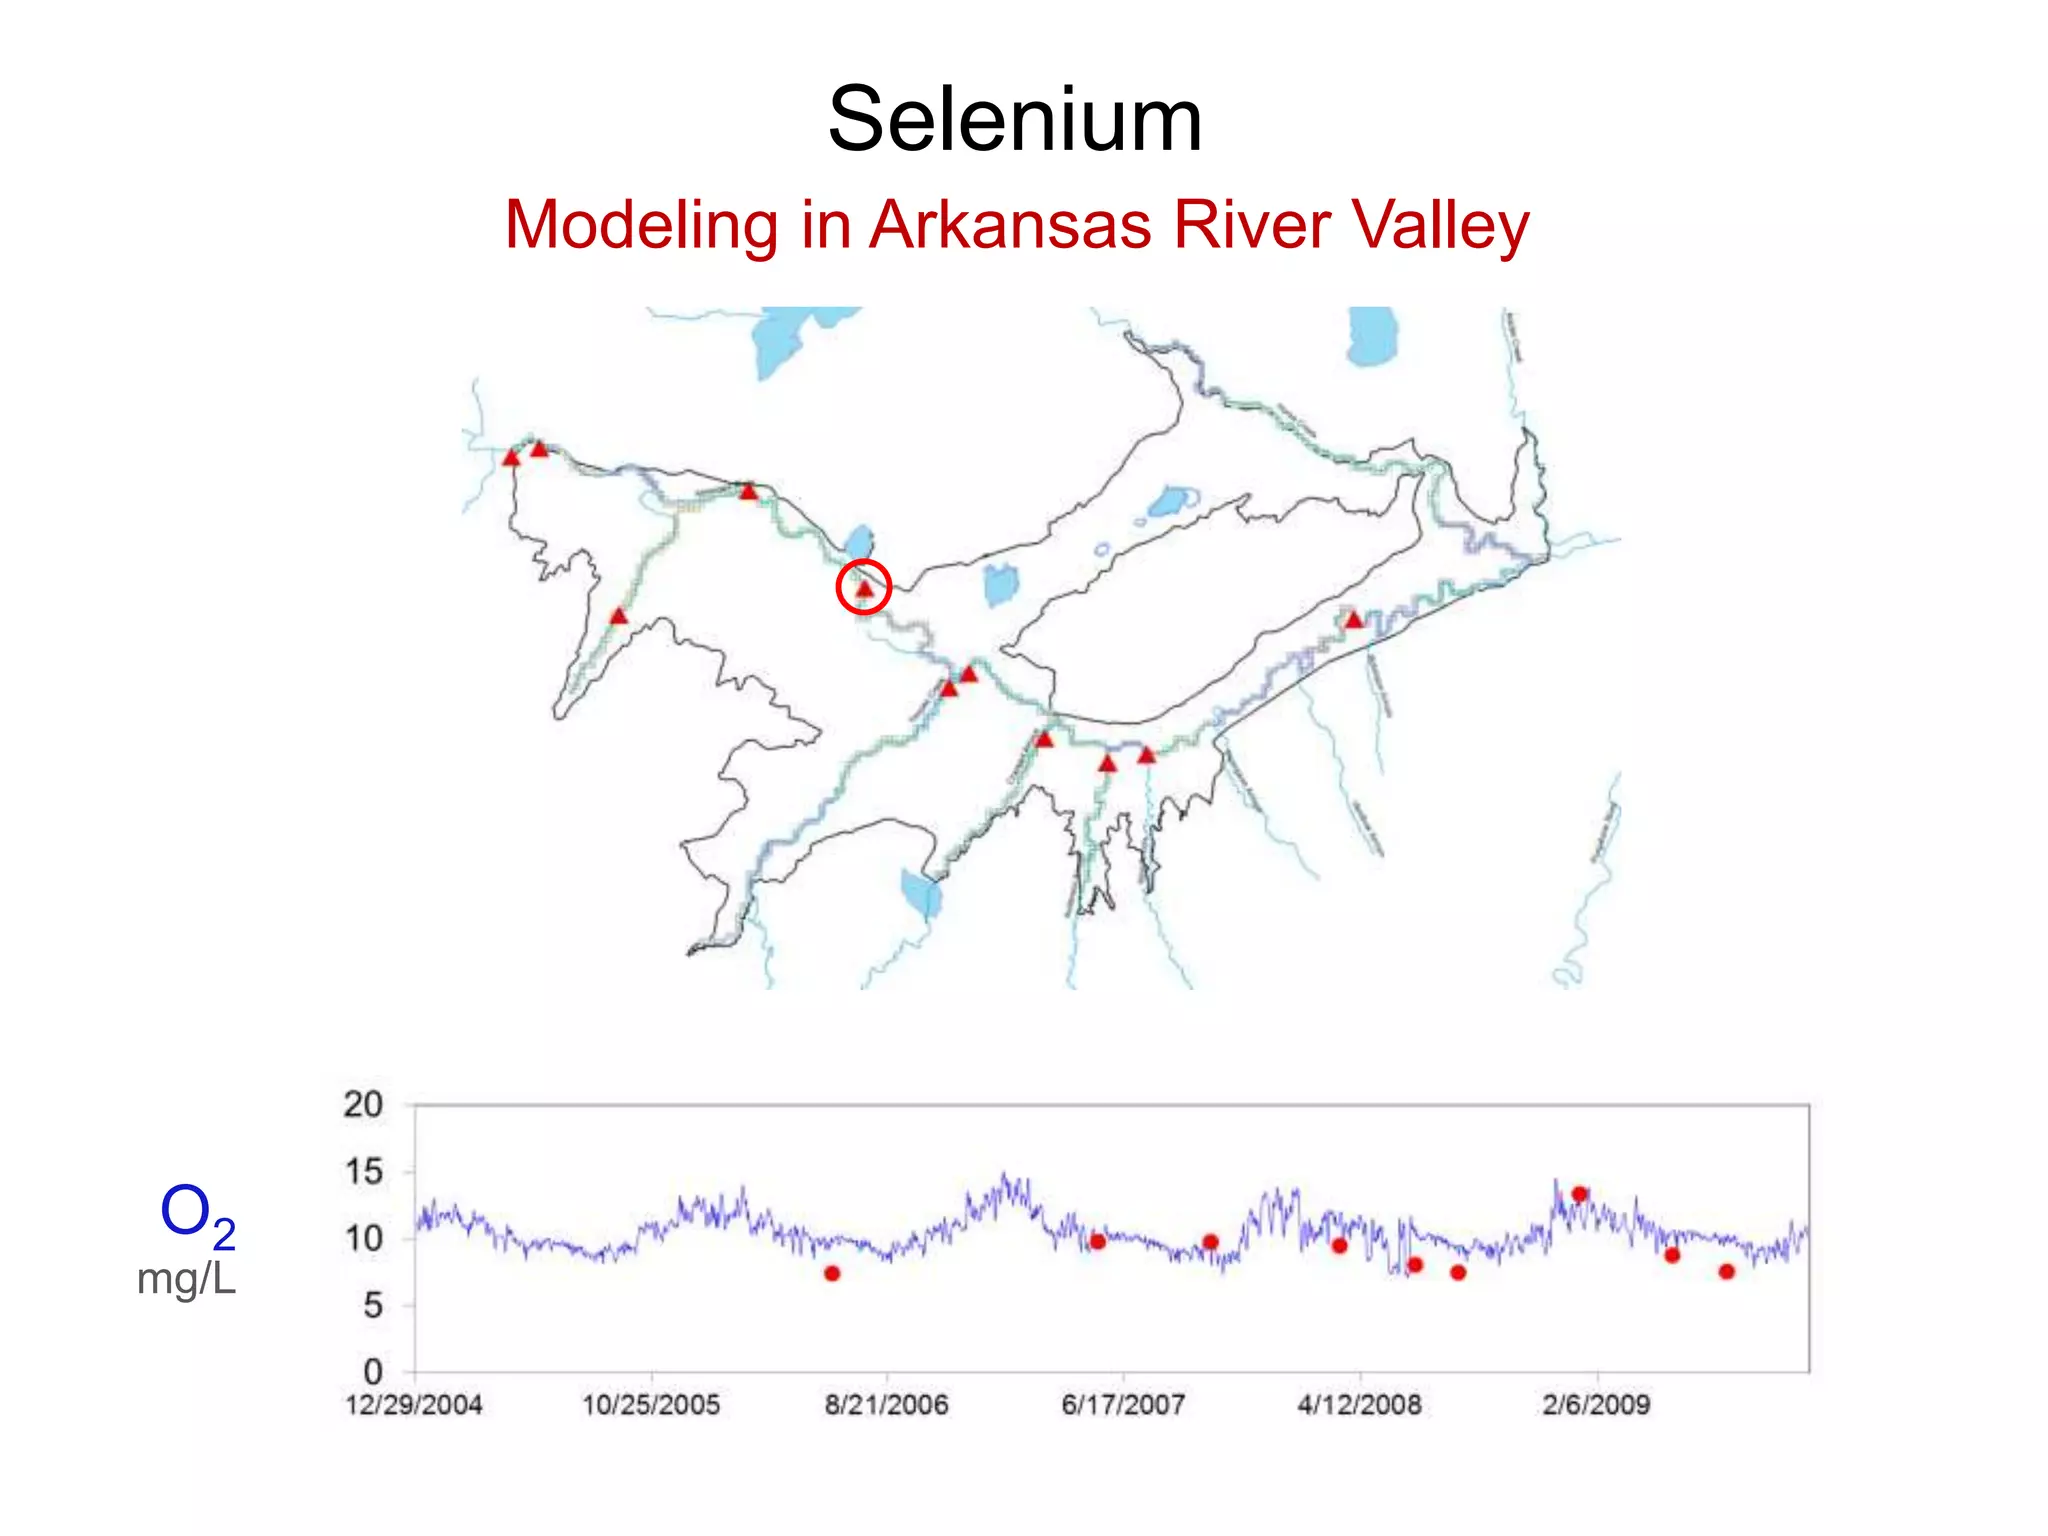
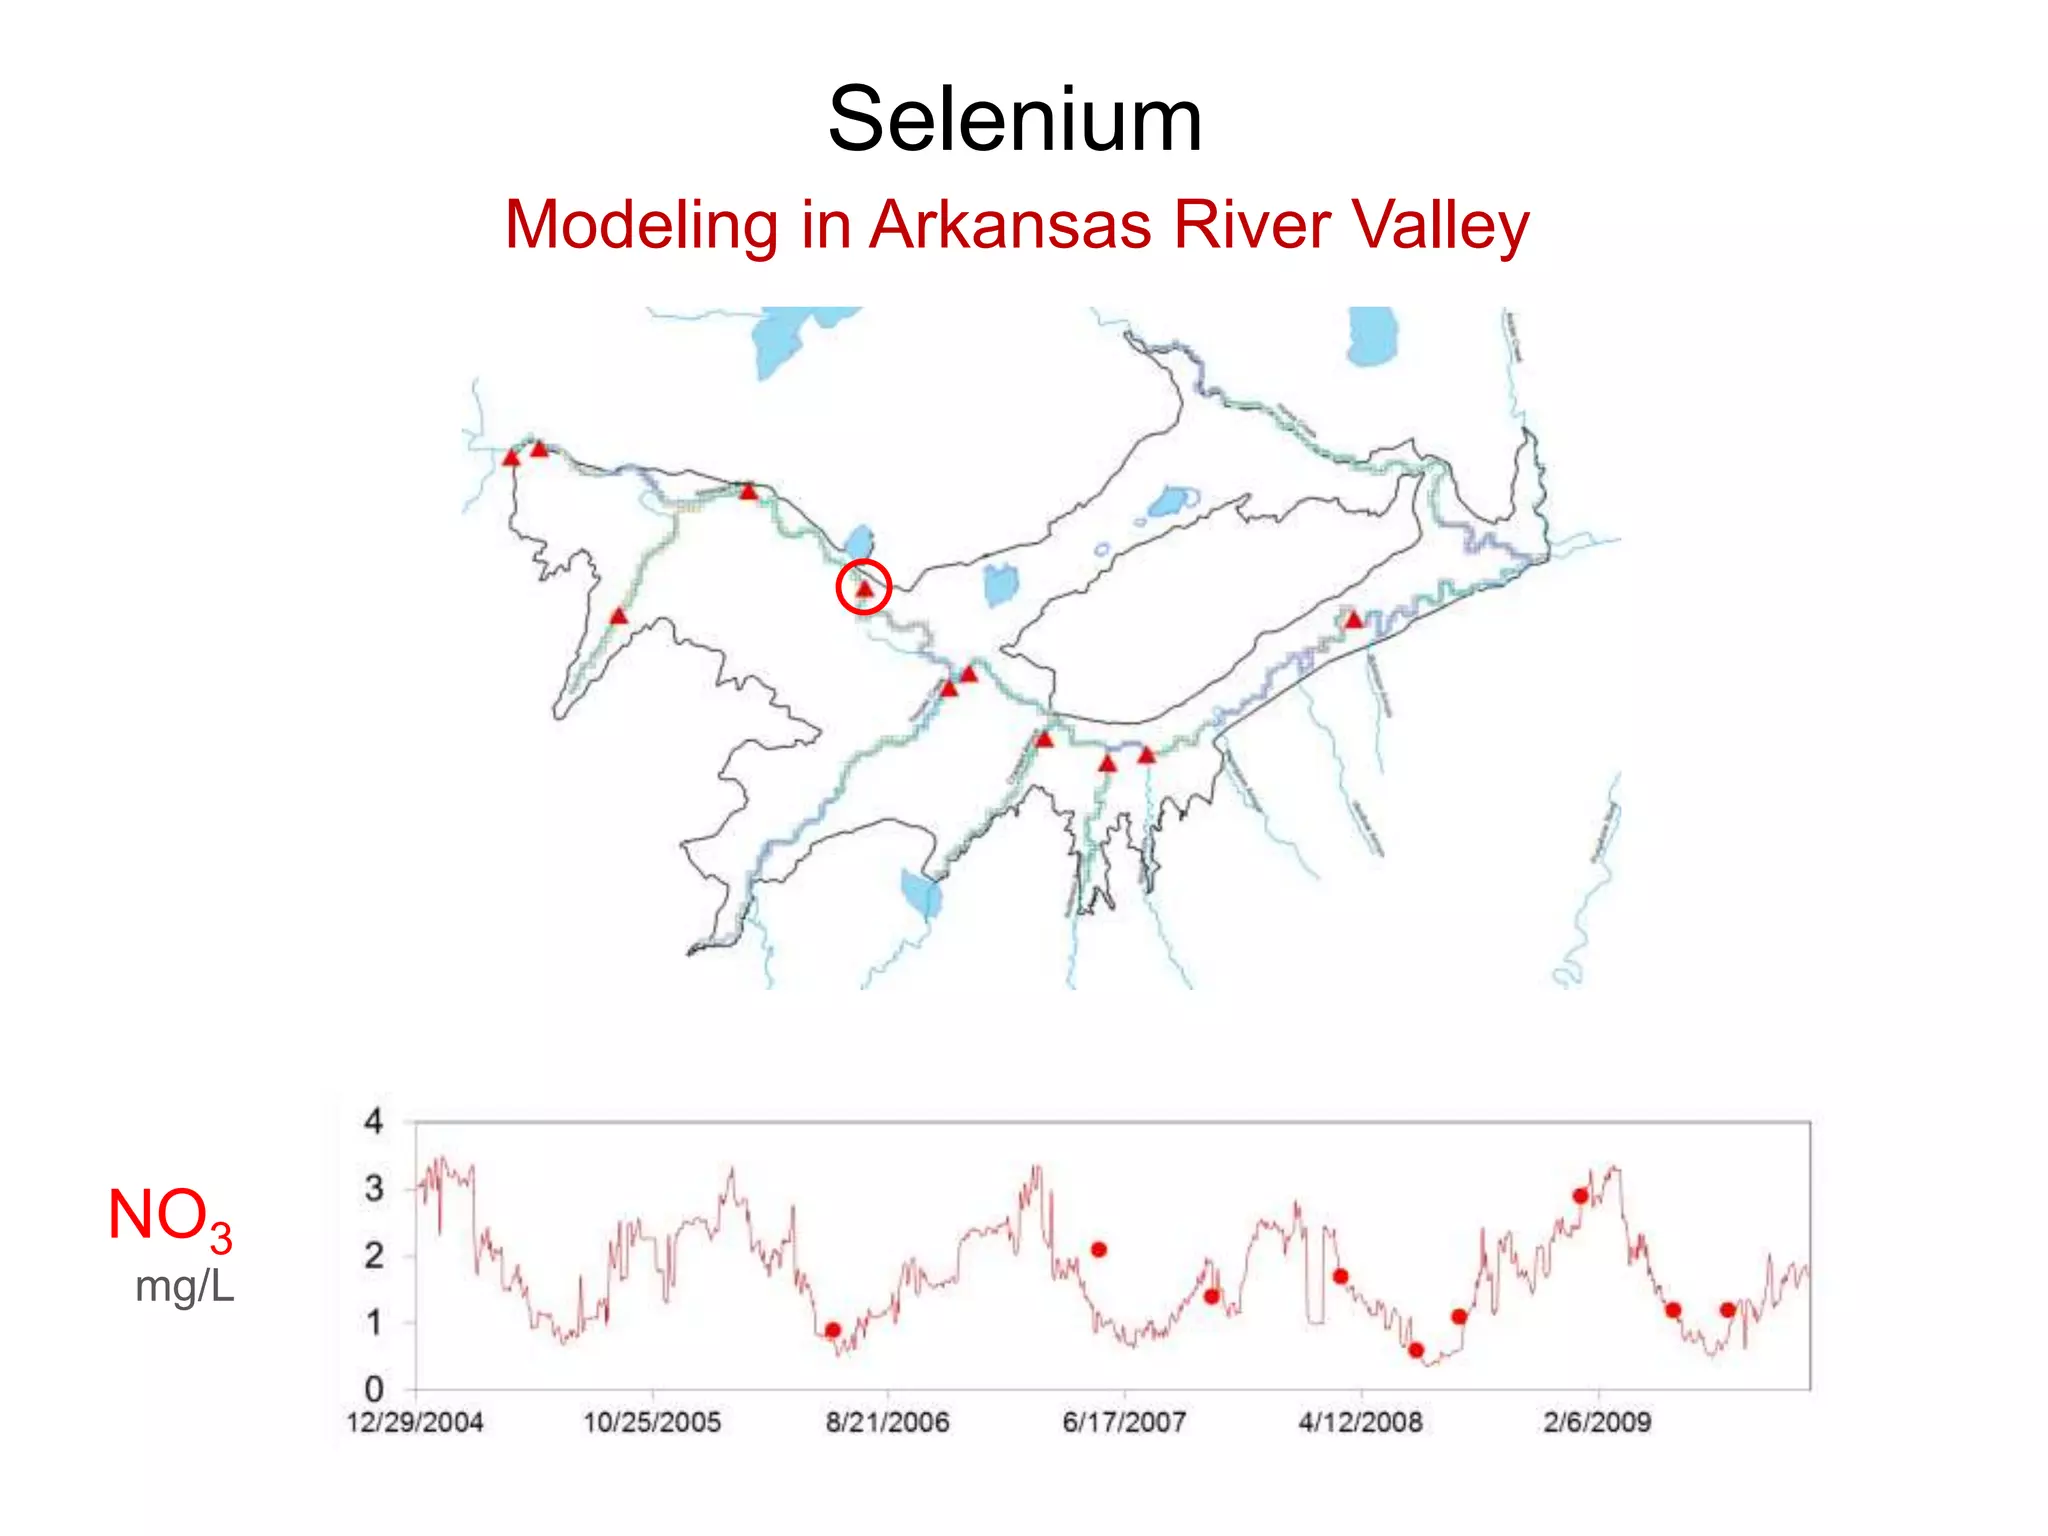
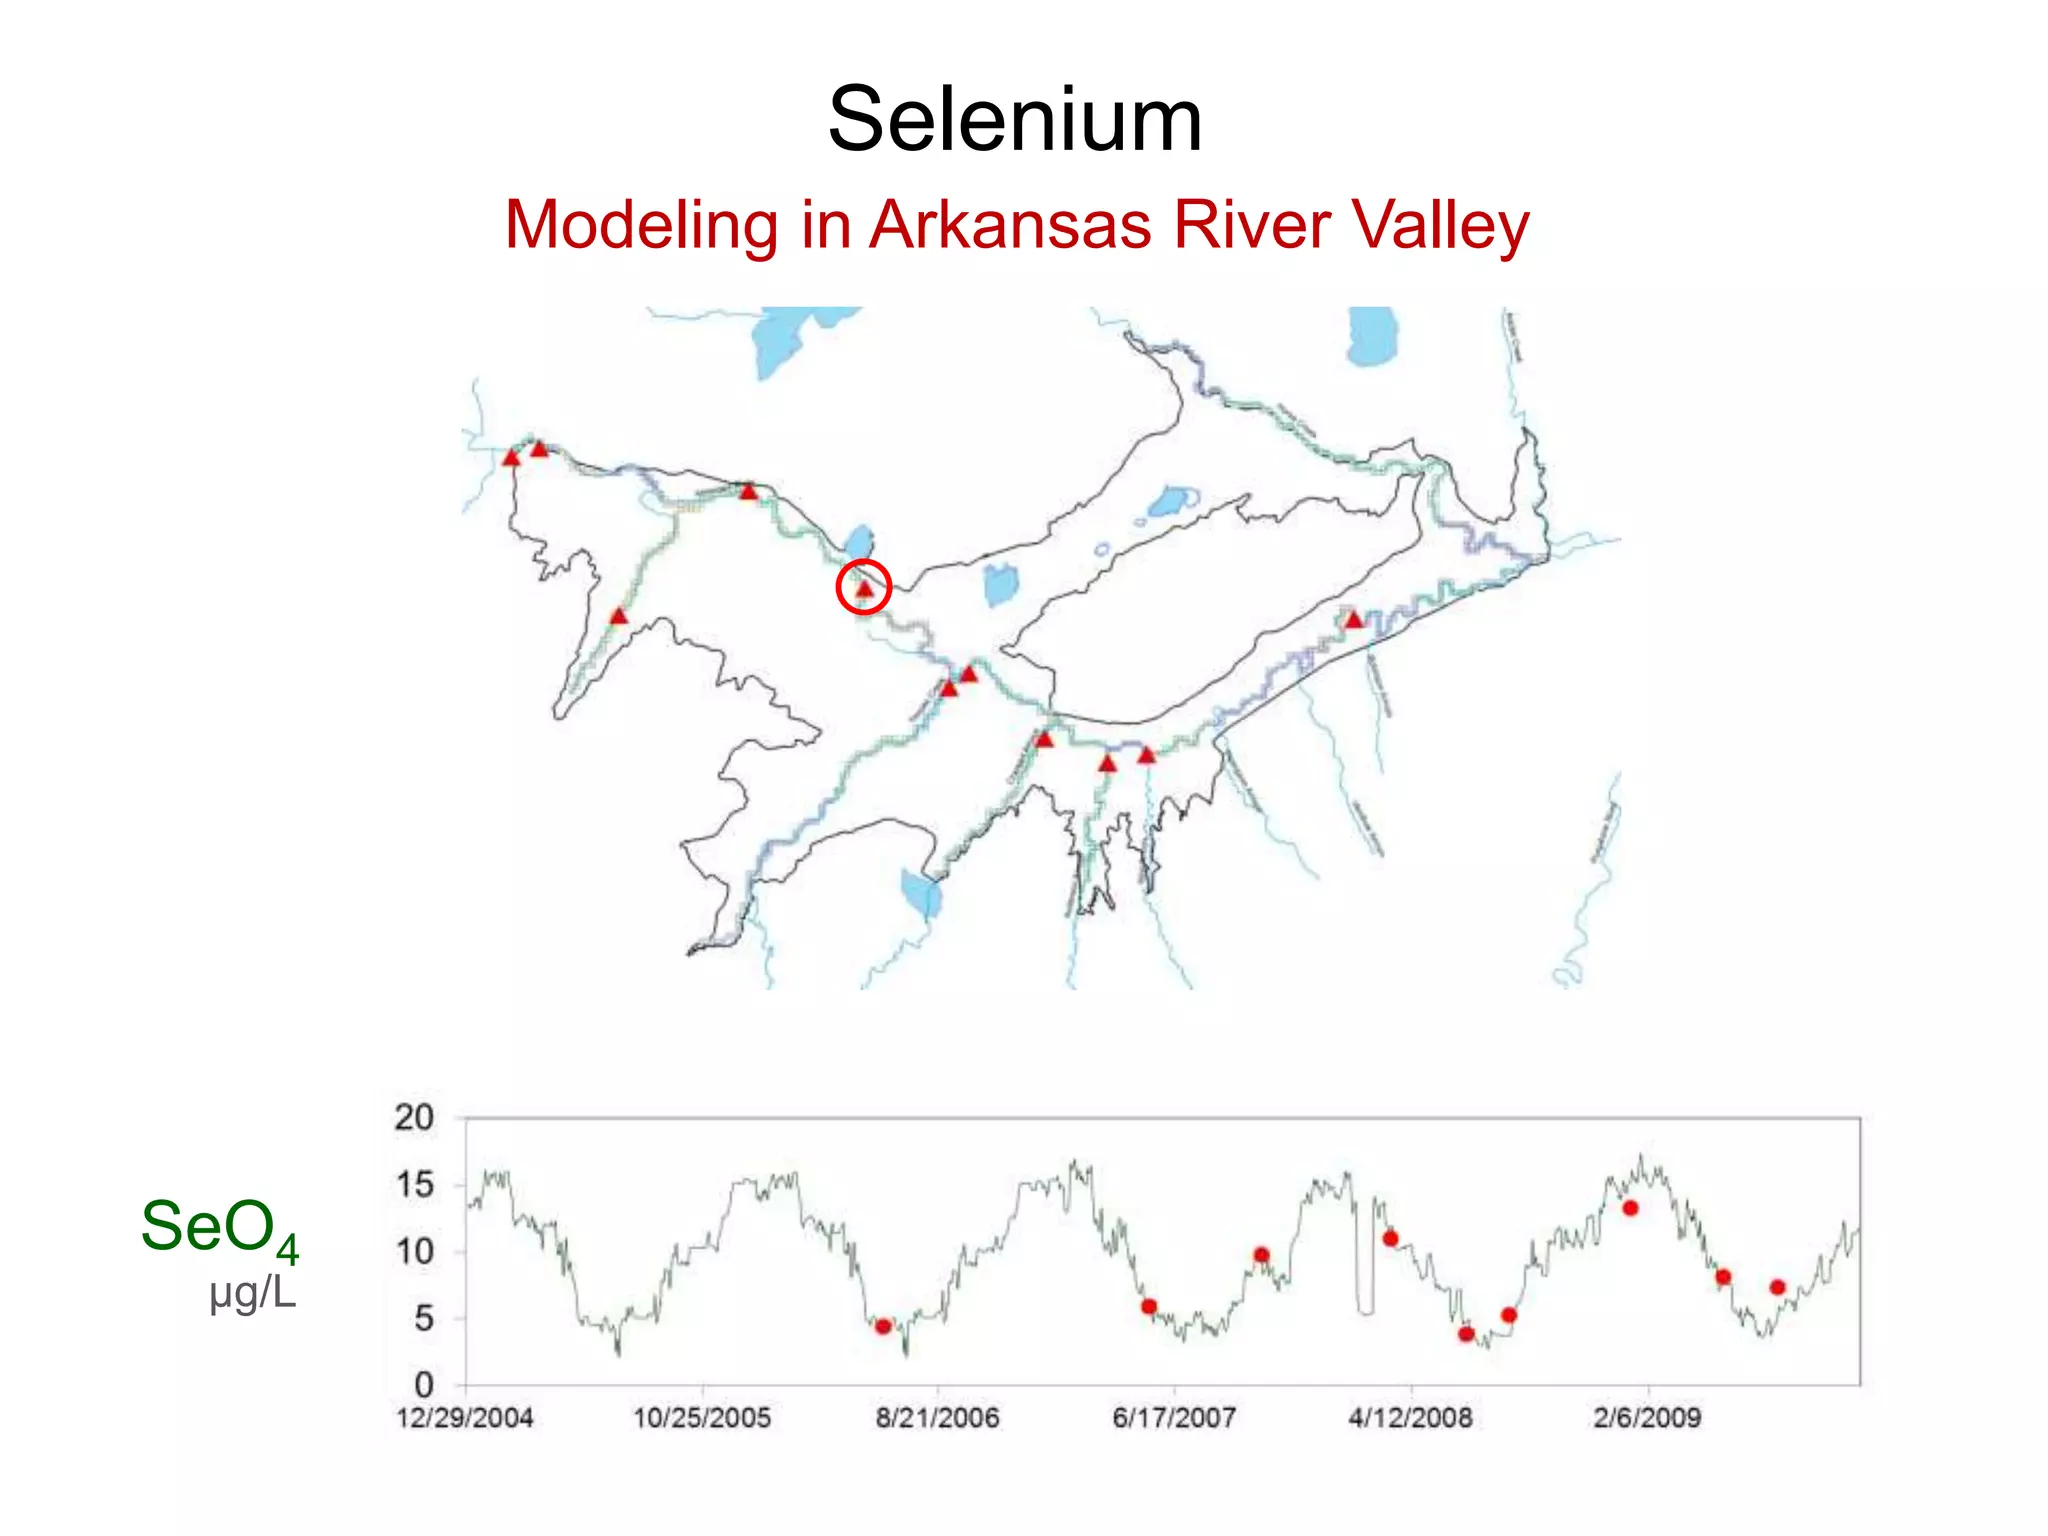
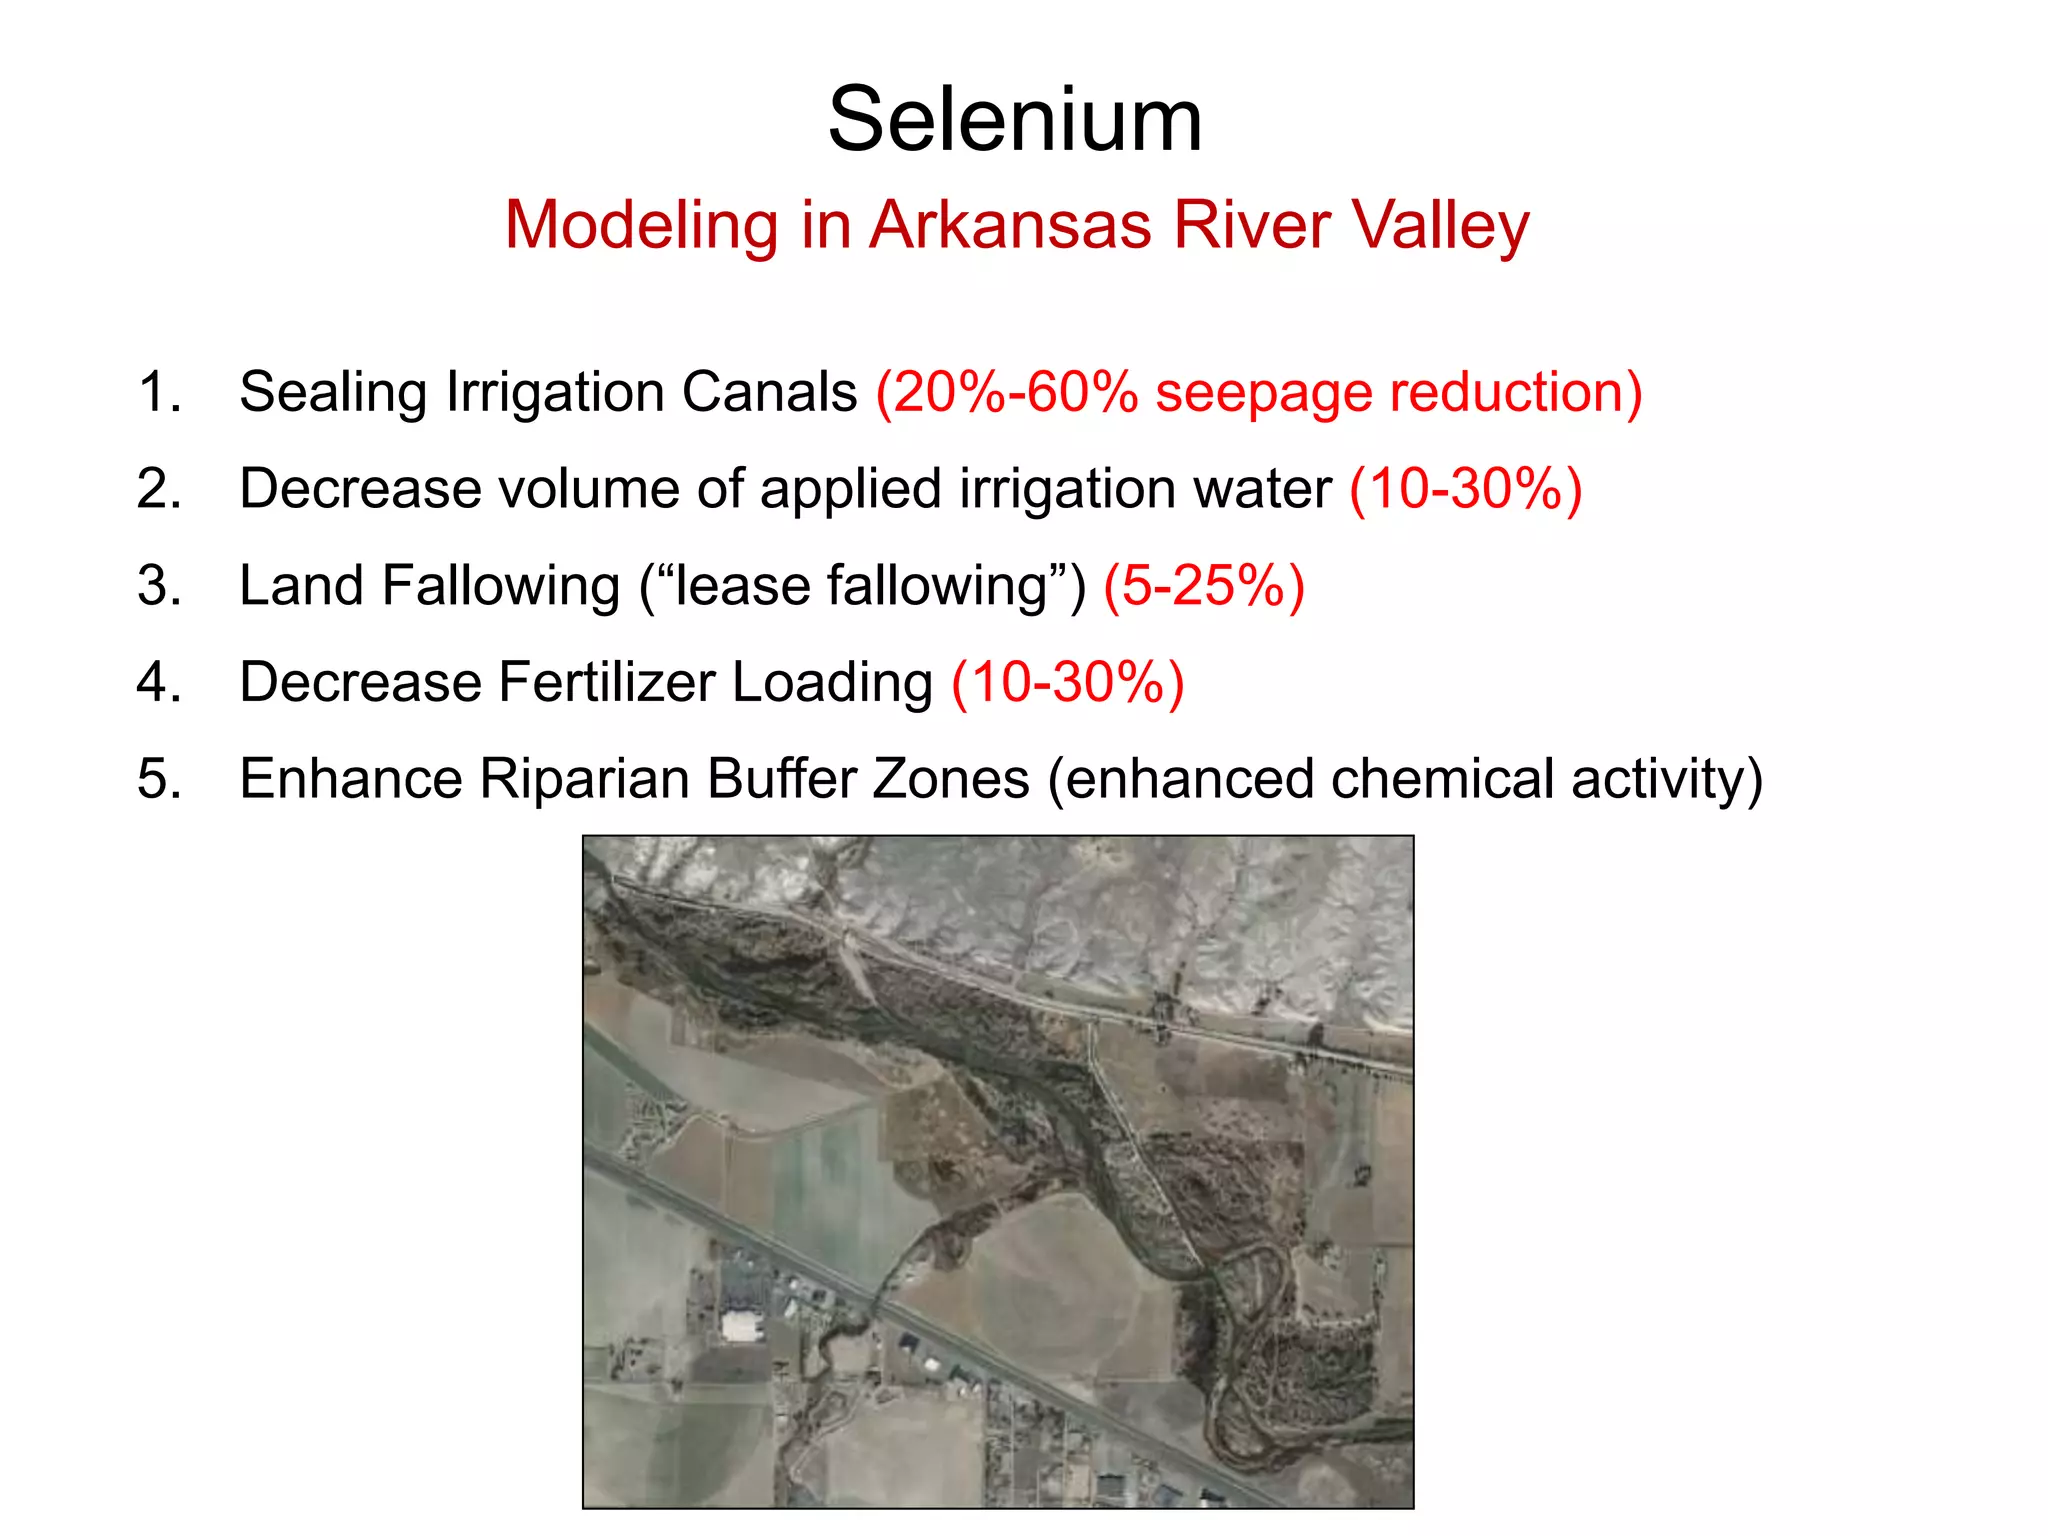
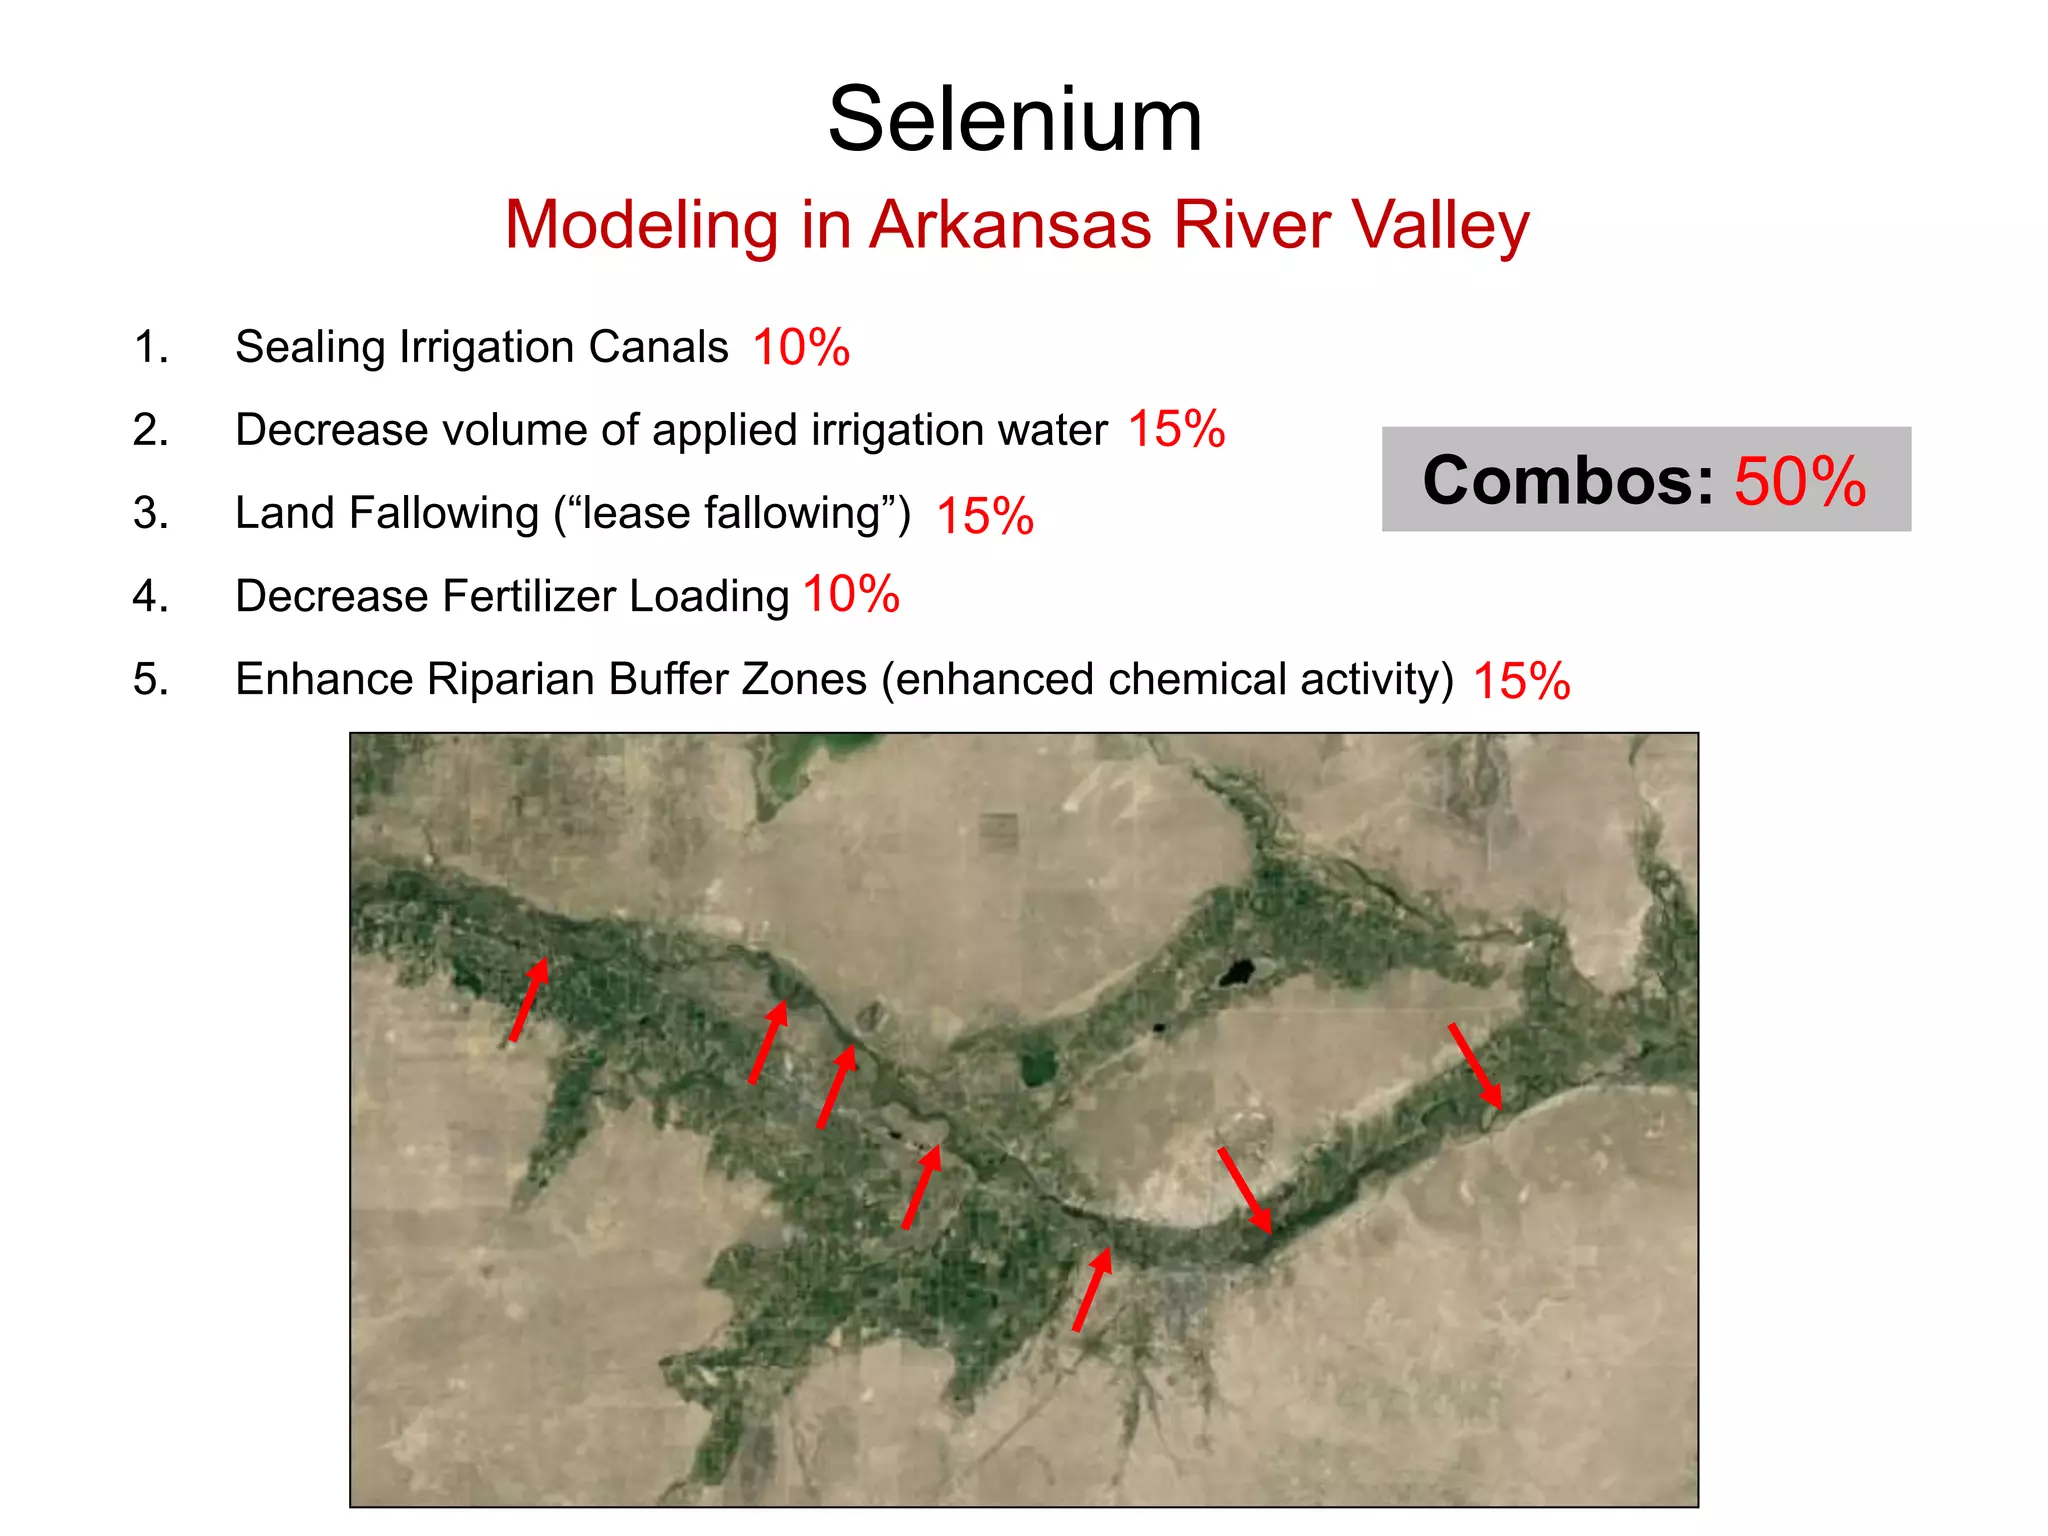
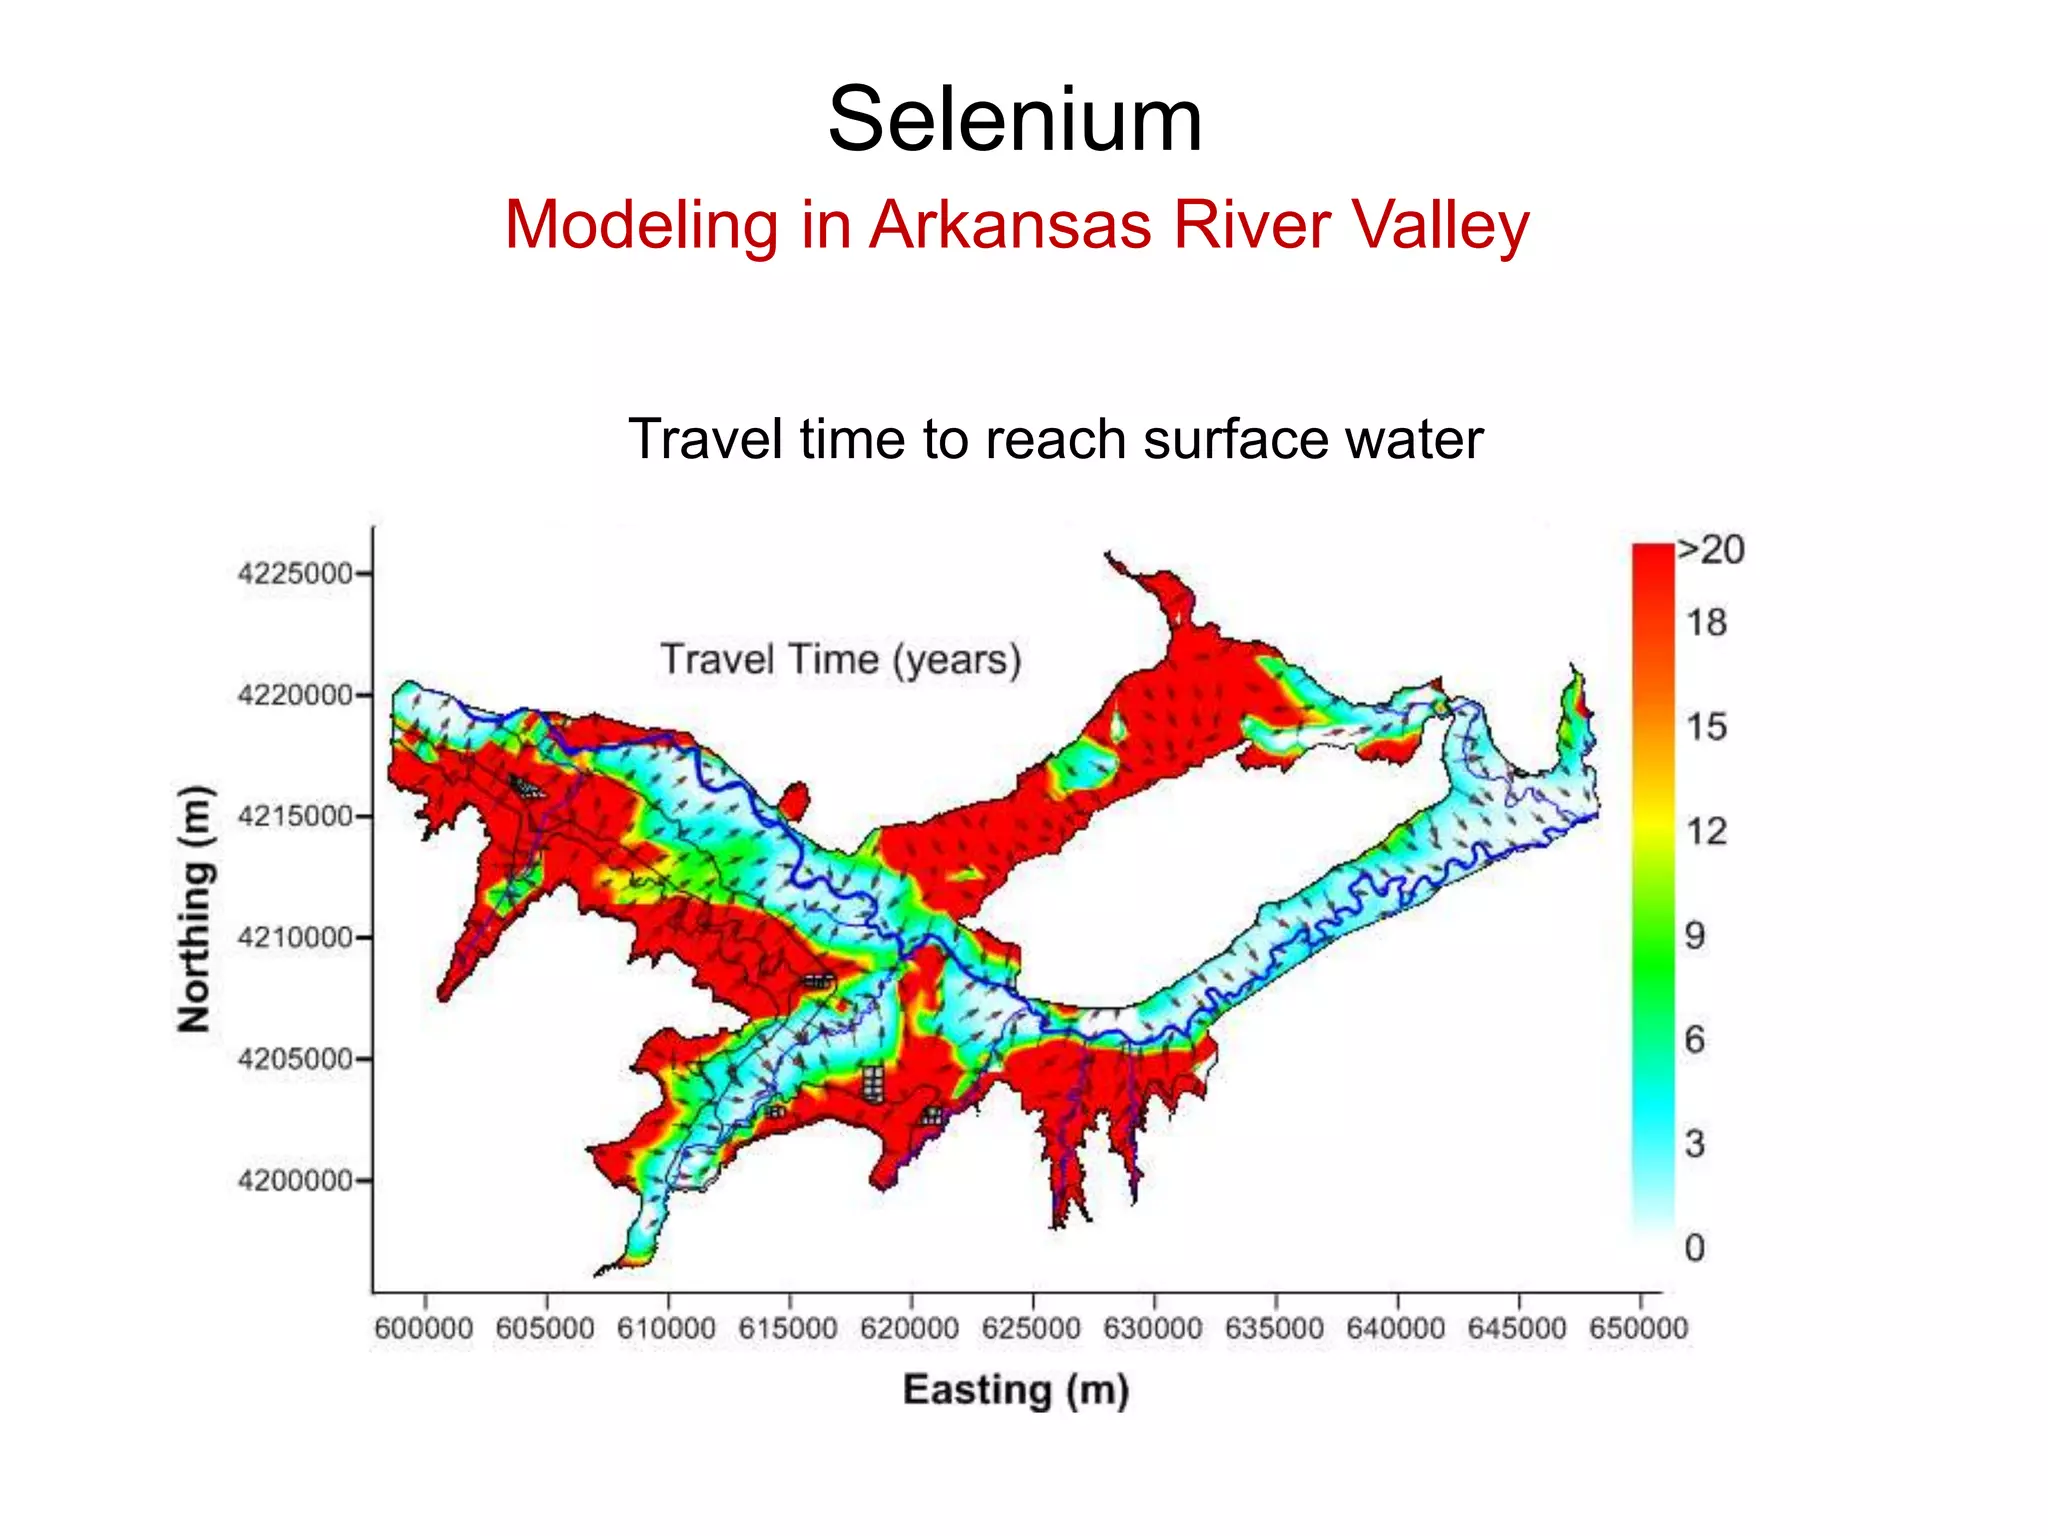
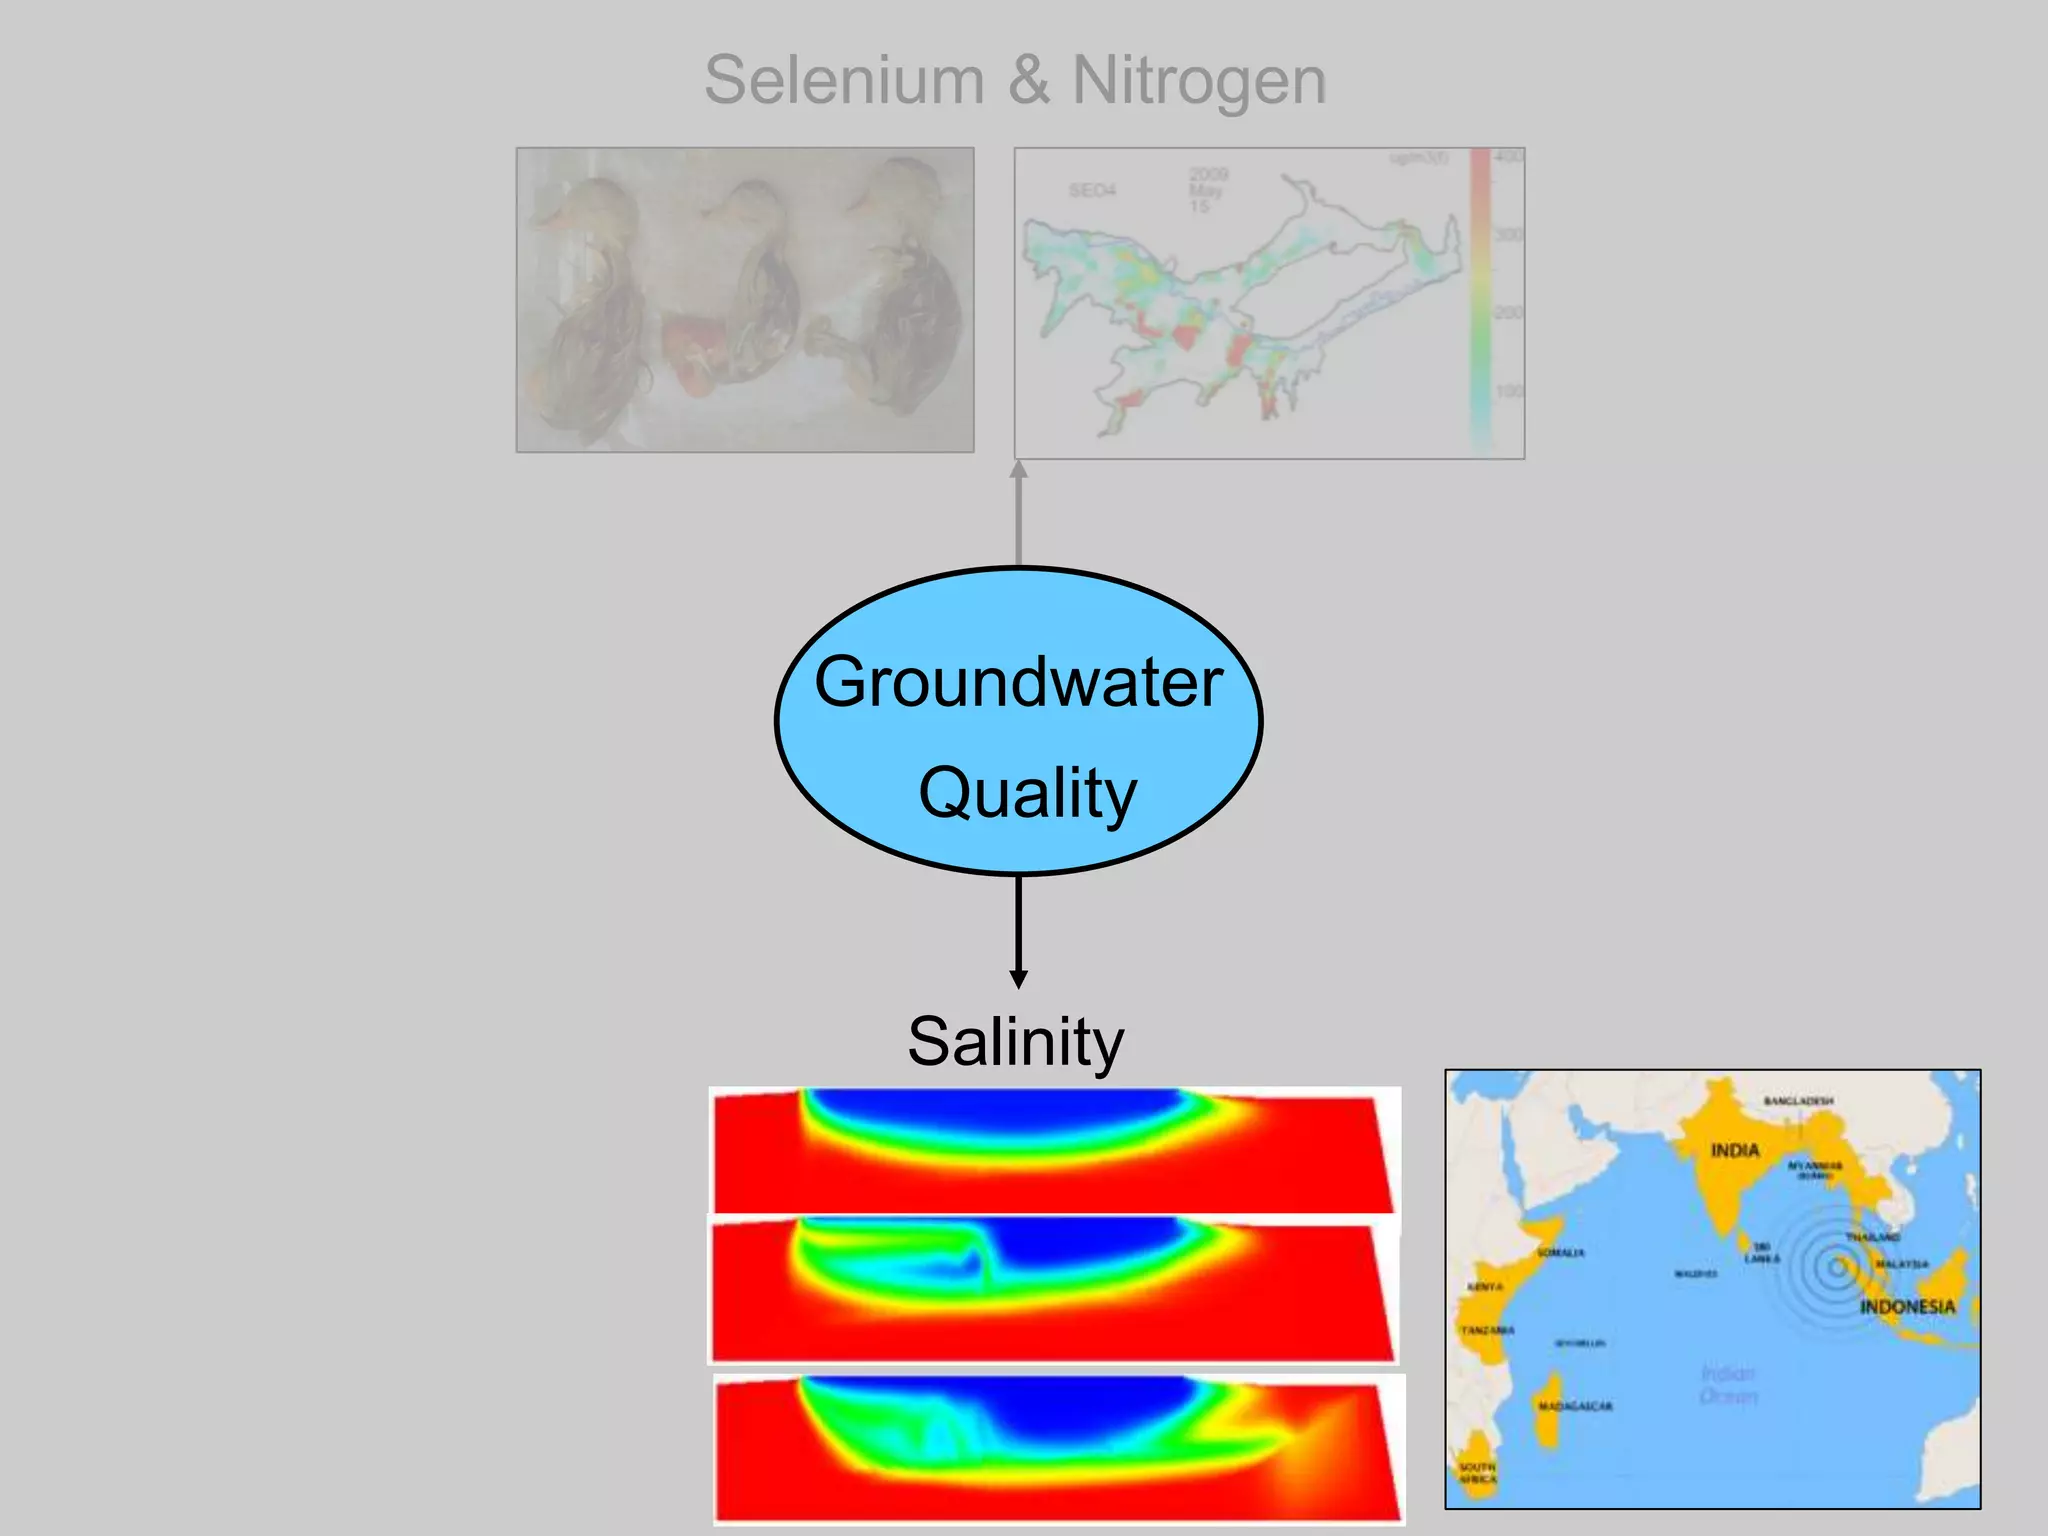
Water Quality Modeling for Groundwater,
Surface Water, and Watersheds:
Basic Theory and Applications
Ryan Bailey
Dept. of Civil and Environmental Engineering
Colorado State University
rtbailey@engr.colostate.edu
1
Personal Background
2003-2006
Groundwater
Modeling
System
2006-2008
Assessment of Groundwater Quantity on
Atoll Islands in the Federated States of
Micronesia
Personal Background
2008-2012
Selenium & Nitrogen Fate and Transport
in Agricultural Groundwater Systems
Personal Background
Research Projects
• Selenium in Groundwater Systems
• Salinity in Groundwater Systems
• Small Island Water Resources Assessment
• Groundwater in the Ogallala Aquifer Region
• Nutrient transport in subsurface tile drains
• Groundwater-surface water interactions
• Coupled land surface / groundwater modeling
Outline
1. Importance of Water Quality (Case Study)
2. Basics of Water Quality Modeling (Transport)
3. Projects using Water Quality Modeling
6
Basics of Water Quality
Hydrologic Cycle
Groundwater Contamination
Case Studies – Woburn, Massachusetts
Groundwater Contamination
Case Studies – Woburn, Massachusetts
TCE
(tetrachloroethylene)
• Solvent for organic materials (used for
dry cleaning, degreasing automotive
parts, paint strippers)
• First synthesized in 1821 (Michael
Faraday)
• Group 2A carcinogen (likely to cause
cancer)
• Central nervous system depressant
• Dissolves fats from skin (skin irritation)
• Banned from use in new dry-cleaning
machines in 2007
• EPA drinking water: < 5 ppb (µg/L)
C2Cl4
Tanneries, Dry Cleaning, Textile Mills,
Paper Industries, Chemical Companies
http://sphweb.bumc.bu.edu/otlt/MPH-Modules/PH/Woburn/Woburn_print.html
Groundwater Contamination
Case Studies – Woburn, Massachusetts
Incidents of Leukemia
Where did the TCE originate from? Who is at fault?
Groundwater Contamination
Case Studies – Woburn, Massachusetts
Groundwater Contamination
Case Studies – Woburn, Massachusetts
1964-1967
http://sphweb.bumc.bu.edu/otlt/MPH-Modules/PH/Woburn/Woburn_print.html
Dump chemicals (TCE)
Trichloroethylene
Until 1960s
Dry Cleaning
Tannery
Complaints about the water in east Woburn
began after Well G began pumping water
in November of 1964
Complaints forced pumping to stop in
October 1969, but they were reopened
whenever the demand for water increased
during the summer or when there was
drought. Whenever Wells G and H began
pumping, there were complaints about the
"putrid, ill-smelling, and foul water."
Groundwater Contamination
Case Studies – Woburn, Massachusetts
How to pinpoint origin of contamination at Wells?
Water Quality Effects
Chemicals
 Toxin and Carcinogen
 Skin disorders, keratosis, cardiovascular, respiratory
• Mobilized by weathering reactions, biological
activity, volcanic emissions, mining, use of arsenical
pesticides
• Groundwater: increased contact between water and
rocks (high vulnerability)
• Large scale contamination in Bangladesh
Water Quality Effects
Impacts from long-term consumption:
< 0.5 mg/L Tooth Decay
0.5 – 1.5 mg/L Dental Health
1.5 – 4 mg/L Dental Fluorosis
> 4 mg/L Dental and Skeletal
Fluorosis
> 10 mg/L Crippling Skeletal Fluorosis
Dental Fluorosis
Chemicals
Water Quality Effects
Impacts from long-term consumption:
< 0.5 mg/L Tooth Decay
0.5 – 1.5 mg/L Dental Health
1.5 – 4 mg/L Dental Fluorosis
> 4 mg/L Dental and Skeletal
Fluorosis
> 10 mg/L Crippling Skeletal Fluorosis
Chemicals
Water Contamination
Sources of Contaminants
• Septic tanks and cesspools
• Land application (agriculture)
• Landfills
• Open dumps
• Residential disposal
• Mine wastes / Mine drainage
• Radioactive-waste disposal sites
• Pipelines
• Pesticide
• Manure
• Urban Runoff
• Atmospheric pollutants
• Saltwater Intrusion
Water Quality Transport
Groundwater Contamination
Major Contamination Sites
Outline
1. Importance of Water Quality (Case Study)
2. Basics of Water Quality Modeling (Transport)
3. Project using Water Quality Modeling
22
Water Quality Effects
Modeling Transport in Rivers and Aquifers
O’Connor et al. (2010)
Water Quality Effects
Modeling Transport in Rivers and Aquifers
O’Connor et al. (2010)
1. Advection
2. Dispersion
3. Chemical Reactions
Water Quality Effects
Modeling Transport in Rivers and Aquifers
O’Connor et al. (2010)
1. Advection
2. Dispersion
3. Chemical Reactions
Water Quality Effects
Modeling Transport in Rivers and Aquifers
O’Connor et al. (2010)
1. Advection
2. Dispersion
3. Chemical Reactions
Water Quality Effects
Modeling Transport in Rivers and Aquifers
O’Connor et al. (2010)
1. Advection
2. Dispersion
3. Chemical Reactions
Sorption
Redox reactions
Water Quality Effects
Modeling Transport in Rivers and Aquifers
O’Connor et al. (2010)
1. Advection
2. Dispersion
3. Chemical Reactions
1. Conservation of Mass
2. Partial Differential Equation
3. Numerical Methods (model)
Water Quality Effects
Modeling Transport in Rivers and Aquifers
Water Quality Effects
Modeling Transport in Rivers and Aquifers
Groundwater Flow
Water Quality Effects
Modeling Transport in Rivers and Aquifers
Groundwater Flow
Water Quality Effects
Modeling Transport in Rivers and Aquifers
Contaminant Transport
Water Quality Effects
Modeling Transport in Rivers and Aquifers
Water Quality Effects
Modeling Transport in Rivers and Aquifers
Water Quality Effects
Models for Groundwater/River Transport
RT3D
(Reactive Transport in
3 Dimensions)
Water Quality Effects
Models for Groundwater/River Transport
SEAWAT
Islands
Coasts
Water Quality Effects
Models for Groundwater/River Transport
OTIS-QUAL2E
(One Dimensional Transport
Inflow and Storage)
Nitrogen cycling
in stream
Outline
1. Importance of Water Quality (Case Study)
2. Basics of Water Quality Modeling (Transport)
3. Project using Water Quality Modeling
38
Water Quality Effects
Salinity
Salinity
Groundwater
Quality
Selenium & Nitrogen
Salinity
Groundwater
Quality
Selenium & Nitrogen
Selenium
Contamination
Selenium (Se): the “double-edged sword” element
 < 40 µg/day: Muscular dystrophy; Liver, muscle, heart disease, Cardiovascular cancer
 > 400 µg/day: Nervous system, growth retardation, deformities
 Particularly harmful to aquatic life (waterfowl and fish)
Selenium
Contamination
1980s: Kesterson Reservoir
- High Se drainage water
- Deformation of water fowl
(bioaccumulation)
Kesterson Reservoir, CA
1990s and 2000s
- Reports from sites worldwide
- Se contamination in groundwater
and surface water.
- Deformation of water fowl, fish
- Also: deficiency (Finland, China)
Selenium
Contamination
1980s and 1990s: National Irrigation Water Quality Program
Shale Bedrock + Irrigation = Se Problem
Arkansas River Valley, CO
(high flow + O2,NO3)
Selenium
Contamination
Bureau of Reclamation (Gunnison Basin, CO)
www.usbr.gov/uc/wcau/progact/smp/overview.html
NO3,O2
FeSe2
Se
Selenium
Modeling in Arkansas River Valley
Selenium
Modeling in Arkansas River Valley
Selenium
Modeling in Arkansas River Valley
Fort Lyon
Holbrook
Highline
Catlin
RF Ditch
Otero
6 Irrigation Canals
Highline
Otero
Catlin
Rocky Ford Ditch
Holbrook
Fort Lyon
Pumping Wells Depth to Bedrock (~15 m)Surface Shale
Selenium
Modeling in Arkansas River Valley
Fertilizer Loading (N)
NO3 leaching, interaction with shale
Release of Selenium into groundwater
Pueblo
Reservoir
John Martin
Reservoir
Upstream Study Region
Downstream Study Region
Se (µg/L) Se (µg/L)
50 (EPA Ag. Std)
Pueblo
Reservoir
John Martin
Reservoir
Upstream Study Region
Downstream Study Region
Se (µg/L) Se (µg/L)
4.6 4.6
Pueblo
Reservoir
Upstream Study Region
Construct Groundwater Flow Model
Construct Contaminant Transport Model RT3D (Aquifer, River)
Identify strategies to mitigate Se contamination
Infiltration (irrigation, rainfall)
Evapotranspiration (crops)
Canal seepage
River-aquifer interaction
Pumping
Aquifer Parameters
MODFLOW
Hydraulic
Head
Selenium
Modeling in Arkansas River Valley
Selenium
Modeling in Arkansas River Valley
• Crop type for each irrigated field
• Distribution of Shale
• Plant, Harvest, Plowing days
• Fertilizer (time and amount) (N)
• Root zone hydrology
• Nitrogen cycling
• Oxidation of Selenium from shale
RT3D
OTIS
Concentration of
NO3 and Se in
Aquifer and River
Selenium
Modeling in Arkansas River Valley
Selenium
Modeling in Arkansas River Valley
Selenium
Modeling in Arkansas River Valley
Cells adjacent to shale
Cells underlying fields
Selenium
Modeling in Arkansas River Valley
Selenium
Modeling in Arkansas River Valley
Selenium
Modeling in Arkansas River Valley
O2
mg/L
Selenium
Modeling in Arkansas River Valley
NO3
mg/L
Selenium
Modeling in Arkansas River Valley
SeO4
µg/L
Selenium
Modeling in Arkansas River Valley
1. Sealing Irrigation Canals (20%-60% seepage reduction)
2. Decrease volume of applied irrigation water (10-30%)
3. Land Fallowing (“lease fallowing”) (5-25%)
4. Decrease Fertilizer Loading (10-30%)
5. Enhance Riparian Buffer Zones (enhanced chemical activity)
Selenium
Modeling in Arkansas River Valley
1. Sealing Irrigation Canals
2. Decrease volume of applied irrigation water
3. Land Fallowing (“lease fallowing”)
4. Decrease Fertilizer Loading
5. Enhance Riparian Buffer Zones (enhanced chemical activity)
10%
15%
15%
10%
15%
50%Combos:
Selenium
Modeling in Arkansas River Valley
Travel time to reach surface water
Selenium & Nitrogen
Salinity
Groundwater
Quality
Overwash from Tsunami Event
• December 26, 2004
• ~ 230,000 deaths
Overwash from Tsunami Event
Sumatra, Indonesia
Sri Lanka
Overwash from Tsunami Event
• December 26, 2004
• ~ 230,000 deaths
• Wave height in Maldives: 1.3 to 3.3 m
Laamu
Atoll
Maldives
1 km2
Overwash from Tsunami Event
Small Coral Islands
Fresh Groundwater
Seawater
Overwash from Tsunami Event
Small Coral Islands
Overwash from Tsunami Event
Fresh Groundwater
Seawater
Overwash from Tsunami Event
Small Coral Islands
1. How much contamination occurs?
2. When can groundwater be used again?
Overwash from Tsunami Event
Small Coral Islands
1. Impose overwash
2. Rainfall on island
3. Track salinity
SEAWAT
Overwash from Tsunami Event
Small Coral Islands
1 day
4 months
15 months
2 years
Groundwater Contamination
Case Studies – Woburn, Massachusetts
Where did the TCE originate from? Who is at fault?
MODFLOW model
+
MT3DMS model
(TCE, PCE)
(1960-1986)
Maura Metheny, 2004
(Ohio State University
Groundwater Contamination
Case Studies – Woburn, Massachusetts
Groundwater Contamination
Case Studies – Woburn, Massachusetts
Groundwater Contamination
Case Studies – Woburn, Massachusetts
Groundwater Contamination
Case Studies – Woburn, Massachusetts
Groundwater Contamination
Case Studies – Woburn, Massachusetts
Groundwater Contamination
Case Studies – Woburn, Massachusetts
http://sphweb.bumc.bu.edu/otlt/MPH-Modules/PH/Woburn/Woburn_print.html
Concluding Remarks
• Water quality a concern in many parts of the worlds
• Water-borne diseases still occur in many regions
• Numerical models can be used to track contaminants in the environment
(groundwater and surface water)
• Models can be used to explore effect of management practices on
contamination and remediation
• Models can be used to determine historical patterns of contaminant
transport
Soho (London, England)
1854
• 500 deaths in 10 days
• Due to Cholera
Soho (London, England)
Questions
1. Why did it affect the Soho neighborhood so strongly?
2. How can you prevent the spread of the disease?
Soho (London, England)
Dr. John Snow
• 1838: Admitted to the Royal College of
Surgeons of England
• One of the first physicians to use anesthesia
(ether, chloroform) for surgey
• 1853: personally administered chloroform to
Queen Victoria during birth
• Skeptic of “miasma” theory (cholera spread
by “bad air”)
• 1854: investigated cholera outbreak in Soho
Soho (London, England)
How to prove?
1. Woman several km from neighborhood died
2. Men in brewery did not die
3. Families with deaths in other neighborhoods always sent
their children to fetch water from the Broad Street pump
Theory
Groundwater at Soho
Vibrio cholerae
Groundwater at Soho
Groundwater at Soho
Sand / Gravel
(“sweet” water)
Broad Street
Pump Diaper / Rags
from sick Infant
Groundwater at Soho
Start of 20th century:
Add chlorine to water
supplies (kill bacteria)
Cholera Outbreaks
7th Cholera Pandemic (1961-1971)
Cholera Outbreaks
Congo (Rwanda crisis)
• 1994
• 23,800 deaths
2001: 41 outbreaks in 28 countries
Latin America
• 1991
• 400,000 cases
• 4,000 deaths
Cholera Outbreaks

Water Quality Modeling for Groundwater, Surface Water, and Watersheds: Basic Theory and Applications