Downloaded 283 times


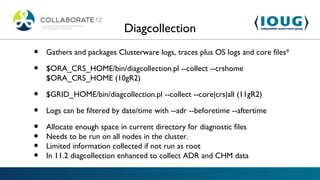
![diagcollection example
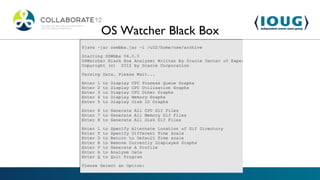
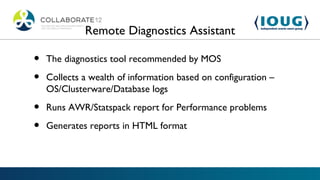
[root@oelgrid02 u02]# /u01/app/11.2.0/grid/bin/diagcollection.sh --collect
Production Copyright 2004, 2010, Oracle. All rights reserved
Cluster Ready Services (CRS) diagnostic collection tool
The following CRS diagnostic archives will be created in the local directory:
crsData_oelgrid02_20120225_1723.tar.gz -> logs, traces and cores from CRS home.
Note: core files will be packaged only with the --core option.
ocrData_oelgrid02_20120225_1723.tar.gz -> ocrdump, ocrcheck etc
coreData_oelgrid02_20120225_1723.tar.gz -> contents of CRS core files in text
format
osData_oelgrid02_20120225_1723.tar.gz -> logs from Operating System
Collecting crs data](https://image.slidesharecdn.com/2012373nelsonpptnew-120427121545-phpapp02/85/Looking-at-RAC-GI-Clusterware-Diagnostic-Tools-7-320.jpg)
![Procwatcher
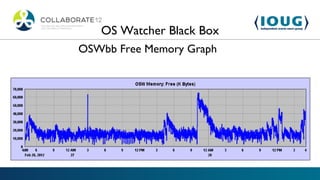
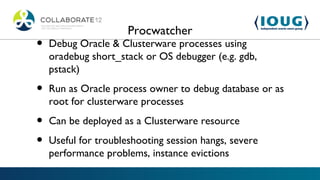
grid@node1[+ASM1]-/u02 >./prw.sh start all
Wed Feb 25 02:30:26 CDT 2012: Starting Procwatcher
Wed Feb 25 02:30:26 CDT 2012: Thank you for using Procwatcher.
:-)
Wed Feb 25 02:30:26 CDT 2012: Please add a comment to Oracle
Support Note 459694.1
Wed Feb 25 02:30:26 CDT 2012: if you have any comments,
suggestions, or issues with this tool.
Wed Feb 25 02:30:26 CDT 2012: Started Procwatcher](https://image.slidesharecdn.com/2012373nelsonpptnew-120427121545-phpapp02/85/Looking-at-RAC-GI-Clusterware-Diagnostic-Tools-21-320.jpg)
![MOS Notes
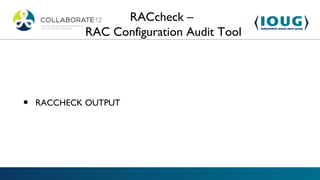
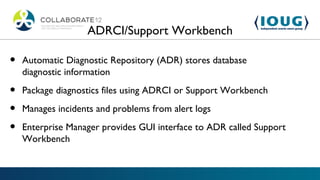
• OS Watcher Black Box User Guide [ID 301137.1]
• OS Watcher Black Box Analyzer User Guide [ID 461053.1]
• Data Gathering for Troubleshooting Oracle Clusterware (CRS or GI) Issues [ID 289690.1]
• CRS 10gR2/ 11gR1/ 11gR2 Diagnostic Collection Guide [ID 330358.1]
• Diagnosability for Oracle Clusterware (CRS or Grid Infrastructure) Component and Resource [ID 357808.1]
• Data Gathering for Troubleshooting RAC Issues [ID 556679.1]
• Cluster Health Monitor (CHM) FAQ [ID 1328466.1]
• Introducing Cluster Health Monitor (IPD/OS) [ID 736752.1]
• RACcheck - RAC Configuration Audit Tool [ID 1268927.1]
• Procwatcher: Script to Monitor and Examine Oracle DB and Clusterware Processes [ID 459694.1]
• Script to Collect RAC Diagnostic Information (racdiag.sql) [ID 135714.1]](https://image.slidesharecdn.com/2012373nelsonpptnew-120427121545-phpapp02/85/Looking-at-RAC-GI-Clusterware-Diagnostic-Tools-27-320.jpg)

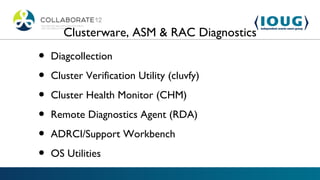
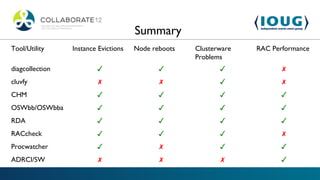
The document discusses various diagnostic tools and techniques for Oracle Real Application Clusters (RAC) and Clusterware management, including tools like diagcollection, Cluster Verification Utility (cluvfy), Cluster Health Monitor (CHM), and Remote Diagnostics Assistant (RDA). It provides practical guidelines for executing these tools, their specific functions, and their importance in troubleshooting and ensuring optimal performance of RAC environments. Additionally, it includes references to user guides and resources for further assistance and understanding of the mentioned utilities.


![[NYC Meetup] Docker at Nuxeo](https://cdn.slidesharecdn.com/ss_thumbnails/dockermeetupnyc-140605110024-phpapp01-thumbnail.jpg?width=640&height=640&fit=bounds)


![Getting Started with Apache Spark: Big Data Made Simple [Free Meetup]](https://cdn.slidesharecdn.com/ss_thumbnails/apachesparkgettingstarted-260203175547-8361bcc3-thumbnail.jpg?width=640&height=640&fit=bounds)


