This report analyzes how tidal flooding is expected to increase along the U.S. East and Gulf Coasts over the next 15-30 years due to rising sea levels. The analysis finds that over half of the 52 communities studied will experience over 25 flood days per year by 2030, up from only a few per year currently. Many communities will see flood frequencies triple or more. By 2045, tidal flooding could become almost daily in some locations. The increased flooding will disrupt communities by limiting access and damaging homes and businesses. Coastal communities need to start implementing adaptation measures and policies to build resilience against future flooding impacts.
UNCERTAINTY OF HYDROLOGIC EVENTS UNDER SOUTH DAKOTA’S CHANGING CONDITIONS: A ...Boris Shmagin
Widespread flooding across South Dakota in 2011 has spurred a new look at the institutional, regulatory, and mathematical models used to manage the Upper Missouri River Basin as it affects all aspects of life in South Dakota. An SD EPSCoR planning grant was awarded to a team of local, national and international
researchers, who produced a strategy to create a research infrastructure with the goal of developing conceptual and mathematical models to understand and describe the uncertainty of hydrological events (HE) across South Dakota. The strategy involves two main tasks: 1) planning for study of the uncertainty of HE in the Upper Missouri Basin (Shmagin, B. 2011. Missouri River watershed: the object for hydrological study and uncertainty of models. Available from Nature
Precedings at <http: />. [Accessed Oct 3, 2012].)
and 2) developing concepts for communicating uncertainty of HE for wider use outside the professional community. The plan brings together a variety of disciplines, and outlines the development of an artificial intelligence approach to analyzing the interaction of HE, engineering installations and social systems in South Dakota.
The focus of study is the system hydrological researcher – mathematical modeler
– stakeholder, and the process considered is the interaction of knowledge with uncertainty in application to HE. Uncertainty in HE will be defined using concepts broader than hydrology (such as statistical learning) and linked to the concerns of all social, cultural and economic sectors in South Dakota.
Considering this system of interacting participants allows focusing on the principal stages in tackling uncertainty, from developing the research task and obtaining the hydrological results to communication between researcher and stakeholder. Mathematical models are the universal language in scientific research
and will be adapted to bring the results to stakeholders. Three mathematical
approaches to modeling HE and impacts to South Dakota will be considered: 1) distributed system interactions, 2) statistical learning and 3) cellular automata.
Specific concepts of uncertainty for modeling watersheds and describing the time-space variability of water cycles and budget for regional hydrologic study were developed. These concepts include remotely sensed data use, scale and influence of drainage and irrigation on the groundwater regime and hydrology of wetlands and lakes in the Missouri River Valley and Prairie Pothole Region. Additional necessary concepts concern risk assessment and HE interaction with the sociology and economy (e.g., types and scales of regionalization of the physical and human environment), and the design of interactive simulation models (e.g., cartographic presentation and simplified educational modeling after A. Voinov [2008]. of HE in the natural landscapes and industrial/changed conditions in South Dakota.
Confluence is the bi-annual newsletter of the Westcountry Rivers Trust. Confluence is packed with all of the latest news on the work of the Trust and what is happening in river restoration and conservation across the Westcountry.
The Autumn 2012 edition was a special edition about the Trust's River Improvement Projects funded by the Environment Agency's Catchment Restoration Fund earlier in the year.
The Practice and Potential of Ecosystem-Based Management
Applying lessons from land use and coastal management in Maine hosted by Wells National Estuarine Research Reserve,
Maine Coastal Program, Maine Sea Grant,the University of New England, and the Ecosystem-based Management Tools Network
Kelly Mooij, Esq., Vice President Government Relations, New Jersey Audubon Society
Jill Witkowski, Esq., Director, Choose Clean Water
Mark Zakutansky, Mid-Atlantic Policy Manager, Appalachian Mountain Club
Is the water crises inevitable or is it a matter of governance and equity? Ex...UNESCO Venice Office
Water Family Meeting and Symposium on Water Equity in South-East Europe and the Mediterranean
28-29 March 2019 Palazzo Zorzi, Venice (Italy) -
András Szöllösi-Nagy, former Secretary UNESCO IHP, former rector UNESCO-IHE, Governor of the World Water Council
This slideshow highlights the first-ever multinational Eco-Audit of the Mesoamerican Reef.
The Eco-Audit evaluates efforts to protect and sustainably manage the region’s coral reefs, celebrates management success stories, and documents the extent to which recommended management actions have been implemented in Belize, Guatemala, Honduras, and Mexico.
Visit wri.org/reefs to learn more about the World Resources Institute’s collaboration with the Healthy Reef Initiative to develop and implement the Eco-Audit of the Mesoamerican Reef.
A Review of Environmental Implications of Dredging ActivitiesIJAEMSJORNAL
Dredging is a global anthropogenic excavation activity of removing sediments from water bodies and depositing it elsewhere. It is a mixed blessing as it has both beneficial and adverse impacts. This paper is on a review of environmental implications of dredging. The objective of the paper is to review previous works by researchers on the environmental consequences of dredging. The method used is a review of academic/journal articles, internet materials, conference / workshop papers, textbooks, bulletins and publicly available materials on dredging activities. The results of the study revealed that previous authors whose works were reviewed have a convergent view that apart from the beneficial impacts of dredging (e.g. keeping waterways navigable, flood and storm protection and provision of materials for road construction and building), it has lots of adverse environmental impacts, including environmental pollution, erosion, widespread hydrological changes, reduction in the population of aquatic lives like destruction of fish spawning grounds and benthic organisms and resuspension of particulate matter column that has elevated levels of lead, copper, zinc and nickel in Phytoplankton. Recommendations of the study include: (1) establishment of environmental legislations and regulations for dredging operation; (2) use of green technology in dredging activities to minimize suspension of sediments and contamination/pollution of dredging environments; and (3) creation of awareness among dredging contractors, regulators and marine communities where dredging take place on the economic and ecological values of the marine ecosystems that are usually very sensitive, fragile and productive.
Letter from Radical Environmental Groups to NY Gov. Andrew Cuomo Asking Him t...Marcellus Drilling News
A letter signed by a few groups, but mostly by individuals pretending to be groups, request that Cuomo consider mythical global warming and act to ban shale drilling in New York based on that hokum. It's more of the same left-wing pap from the same left-wing groups.
Ecological Marine Units: A New Public-Private Partnership for the Global OceanDawn Wright
Invited keynote for the 2017 Marine GIS User Group meeting held Thursday, May 25th at Stanford’s Hopkins Marine Station, 120 Ocean View Blvd., Pacific Grove, CA. The main web site for this user group is walrus.wr.usgs.gov/MontereyBayMarineGIS. The event page for the talk: https://hopkinsmarinestation.stanford.edu/events/dawn-wright-oregon-state-university-new-public-private-partnership-global-ocean
The report summarizes the science and the impacts of climate change on the United States, now and in the future. It focuses on climate change impacts in different regions of the U.S. and on various aspects of society and the economy such as energy, water, agriculture, and health. It’s also a report written in plain language, with the goal of better informing public and private decision making at all levels.
In addition to discussing the impacts of climate change in the U.S., the report also highlights the choices we face in response to human-induced climate change
The unprecedented damage Hurricane Sandy caused along the East Coast of the US, especially
to the densely populated New York and New Jersey coastlines, was a wake-up call to the threat
that weather events pose to our communities. The world has always been plagued by severe and
seemingly intractable problems, including storms, but today, we live with an unprecedented level of
disruption. Things go wrong with more frequency and severity, greater complexity, and with more
inter-related effects. No longer can we afford to simply rebuild what existed before. We must begin
to rethink our recovery efforts, making sure the damaged region is resilient enough to rebound from
future storms.
Water risks are increasingly driving conflict and instability around the world. Solutions to water conflicts exist, but we need the political will to make them happen.
On Wednesday, February 23, 2011, WRI and more than 25 partners launched Reefs at Risk Revisited, a comprehensive analysis of the threats to coral reefs. Find out more at http://bit.ly/hSWmhU
Report - Hurricane Sandy’s Untold Filthy Legacy: Sewageclimate central
Explore the wheres, whats, and hows of the 11 billion gallons of sewage that overflowed into rivers and other waterways, largely as a result of record storm-surge flooding that swamped the region’s major sewage treatment facilities.
Financing Nature: Closing the global biodiversity financing gapSarah Bergs
2. Deutz, A., Heal, G.M., Niu, R., Swanson, E., Townshend, T., Zhu, L., Delmar, A., et al. (2020), Financing Nature: Closing the global biodiversity financing gap, The Paulson Institute, The Nature Conservancy, and Cornell Atkinson Center for Sustainability.
Mission: Magazine, Issue #1 - The Magazine that Addresses Critical Water IssuesXylem Inc.
Mission: Water is a complimentary magazine featuring the world's most current water issues and how people, like you, are tackling these ever-important challenges. Our mission is to share inspirational stories of determination, curiosity and discovery – and how great advancements are being made to better understand and protect our vital water resources.
https://www.ysi.com/mission-water
Ecological Marine Units: A 3-D Mapping of the Ocean Based on NOAA’s World Oce...Dawn Wright
This webinar to the Ecosystem Based Management Tools Network, May 17, 2017, reported progress on the Ecological Marine Units (EMU) project, a new undertaking commissioned by the Group on Earth Observations, to develop a standardized and practical global ecosystems classification and map for the oceans. The EMU is comprised of a global point mesh framework, created from 52,487,233 points from the NOAA World Ocean Atlas. Each point has x, y, z, as well as six attributes of chemical and physical oceanographic structure (temperature, salinity, dissolved oxygen, nitrate, silicate, phosphate) that are likely drivers of many ecosystem responses. We identify and map 37 environmentally distinct 3D regions (candidate ‘ecosystems’) within the water column. These units can be attributed according to their productivity, direction and velocity of currents, species abundance, global seafloor geomorphology, and more. A series of data products for open access will share the 3D point mesh and EMU clusters at the surface, bottom, and within the water column, as well as 2D and 3D web apps for exploration of the EMUs and the original World Ocean Atlas data. This webinar provided an overview of the EMU project and cover recent developments and future plans for the EMUs. Webinar recording at https://www.openchannels.org/webinars/2017/ecological-marine-units-3-d-mapping-ocean-based-noaas-world-ocean-atlas
WRI’s brand new “Food Service Playbook for Promoting Sustainable Food Choices” gives food service operators the very latest strategies for creating dining environments that empower consumers to choose sustainable, plant-rich dishes. This research builds off our first guide for food service, now with industry experience and insights from nearly 350 academic trials.
UNDERSTANDING WHAT GREEN WASHING IS!.pdfJulietMogola
Many companies today use green washing to lure the public into thinking they are conserving the environment but in real sense they are doing more harm. There have been such several cases from very big companies here in Kenya and also globally. This ranges from various sectors from manufacturing and goes to consumer products. Educating people on greenwashing will enable people to make better choices based on their analysis and not on what they see on marketing sites.
Natural farming @ Dr. Siddhartha S. Jena.pptxsidjena70
A brief about organic farming/ Natural farming/ Zero budget natural farming/ Subash Palekar Natural farming which keeps us and environment safe and healthy. Next gen Agricultural practices of chemical free farming.
Willie Nelson Net Worth: A Journey Through Music, Movies, and Business Venturesgreendigital
Willie Nelson is a name that resonates within the world of music and entertainment. Known for his unique voice, and masterful guitar skills. and an extraordinary career spanning several decades. Nelson has become a legend in the country music scene. But, his influence extends far beyond the realm of music. with ventures in acting, writing, activism, and business. This comprehensive article delves into Willie Nelson net worth. exploring the various facets of his career that have contributed to his large fortune.
Follow us on: Pinterest
Introduction
Willie Nelson net worth is a testament to his enduring influence and success in many fields. Born on April 29, 1933, in Abbott, Texas. Nelson's journey from a humble beginning to becoming one of the most iconic figures in American music is nothing short of inspirational. His net worth, which estimated to be around $25 million as of 2024. reflects a career that is as diverse as it is prolific.
Early Life and Musical Beginnings
Humble Origins
Willie Hugh Nelson was born during the Great Depression. a time of significant economic hardship in the United States. Raised by his grandparents. Nelson found solace and inspiration in music from an early age. His grandmother taught him to play the guitar. setting the stage for what would become an illustrious career.
First Steps in Music
Nelson's initial foray into the music industry was fraught with challenges. He moved to Nashville, Tennessee, to pursue his dreams, but success did not come . Working as a songwriter, Nelson penned hits for other artists. which helped him gain a foothold in the competitive music scene. His songwriting skills contributed to his early earnings. laying the foundation for his net worth.
Rise to Stardom
Breakthrough Albums
The 1970s marked a turning point in Willie Nelson's career. His albums "Shotgun Willie" (1973), "Red Headed Stranger" (1975). and "Stardust" (1978) received critical acclaim and commercial success. These albums not only solidified his position in the country music genre. but also introduced his music to a broader audience. The success of these albums played a crucial role in boosting Willie Nelson net worth.
Iconic Songs
Willie Nelson net worth is also attributed to his extensive catalog of hit songs. Tracks like "Blue Eyes Crying in the Rain," "On the Road Again," and "Always on My Mind" have become timeless classics. These songs have not only earned Nelson large royalties but have also ensured his continued relevance in the music industry.
Acting and Film Career
Hollywood Ventures
In addition to his music career, Willie Nelson has also made a mark in Hollywood. His distinctive personality and on-screen presence have landed him roles in several films and television shows. Notable appearances include roles in "The Electric Horseman" (1979), "Honeysuckle Rose" (1980), and "Barbarosa" (1982). These acting gigs have added a significant amount to Willie Nelson net worth.
Television Appearances
Nelson's char
Characterization and the Kinetics of drying at the drying oven and with micro...Open Access Research Paper
The objective of this work is to contribute to valorization de Nephelium lappaceum by the characterization of kinetics of drying of seeds of Nephelium lappaceum. The seeds were dehydrated until a constant mass respectively in a drying oven and a microwawe oven. The temperatures and the powers of drying are respectively: 50, 60 and 70°C and 140, 280 and 420 W. The results show that the curves of drying of seeds of Nephelium lappaceum do not present a phase of constant kinetics. The coefficients of diffusion vary between 2.09.10-8 to 2.98. 10-8m-2/s in the interval of 50°C at 70°C and between 4.83×10-07 at 9.04×10-07 m-8/s for the powers going of 140 W with 420 W the relation between Arrhenius and a value of energy of activation of 16.49 kJ. mol-1 expressed the effect of the temperature on effective diffusivity.
"Understanding the Carbon Cycle: Processes, Human Impacts, and Strategies for...MMariSelvam4
The carbon cycle is a critical component of Earth's environmental system, governing the movement and transformation of carbon through various reservoirs, including the atmosphere, oceans, soil, and living organisms. This complex cycle involves several key processes such as photosynthesis, respiration, decomposition, and carbon sequestration, each contributing to the regulation of carbon levels on the planet.
Human activities, particularly fossil fuel combustion and deforestation, have significantly altered the natural carbon cycle, leading to increased atmospheric carbon dioxide concentrations and driving climate change. Understanding the intricacies of the carbon cycle is essential for assessing the impacts of these changes and developing effective mitigation strategies.
By studying the carbon cycle, scientists can identify carbon sources and sinks, measure carbon fluxes, and predict future trends. This knowledge is crucial for crafting policies aimed at reducing carbon emissions, enhancing carbon storage, and promoting sustainable practices. The carbon cycle's interplay with climate systems, ecosystems, and human activities underscores its importance in maintaining a stable and healthy planet.
In-depth exploration of the carbon cycle reveals the delicate balance required to sustain life and the urgent need to address anthropogenic influences. Through research, education, and policy, we can work towards restoring equilibrium in the carbon cycle and ensuring a sustainable future for generations to come.
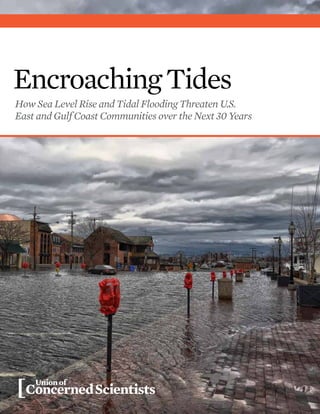
1. Encroaching Tides
How Sea Level Rise and Tidal Flooding Threaten U.S.
East and Gulf Coast Communities over the Next 30 Years
2.
3. Encroaching Tides
How Sea Level Rise and Tidal Flooding Threaten U.S.
East and Gulf Coast Communities over the Next 30 Years
Erika Spanger-Siegfried
Melanie Fitzpatrick
Kristina Dahl
October 2014
5. [ Contents ]
iv Figures, Boxes, and Snapshots
v About the Project Team
vi Acknowledgments
1 Executive Summary
INTRODUCTION
5 Sea Level Rise and Tidal Flooding: Encroaching on Our Coasts,
Affecting Daily Life
Chapter 1
8 Tidal Flooding: A Daily Cycle Gains Disruptive Force
Chapter 2
16 Tidal Flooding in 2030: From Occasional to Chronic in 15 Years
Chapter 3
19 Tidal Flooding in 2045: From Chronic to Incessant
Community Profiles
27 On the Front Line of Tidal Flooding
Chapter 4
40 Sensible Steps and Forward-Looking Policies for Resilient Communities
51 Key Terms
52 Appendix: Projections for Flooding Frequency in 52 Communities
54 References
Encroaching Tides iii
6. [ Figures, Boxes, and Snapshots ]
Figures
8 Figure 1. Normal Variations in the Tides
9 Figure 2. Identifying Flooding Thresholds
10 Figure 3. Average Global Sea Level Rise
10 Figure 4. Local Sea Level Rise and Tidal Flooding, 1970–2012
13 Figure 5. East and Gulf Coast Locations in Our Analysis
15 Figure 6. Historical and Projected Sea Level Rise
17 Figure 7. Tidal Flooding Today, in 2030, and in 2045
18 Figure 8. The Growing Reach of Tidal Flooding as Thresholds Are Exceeded
More Often
21 Figure 9. Expanding Reach of Tidal Flooding: Atlantic City Area and Miami
22 Figure 10. Year When Nuisance Floods Become Extensive
23 Figure 11. The Growing Frequency and Spread of Tidal Flooding
24 Figure 12. New Locations Join the Front Line of Tidal Flooding
Boxes
9 Box 1. High Tides Make the Impact of Foul Weather Worse
15 Box 2. Projecting Future Sea Level Rise
25 Box 3. The Gulf Coast: Sinking Shores Meet Rising Seas
Snapshots
7 Washington, DC, Metro Area
11 Ocean City, MD
14 Portland, ME
17 Lewes, DE
22 Portsmouth, NH
41 Baltimore, MD
42 Bridgeport, CT
44 Boston, MA
47 Key West, FL
48 Philadelphia, PA
iv union of concerned scientists
7. [ About the Project Team ]
Authors
Erika Spanger-Siegfried
Melanie Fitzpatrick
Kristina Dahl
Full Team
Project Management: Erika Spanger-Siegfried
Leadership: Angela Anderson, Brenda Ekwurzel, Adam Markham
Additional review: Carina Barnett-Loro, Kate Cell, Rachel Cleetus,
Nancy Cole, Rob Cowin, Matt Heid, Lisa Nurnberger, Jean Sideris,
Jackie Weidman
Research: Bjorn Grigholm, Alison Loomis
Mapping: Kristina Dahl, Chris Watson
Editorial support: Sandra Hackman, Seth Shulman
Production: Aaron Eckhouse, Andrew Klein, Heather Tuttle,
Bryan Wadsworth
Design: Tyler Kemp-Benedict
Encroaching Tides v
8. [ Acknowledgments ]
This report was made possible by the generous support of the Grantham
Foundation for the Protection of the Environment, the Barr Foundation, the Energy
Foundation, Mr. and Mrs. Jerry Babicka, and Dr. Randall D. and Sally Knight.
The project team would like to acknowledge the essential assistance we
received in the development of this report. For their unparalleled insight, advice,
and support, we extend our gratitude to Susanne Moser, Nicole Hernandez
Hammer, and Rachel Cleetus. For invaluable technical guidance and input during
the analytical process, we are indebted to E. Robert Thieler (U.S. Geological Survey,
Woods Hole, MA), Brent Yarnal (Pennsylvania State University), David P. Retchless
(Pennsylvania State University), Ellen Douglas (University of Massachusetts–
Boston), Paul Kirshen (University of New Hampshire), and advisers from the
National Oceanic and Atmospheric Administration (NOAA) National Ocean
Service, including William Sweet, Doug Marcy, and Matthew R. Pendleton (The
Baldwin Group for NOAA’s Office for Coastal Management). And for sharing their
vital local sea level rise projections with us, we thank Ben Strauss, Dan Rizza, and
others at Climate Central.
We are grateful to the following individuals for their thoughtful comments
on review drafts of this report: Larry Atkinson (Old Dominion University), Lisa
Auermuller (Jacques Cousteau National Estuarine Research Reserve), Leonard
Berry (Florida Atlantic University), Tal Ezer (Old Dominion University), Nicole
Hernandez Hammer (Florida Atlantic University), Andy Keeler (University of
North Carolina and East Carolina University), Paul Kirshen (University of New
Hampshire), Steve J. Miller (Great Bay National Estuarine Research Reserve),
Susanne Moser (Susanne Moser Research and Consulting), Gwen Shaughnessy
(The Baldwin Group for NOAA’s Office for Coastal Management), and Forbes
Tompkins (World Resources Institute).
The following people provided indispensable input to the place-based profiles
and snapshots included in this report: John B. Anderson (Rice University), Kristin
Baja (City of Baltimore, MD), Peter Britz (City of Portsmouth, NH), Lynne Carter
(USAID/FHI360), Lisa M. Craig (City of Annapolis, MD), Jason Evans (Stetson
University), Allison Hardin (City of Myrtle Beach, SC), Daniel Hendrick (New York
League of Conservation Voters), Kevin Jenkins (U.S. Naval Academy), Zoe Johnson
(Maryland Department of Natural Resources), Jennifer Kline (Georgia Department
of Natural Resources Coastal Management Program), Dan Mundy, Sr. (Jamaica
Bay Ecowatchers), James Redick (City of Norfolk, VA), Stanley Riggs (East
Carolina University), Kate Skaggs (Maryland Department of Natural Resources),
Skip Stiles (Wetlands Watch), Sarah Watson (Rutgers University), Jessica C.
Whitehead (North Carolina Sea Grant), and Paul Wolff (city council member, Tybee
Island, GA).
vi union of concerned scientists
9. We received generous advice from many others in the expert and stake-holder
communities, including: John D. Boon III (Virginia Institute of Marine
Science), Dan Burger (South Carolina Department of Health and Environmental
Control), Carol Dillon Dawson (Buxton, NC), Noah Goldberg (Office of Emergency
Management, Westchester County, NY), Helen Henderson (American Littoral
Society), Charles S. Hopkinson (University of Georgia), Mary Kimball (New York
City Department of City Planning), Frank Knapp (American Sustainable Business
Council and South Carolina Small Business Chamber of Commerce), Joe Sastre
(Office of Emergency Management, Groton, CT), Jackie Jackson Teel (Chatham
County—Savannah Metropolitan Planning Commission), and Mike Tidwell
(Chesapeake Climate Action Network).
In addition, many staff at NOAA’s National Ocean Service (NOS) and National
Weather Service (NWS) were extremely generous with their time and expertise,
including: Richard Bandy (NWS), Gary Conte (NWS), Brian Cullen (NWS), Tim
Doherty (NOS), Darlene Finch (NOS), Barry Goldsmith (NWS), Rebecca Lunde
(NOS), Jeffrey A. Orrock (NWS), Steven Pfaff (NWS), William Sammler (NWS),
Rebecca Smyth (NOS), Heidi Stiller (NOS), Gary Szatkowski (NWS), and Nelson
Vaz (NWS).
This report would not have been possible without strong research assistance
from Alison Loomis, tremendous editorial support from Sandra Hackman, careful
mapping services from Chris Watson, and superb design work from Tyler Kemp-
Benedict. And for his tireless dedication to the production of the report, Andrew
Klein has our gratitude.
Members of the team thank Erika Spanger-Siegfried for her exceptional man-agement
of the project.
Affiliations are for identification purposes only. The opinions expressed herein do not
necessarily reflect those of the organizations that funded the work or the individuals
who reviewed it. The Union of Concerned Scientists bears sole responsibility for the
report’s content.
Encroaching Tides vii
13. average, and are limited in extent. By about 2045, however,
the city can expect more than 35 tidal floods every year.
Other locations with fewer than five tidal floods per year
today could see a 10-fold increase in the number of floods
annually by 2045.
Given the substantial and nearly ubiquitous rise in the
frequency of floods expected in our 52 locations, other com-munities
along the East and Gulf Coasts will need to brace for
similar changes. Their susceptibility to flooding will depend
on the local topography, their natural and physical defenses,
and the measures they take to adapt.
Sensible Steps for Building Resilient Coastal
Communities
Coastal communities and states, and the nation as a whole,
need to prepare for near-term changes in tidal flooding, while
working hard to minimize longer-term losses through efforts
to both adapt to these changes and limit their extent.
BUILDING COASTAL RESILIENCE IS A LOCAL IMPERATIVE . . .
Over the next few decades—the time frame of our analysis—
changes set in motion by our past and present heat-trapping
emissions will largely drive the pace of sea level rise. The lag of
several decades between the release of carbon into the atmo-sphere
and the response of the ocean means that more tidal
flooding is virtually guaranteed, and that communities need
to act with urgency. Locally, there are many things we can do
to help ensure enduring coastal communities, including:
• Upgrade the built infrastructure in harm’s way.
With help, communities can prioritize and incentivize
flood-proofing of homes, neighborhoods, and key infra-structure,
such as sewer and stormwater systems.
• Avoid putting anything new in harm’s way. Communi-ties
can use a range of regulatory and planning tools to
curtail new development in coastal locations subject to
tidal flooding now and in the future.
• Consider the risks and benefits of adaptation measures.
Some measures to limit the impact of coastal flooding
can provide multiple benefits, while others can alter
shoreline dynamics and damage neighboring areas and
ecosystems. Decision makers need to ensure that a rush
to protect coastal communities builds broad-based
resilience, rather than helping some areas while putting
others at risk.
• Develop a long-term vision. Communities that create
a vision for both near-term protection and long-term
resilience in the face of sea level rise—and craft plans for
As the reach of the tides
expands, communities
now unfamiliar with tidal
flood conditions will start
to see such flooding more
regularly—a new normal.
Washington, DC, for example, can expect more than 150 tidal
floods a year, and several locations in New Jersey could see
80 tidal floods or more.
By 2045—within the lifetime of a 30-year mortgage—
many coastal communities are expected to see roughly
one foot of sea level rise. As that occurs, one-third of the
52 locations in our analysis would start to face tidal flooding
more than 180 times a year, on average. And nine locations,
including Atlantic City and Cape May, NJ, can expect to see
tidal flooding 240 times or more per year.
In this future, days without high-tide floods could start
to become the exception in certain places. Without sensible
preparation for these disruptions, conducting daily life in
such flood-prone areas would become, at best, unreliable and,
at worst, dangerous.
FLOODING DURING HIGH TIDES BECOMES MORE EXTREME
Today strong winds or a storm system are typically required
for coastal flooding to become extensive. But sea level rise is
changing that. In the near future, higher seas will mean that
high tides can reach farther inland, creating flood conditions
that last longer and disrupt daily life for growing numbers
of people.
In some East Coast locations, such as Savannah, GA
(at Fort Pulaski), and Lewisetta, VA, extensive flooding is
expected to occur with tides alone on a regular basis within
one or two decades. By 2045, even more places can expect
to see extensive flooding, including Ocean City, MD, and
Myrtle Beach, SC (at Springmaid Pier). When strong winds
or heavy rains do occur on top of elevated seas, the risk of
extensive flooding will rise higher still.
MORE COMMUNITIES JOIN THE FRONT LINE OF TIDAL
FLOODING
As the reach of the tides expands, communities now unfa-miliar
with tidal flood conditions will start to see such
flooding more regularly—a new normal. In New London, CT,
for example, tidal floods now occur just twice per year, on
Encroaching Tides 3
14. building better, safer, and more equitably—will be best
positioned to thrive in the years ahead.
. . . AND A NATIONAL ONE
But local communities can’t go it alone—coastal challenges
are too great, the costs are too steep, and too many people are
at risk. Instead, we need a coordinated, well-funded national
response to our country’s coastal vulnerability involving
federal, state, and local collaboration. Federal and state gov-ernments
can help build local resilience by supporting, incen-tivizing,
regulating, and even mandating action. They can:
• Build and maintain a coastal monitoring and
data-sharing system equal to the threat. Key federal
agencies can sustain and expand efforts to monitor and
project sea level rise and flooding, and ensure that local
decision makers have access to the data.
• Encourage or mandate the use of good scientific
information. Agencies can require that communities and
other applicants for state and federal funds use the best
available data, and demonstrate that new development
and redevelopment projects can withstand projected
tidal flooding and storm surges.
• Support planning. More federal support for state and
local planning and collaboration can accelerate efforts to
build coastal resilience.
• Mobilize funding. Adapting to sea level rise will require
major, sustained investment. Federal policy makers
need to develop new funding sources to support resil-ience-
building efforts at the state and local level.
• Improve risk management. The true costs of living on
the coast are not reflected in the price of flood insurance
and other risk management tools. But big increases in
the cost of insurance are hard for many to bear. Federal
incentives to reduce some property owners’ risks and
costs can aid the transition to a more solvent flood insur-ance
system and better risk management.
• Ensure equitable investments. Federal investments in
coastal resilience can prioritize households and commu-nities
with the greatest needs.
• Reduce heat-trapping emissions. A near-term increase
in sea level rise and tidal flooding may be locked in, but
changes later this century and beyond are not fixed. To
slow the rate of sea level rise—and enable coastal com-munities
to adapt in affordable and manageable ways—
we must reduce our global warming emissions.
THE HARD TRUTH: WE FACE FUNDAMENTAL LIMITS
TO COASTAL ADAPTATION
As sea level rises, even our best protection efforts will not suffice
in some areas in the face of rising tides, waves, and storm surges.
In certain locations, shoreline dynamics will make it
impossible to build structural defenses. Residents, business
owners, communities, and ultimately the nation may reach
their capacity to fund costly measures. People may also
simply be unwilling to face ever more frequent flood-related
disruptions. As we reach these and other de facto limits to
coastal adaptation, communities will face the prospect of
shifting back from the shore. If we plan well, though, we
can sustain our communities by pulling back from the most
affected areas before flooding becomes too disruptive.
These limits will arrive sooner in those areas exposed to
greater risks, those with more fragile ecosystems and limited
natural buffers, and those that are less well-off economically.
Our coasts will also face these limits sooner if we allow climate
change and sea level rise to grow into an even greater crisis.
TO LIMIT FUTURE SEA LEVEL RISE AND SUSTAIN COASTAL
COMMUNITIES, WE MUST CURB CARBON EMISSIONS
Global emissions are rising rapidly, and are on a trajectory to
push surface temperatures more than 2°C (3.6ºF) above the
preindustrial average—the threshold beyond which scientists
say “dangerous” climate change becomes unavoidable. To stay
below this threshold, and slow the rate of sea level rise later
this century and beyond, global carbon emissions need to
peak and begin to decline by the end of this decade.
Leaders at all levels of government need to take seriously
the risks facing people living along our coasts and the urgent
need for action. And communities faced with tidal flooding
need to hold their local, state, and national leaders account-able
for taking strong action to both adapt to rising seas and
mitigate global warming. As a nation, we need to commit to
the challenge today, treating the resilience of our coasts as a
century-long project—one that requires a concerted early push,
one to which we commit for the long haul, and one that enables
communities to thrive even in the face of encroaching tides.
Leaders at all levels of
government need to take
seriously the risks facing
people living along our
coasts and the urgent need
for action.
4 union of concerned scientists
18. [ Chapter 1 ]
Tidal Flooding: A Daily Cycle Gains Disruptive Force
8
7
6
5
4
3
2
1
0
-1
Water Level (feet above low tide)
WARNING
ADVISORY
ADVISORY ADVISORY Minor Flooding
10/26 10/27 10/28 10/29
Moderate Flooding
Average High Tide
10/30 10/31 11/1
October 2011
challenges to daily life in affected areas (Figure 2). And like
any nuisance—a brief power outage, heavy traffic, a loss of cell
phone coverage—such floods take on a new level of gravity
and significance when they become chronic. Inches—or
sometimes feet—of seawater may make roadways impassable.
Water may also overtop docks and boat ramps, wash high
The rise and fall of the tides is familiar to anyone who has
spent a day at the beach. During high tide, the water comes
farther onshore, and beachgoers move back to stay dry. Low
tide exposes tide pools and sandbars.
The cycle of the tides results from the rotation of Earth
combined with the gravitational forces of the moon and sun.
While these forces are global, wind patterns and coastal
contours influence the timing and range of tides in a given
location. Together these factors mean that high and low tides
typically occur twice daily along the East Coast and once
daily along the Gulf Coast.
Twice a month (during new and full moons), Earth, sun,
and moon align. The combined gravitational pull of the sun
and moon during these times exerts a greater force on Earth’s
oceans, and high tides become slightly higher than normal,
while low tides are slightly lower. These tides are often called
spring tides. Several times a year, during a new or full moon
when the moon is closest to Earth, the range of the tides
is even greater. These are sometimes called king tides, or
perigean spring tides. In this report, we refer to spring and
king tides as extreme high tides.
Coastal communities are accustomed to these rhythms:
tides typically rise and fall with little impact. However, when
high tides are above normal—usually by one to three feet
depending on the location—the National Weather Service
may issue a coastal flood advisory. Advisories can be issued
on consecutive days for the time of day surrounding high tide
(Figure 1).
The National Weather Service categorizes tidal flood-ing
that is limited in extent and duration as “minor” or
“nuisance” flooding. While these floods typically do not
pose a direct risk to life or property, they can and do present
FIGURE 1. Normal Variations in the Tides
When tides are running high, such as during a new or full moon, high
tides can cause flooding several days in a row. In this example from
Lewes, DE, in October 2011, high tides crossed the minor flooding
threshold on four consecutive days, until the pull of the new moon
began to diminish.
SOURCES: IOWA ENVIRONMENTAL MESONET 2014; NOAA 2013.
8 union of concerned scientists
19. FIGURE 2. Identifying Flooding Thresholds
Moderate Flooding
Minor Flooding
Average High Tide
Today
Tidal flooding can occur when high tide exceeds the normal level
by about one to three feet (white arrow), depending on the location.
Minor, or nuisance, flooding, as determined by the National Weather
Service, can disrupt local transportation and daily life. Moderate
flooding is more extensive and can threaten life and property. This
type of flooding can occur with an extreme high tide, or when high
tide combines with a storm system. As sea levels continue to rise,
tides will exceed these thresholds more often.
up on beaches and erode sand, back up sewers and storm
drains, and fill neighborhood parks and parking areas with
standing water.
Today’s extreme high tides tend to cause nuisance flood-ing.
However, if they occur with wind, rainfall, or storms,
more extensive flooding can result (see Box 1). The National
Weather Service categorizes this type of flooding as “moder-ate.”
Because it poses a threat to public safety and property,
the National Weather Service typically issues a coastal flood
warning for such an event. While moderate coastal flooding
can occur during events such as tropical storms, both minor
and moderate flooding are distinct from the catastrophic
flooding associated with storm surge, as occurred during
Hurricane Sandy.2
Most coastal locations have the potential to flood, but
some places face tidal flooding more often than others. Com-munities
along Chesapeake Bay, for example, where land is
almost uniformly low-lying and sinking (subsiding), or along
coastal New Jersey, where subsidence is slow but low-lying
barrier islands are heavily developed, see minor floods regu-larly.
Along the Gulf Coast, in contrast, tidal flooding is infre-quent
today despite exposure to storm surge from tropical
storms and hurricanes.
BOX 1.
High Tides Make the
Impact of Foul Weather
Worse
When tidal flooding combines with heavy rain, strong
wind, or storms, the result is more severe coastal impacts.
Hurricane Sandy provided ample evidence of this. Its
winds and storm surge battered New York and New
Jersey through a high-tide cycle, leaving widespread
destruction in its wake. By the time the storm reached
Boston it was less intense, and the tide was also low, so
damage was minimal. Communities farther south were
not as lucky.
Winds below nor’easter or hurricane strength can
also drive water ashore. At high tide, this effect can be
amplified and lead to coastal flooding. In some coastal
communities, heavy rainfall and runoff at high tide
can create extensive flooding—partly because high sea
levels impede gravity-driven drainage of stormwater. In
places such as Charleston, SC, rainwater backs up into
the streets from storm drains because high tide slows
its discharge into the harbor. Many factors are at play
during a wind, rain, or storm event, but the level of the
tide when severe weather strikes makes an enormous
difference in the damage wrought on coastal areas.
Though spring and king
tides are responsible
for most of today’s tidal
flooding, sea level rise is
expected to cause flood
conditions during an
increasing number of
normal high tides, and
to make flooding during
extreme high tides more
2 While storm surge poses a critical risk to coastal communities, we do not ex- extensive.
plore it in this report. Useful sources of information on that topic include NOAA’s
Digital Coast website (www.csc.noaa.gov/digitalcoast/) and the Climate Central
Surging Seas Risk Finder (http://sealevel.climatecentral.org/).
Encroaching Tides 9
20. Though spring and king tides are responsible for most of
today’s tidal flooding, sea level rise is expected to cause flood
conditions during an increasing number of normal high tides,
and to make flooding during extreme high tides more extensive.
How Rising Seas Are Affecting Tidal Flooding
Global sea level rose roughly eight inches from 1880 to 2009,
with global warming the main driver (Figure 3) (Church
and White 2011; Church et al. 2011). The planet has warmed
by about 1.5°F (0.8°C) since 1880 (Hartmann et al. 2013;
Hansen et al. 2010). And as air temperature rises, so does the
temperature of the oceans, which have absorbed more than
90 percent of human-caused warming since 1955 (Levitus et
al. 2012). As seawater warms, it expands.
This expansion and the shrinking of mountain glaciers
and polar ice sheets are the primary reasons that global
sea level is rising (Cazenave and Llovel 2010; Lombard et al.
2005). And the rate of global sea level rise has nearly doubled
in recent years. In the 25-year period from 1993 to 2008, the
global rate of sea level rise was more than two-thirds higher
than the twentieth-century average (Church and White 2011;
Ablain et al. 2009; Leuliette, Nerem, and Mitchum 2004).
FIGURE 3. Average Global Sea Level Rise
Satellite Altimeter Data
Tide Gauge Data
1880 1900 1920 1940 1960 1980 2000
9
8
7
6
5
4
3
2
1
0
Inches
Year
The expansion of seawater as it warms and the melting of land-based
rise of about eight inches since 1880. Tide gauges have recorded this
rise (in green), and satellite observations since 1993 (in orange)
have confirmed the trend. Global warming is responsible for both
expanding seas and shrinking ice.
SOURCE: CHURCH AND WHITE 2011.
FIGURE 4. Local Sea Level Rise and Tidal Flooding, 1970–2012
ice have been the key drivers of an average global sea level
Sea Level Rise Since 1970 Boston, MA
Norfolk, VA* Atlantic City, NJ Charleston, SC Boston, MA
10
8
6
4
2
0
1970s 1980s 1990s 2000s 2010s
Days with Flood Events
Atlantic City, NJ Charleston, SC
Inches
10
8
6
4
2
0
Norfolk, VA*
1970s 1980s 1990s 2000s 2010s
Days with Flood Events
8
6
4
2
0
1970s 1980s 1990s 2000s 2010s
Days with Flood Events
30
25
20
15
10
5
0
12
10
8
6
4
2
0
1970s 1980s 1990s 2000s 2010s
Days with Flood Events
Sea level has risen by about 3.5 inches globally—but more along the East Coast—since 1970. At Sewells Point, VA, for example, sea level has
risen more than eight inches, and at Boston, about five inches. Rising seas mean that communities up and down the East and Gulf Coasts are
seeing more days with tidal flooding. Charleston, SC, for example, faced just two to three days with tidal flooding a year in the 1970s. The city
now averages 10 or more such days annually.
*Norfolk statistics recorded at the Sewells Point tide gauge.
SOURCES: UCS ANALYSIS; MORALES AND ALSHEIMER 2014; NOAA TIDES AND CURRENTS 2014; NOAA TIDES AND CURRENTS 2013B.
10 union of concerned scientists
23. AL GA
ME
PA
TX
VA
NC
SC
FL
MS
LA
NY
OK
IA
How We Analyzed Tidal Flooding Today,
in 15 Years, and in 30 Years
To analyze how often flooding now occurs at locations along
the East and Gulf Coasts—and the frequency and extent of
flooding these communities can expect, on average, 15 and
30 years from now—we relied on 52 tide gauges from Portland,
ME, to Freeport, TX (Figure 5). We used two criteria to choose
these gauges, maintained by NOAA.
First, the local forecast office of the National Weather
Service in these areas has set thresholds for water levels that
can cause tidal flooding. Second, instances when water levels
actually cross these thresholds correlate well with instances
when the local office issues a coastal flood advisory. This
second criterion indicates that when water reaches the local
threshold, a flooding event that warrants public notification
often follows. Specifically, we only used tide gauges for which
the National Weather Service issued coastal flood advisories
or warnings to local communities at least two of every three
and has made our revenue loss worse. They say they are going
to fix the flooding, but let’s see.”
In older cities and towns such as Charleston, SC, and
Savannah, GA, flooding can significantly harm both historic
districts and the tourism revenue on which they rely, over
both the short and long term. In communities such as
Portland, ME, and Miami, FL, offices and manufacturing,
shipping, and storage facilities sit along the shore. The effects
of flooding on these businesses can have economic impacts
beyond their walls.
Tidal flooding can also damage or destroy infrastructure
such as pumping stations, sewage treatment facilities, and
pipes for diverting stormwater. Many communities built this
infrastructure more than a century ago, when sea level rise
was not a consideration. Miami Beach Commissioner Jonah
Wolfson reports that the city is going to “tackle the immedi-ate
problem” by allocating $400 million for projects such as
adding pump stations to prevent seawater from backing up in
sewers (Veiga 2014). Officials in Norfolk, VA, have identified
at least $1 billion in needed infrastructural improvements to
protect the city from flooding (City of Norfolk n.d.).
Flooding can make transportation on coastal roads risky
or impossible for hours. Sometimes this is a nuisance, requir-ing
the rerouting of traffic. Other times such flooding affects
evacuation routes, as it can on the South Jersey Shore and
the Bolivar Peninsula near Galveston, TX. In some coastal
communities, both public safety and commerce depend on
just one or two access routes, as on the Outer Banks of North
Carolina. In the face of such flooding, communities and states
must not only clear coastal roads but also repair damage from
erosion, undermining, and over wash. As Steve Miller of the
Great Bay National Estuarine Research Reserve observes, “In
many cases, [cities and towns] are going to have to raise the
roads on their existing path. Money is a big question” (Mar-shall
2012).
Salt marshes, sea grass flats, barrier beaches, oyster
reefs, mangroves, swamps, and other ecosystems along our
coasts serve as buffers against flooding (Gedan et al. 2011).
Scientists credit the dune system adjacent to Seaside Park,
NJ, with dampening storm surge and preventing damage to
homes during Hurricane Sandy (ALS 2012). However, rising
sea levels, tidal flooding, and more coastal development
undermine these ecosystems. The results range from obvious
beach erosion to more subtle shifts, such as the gradual
drowning of coastal forests and salt marsh vegetation (Moser
et al. 2014; Craft 2012; Doney et al. 2012; Saha et al. 2011;
Morris et al. 2002).
FIGURE 5. East and Gulf Coast Locations in Our Analysis
We analyzed information recorded by 52 tide gauges from Portland,
ME, to Freeport, TX. This report includes profiles of starred locations.
SOURCE: NOAA TIDES AND CURRENTS 2014.
ND
NE
KS MO
SD
WV
AR
TN
KY
OH
IL IN
MI
WI
MN
CT
RI
NJ
DE
MA
MD
NH
VT
Tide Gauge
Tide Gauge
with
Community
Profile
Encroaching Tides 13
25. BOX 2.
Projecting Future Sea Level Rise
Scientists have developed a range of scenarios for future
sea level rise, based on estimates of growth in heat-trapping
emissions and the responses of oceans and land-based ice.
The latest research—in the Third (2014) National Climate
Assessment—shows with 90 percent certainty that global
sea level will rise between six inches and 6.3 feet above 2012
levels by 2100 (Figure 6) (Walsh et al. 2014; Parris et al. 2012).
And scientists expect sea level to continue rising well beyond
the end of this century—some say for thousands of years, given
the slow response of Earth’s systems and recent evidence of
instability in the West Antarctic Ice Sheet (Joughin, Smith,
and Medley 2014; Rignot et al. 2014; Levermann et al. 2013;
Jevrejeva, Moore, and Grinsted 2012).
The lowest end of this range is a simple extension of
historic sea level rise. That prospect is unlikely, given the
acceleration of sea level rise since the 1990s (Church and
White 2011; Ablain et al. 2009; Leuliette, Nerem, and Mitchum
2004). Three other scenarios—known as intermediate-low,
intermediate-high, and highest—show a more plausible range of
1.5 feet to 6.3 feet of sea level rise above 2012 levels by 2100. The
rate and magnitude of the loss of land-based ice—primarily
the ice sheets of Greenland and Antarctica—account for much
of the difference in the projections (Walsh et al. 2014).
We used the intermediate-high scenario of the Third
National Climate Assessment to project coastal flooding
at 52 tide gauges.6 This scenario projects a global sea level
rise of about five inches above 2012 levels by 2030, and
about 11 inches by 2045. However, local factors such as land
subsidence, groundwater withdrawals, and changes in ocean
circulation will continue to affect local sea level rise. For
instance, the northeastern United States is projected to see
above-average rates of sea level rise because of changes in the
flow of the Gulf Stream in response to global warming (Ezer et
al. 2013; Yin, Schlesinger, and Stouffer 2009).
To account for local variability, we used projections for
local sea level rise developed by the research organization
Climate Central (Climate Central n.d.; Walsh et al. 2014;
Parris et al. 2012; Tebaldi, Strauss, and Zervas 2012). Climate
Central scientists developed these projections by combining
the intermediate-high projection for global sea level rise with
tide gauge observations from 1959 to 2008 (Tebaldi, Strauss,
and Zervas 2012). This analysis reveals that the locations in
The scenario we used
projects a global sea
level rise of about
five inches above 2012
levels by 2030, and
about 11 inches by 2045.
our analysis are projected to see 9 to 20 inches of sea level rise
by 2045. (For details, see the appendix.)
We do not have local projections for all 52 of our loca-tions.
For locations without local projections, we used the
projection from the nearest tide gauge with one. In all these
cases, the projection we used was within 100 miles of the tide
gauge in question.
(For more information and additional results, see
the Supporting Technical Document at www.ucsusa.org/
encroachingtides.)
FIGURE 6. Historical and Projected Sea Level Rise
Observed Sea Level Rise
Highest
Intermediate-High
Intermediate-Low
1880 1910 1940 1970 2000 2030 2060
Year
1880 1900 1920 1940 1960 1980 2000
2100
80
70
60
50
40
30
20
10
0
-10
Global Mean Sea Level
(Inches)
The 2014 National Climate Assessment used several different
assumptions about how oceans and land-based ice will respond
to future warming to project global sea level rise. We based
projections for sea level rise at our 52 locations on the assess-ment’s
intermediate-high scenario.
SOURCES: CLIMATE CENTRAL N.D.; WALSH ET AL. 2014; PARRIS ET AL. 2012.
6 While the underlying analysis looked at all three scenarios for sea level rise, our analysis is based on the mid-range intermediate-high scenario. The
intermediate-low scenario allows experts and decision makers to assess the risk of sea level rise associated primarily with ocean warming. The interme-diate-
low scenario assumes limited loss of ice sheets. The intermediate-high scenario assumes ice sheet loss that increases over time, while the highest
scenario assumes rapid loss of ice sheets. Decisions involving an especially low tolerance for risk could consider the latter scenario (Parris et al. 2012).
Encroaching Tides 15
31. FIGURE 9. Expanding Reach of Tidal Flooding: Atlantic City Area and Miami
Current Current
2045
2045
The top maps show the extent of tidal flooding today (turquoise) just south of Atlantic City (left) and in Miami (right). The bottom maps
show the extent of flooding that would be possible from that same high tide in 2045, with a higher sea level. By then, these cities can expect to
average 240 and 230 minor floods, respectively, each year.
Note: These maps are for discussion and research purposes only. They are not appropriate for detailed analysis.
SOURCES: OUR ANALYSIS; MAP BASED ON DATA FROM NOAA DIGITAL COAST 2014; OPENSTREETMAP 2014; U.S. CENSUS BUREAU 2013.
Encroaching Tides 21
33. FIGURE 11. The Growing Frequency and Spread of Tidal Flooding
Current
IL IN
MI
TN
KY
OH
AL GA
ME
PA
IA
MN
KS MO
TX
VA
NC
WV
SC
FL
MS
AR
WI
LA
NY
OK
ND
SD
NE
CT
MA
RI
NJ
DE
MD
NH
VT
2030
IL IN
MI
TN
KY
OH
AL GA
ME
PA
IA
MN
KS MO
TX
VA
NC
WV
SC
FL
MS
AR
WI
LA
NY
OK
ND
SD
NE
CT
MA
RI
NJ
DE
MD
NH
VT
Events per Year
2045
IL IN
MI
TN
KY
OH
AL GA
ME
PA
IA
MN
KS MO
TX
VA
NC
WV
SC
FL
MS
AR
WI
LA
10
50
100
200
300
400
NY
OK
ND
SD
NE
CT
MA
RI
NJ
DE
MD
NH
VT
Relatively few of the 52 locations we analyzed on the East and Gulf Coasts now face minor or moderate tidal flooding on a regular basis (top;
circle size represents the number of flood events). But by 2045, sea level rise will bring more tidal floods to nearly every location. Nearly
70 percent of these communities can expect tidal floods to at least triple in frequency by 2030 (bottom left). Charleston, SC, Reedy Point, DE,
and Sandy Hook, NJ, could average more than 75 tidal floods per year by 2030, while Cape May, NJ, Wilmington, NC, and Annapolis, MD,
could average more than 120.
By 2045, many communities can expect a 10-fold increase in the frequency of tidal floods (bottom right). Cambridge, MD, Atlantic City, NJ,
and Washington, DC, could average more than 240 per year by 2045. Only five of our locations would average fewer than five a year: Woods
Hole, MA, Quonset Point, RI, and Panama City, Apalachicola, and St. Petersburg, FL.
Encroaching Tides 23
36. .
The Gulf Coast: Sinking Shores Meet Rising Seas (continued)
ability to protect the coastline from some floods (Moser et al.
2014; NRC 2012).
Tidal Flooding Today
Because of its exposure to hurricanes and tropical storms, the
Gulf Coast is no stranger to major coastal flooding. Still, as
noted, the region rarely sees coastal flooding except for that
driven by winds or storms. Only one of the 10 Gulf Coast sites
we examined—Bay Waveland Yacht Club, MS—experiences
tidal flooding more than once a year.
Natural and human-induced processes play roles in this
gap. Gravitational forces, combined with the shape of the Gulf
of Mexico and its limited connection to the open Atlantic
Ocean, mean that many places along the Gulf Coast see just
one high tide and one low tide per day, rather than the two
that are common along most of the East and West Coasts. That
means they are exposed to potential tidal flooding just once
daily. And the difference between high and low tide is usually
smaller on the Gulf Coast than along much of the East Coast
(Flick, Murray, and Ewing 1999).
Low-lying topography and exposure to tropical storms
have prompted states and communities to build hard defenses
along stretches of Gulf coastlines, which help limit flooding,
including tidal flooding. A levee along the coast of Jefferson
County, TX, for example, protects the Port Arthur area from
storms, and a 10-mile-long seawall protects the coast near
Galveston, TX (Rappleye 2008).
While tidal flooding is now relatively rare along the
Gulf Coast, it can have a significant impact when it does
occur. Along the upper Texas coast, tides running 1.5 to 2 feet
above normal have caused waterfront roads and highways
to close, particularly on the Bolivar Peninsula, shutting off
access (Reilly and Kyle 2014). And on South Padre Island in
southern Texas, minor coastal flooding prevents access to
beaches and can damage cars parked near beach access points
(Goldsmith 2014).
The future risks of tidal flooding along the Gulf Coast will
vary, because local rates of sea level rise differ substantially
between the Gulf’s eastern and western halves. Local sea level
has risen much more quickly along the western half of the Gulf
than the eastern half, because land in the west is sinking faster.
That means sea levels may rise 15 to 19 inches along
Louisiana and parts of Texas by 2045—versus 9 to 11 inches
The Gulf region is home to important ports such as the Port of South
Louisiana. Fuel production and shipping, which require safe highways, are
also major industries in the region. Rising seas and coastal floods that push
farther inland are putting critical infrastructure that serves both the region
and the nation—such as Highway 1 in Louisiana—at risk.
along the Gulf Coast of Florida and Mississippi (Climate
Central n.d.; Parris et al. 2012; Tebaldi, Strauss, and Zervas
2012). St. Petersburg and Clearwater Beach, FL, are projected
to face just under one foot of sea level rise by 2045—on par
with what is expected globally (Climate Central n.d.; Tebaldi
et al. 2012).
Because the western half of the Gulf is projected to see a
substantial rise in sea level in the next 30 years, communities
there—such as Freeport, Rockport, and Port Arthur, TX (at
Sabine Pass)—are expected to face dramatic increases in the
frequency of tidal flooding. These changes could impact the
economic boom now under way in Sabine Pass and nearby
Port Arthur, where companies are building large-scale energy
processing facilities (Kozelichki 2012).
Texas is largely unprepared for these challenges (Texas
Sea Grant 2013). Other Gulf Coast states and their local part-ners
have made some effort to plan for sea level rise—mainly
in response to Hurricane Katrina, and to reduce risks to the
energy industry.9 Although much of this work focuses on
minimizing the impact of storm surge, communities such as
Biloxi, MS, now require developers to construct new buildings
at least one foot above the base flood elevation (City of Biloxi
2014). More stakeholders in the Gulf region, especially the
western half, need to plan for the lower-risk, high-probability
tidal flooding that may chronically affect their communities in
the next 30 years.
9 A recent study commissioned by Entergy, an energy company that serves 2.8 million customers, and America’s Wetlands Foundation developed a
framework for quantifying the risks climate change poses to the Gulf Coast, as a starting point for making the energy sector more resilient (Entergy and
America’s Wetland Foundation 2010). A comprehensive study of transportation infrastructure in the Gulf region similarly identified vulnerabilities to sea
level rise, and suggested integrating climate change into transportation planning (USCCSP 2008).
Caitlyn Kennedy/NOAA Climate.gov
26 union of concerned scientists
37. [ Community Profiles ]
On the Front Line of Tidal Flooding
Today the popular City Dock—a central meeting place
along the waterfront—sees flooding around 50 times a year
during high tides. During such flood events, seawater can
move into downtown areas and surrounding neighborhoods,
and push water out of storm drains and onto surrounding
streets, even on fine sunny days with no wind or storms.
During “spring tides”—the highest tides of the month,
when the influence of the moon and sun is greatest—areas
around the U.S. Naval Academy, the Market House, Com-promise
Street, and the Eastport neighborhood can become
awash with seawater. In December 2012, for example, an
extreme high tide combined with a southeasterly wind that
prevented the bay from draining left residents knee-high in
water (Prudente 2013). Streets were closed, as was the East-port
Bridge, and businesses on Dock Street were inundated.
Parking lots were submerged and restaurant and store owners
were forced to close their premises. Flip Walters, the city’s
director of public works, said the flooding was more substan-tial
than during Hurricane Sandy, and advised drivers against
forcing their way through floodwaters and spraying their
brakes with highly corrosive saltwater (Staver 2012).
Sea level at Annapolis has risen by more than a foot over
the last century—more than twice the global average (NOAA
2012a). Just since 1990, sea level has risen by three inches,
and the number of minor floods has more than doubled
(Nelson, Wilson, and McNeill 2014; Sweet et al. 2014). Flood-ing
from high tides has become so common that residents of
some neighborhoods feel anxious about flooding, even when
the weather is fine (Skaggs 2014).
Annapolis is also familiar with severe flooding associated
with major storms. In 2006, for example, a five-foot storm
Annapolis, MD
Home of the U.S. Naval Academy, Annapolis is coping with seas
that are rising faster than the global average.
The low-lying city of Annapolis is well-acquainted with
coastal flooding, as it faces regular disruptions to downtown
streets and parking. A more than fourfold increase in tidal
flooding since 1970 has made Annapolis among today’s most
frequently flooded East Coast cities.
With a population of 40,000, this picturesque city lies on
Chesapeake Bay, at the mouth of the Severn River, and is part
of the Baltimore-Washington metropolitan area. This historic
state capital was briefly the nation’s capital after the Amer-ican
Revolution. Many preindustrial colonial buildings still
stand, harkening back to the days when the city was a hub for
the transport of tobacco, iron, and grain.
SOURCES: MAP BASED ON DATA FROM OPENSTREET-MAP
2014; USGS 2014; U.S. CENSUS BUREAU 2013. 27 Encroaching Tides
40. spending hundreds of millions of dollars on a drainage
improvement project for Market Street, to cope with flooding
from rain during a high tide (City of Charleston 2013). Very
costly pumping stations will channel excess rainwater into
the ocean—although they will become less effective as tides
rise higher.
The city is also installing a multimillion-dollar seawall
off the tip of the peninsula (City of Charleston n.d.). However,
seawalls are effective only if they prevent tides from filtering
up through the ground, and can compound problems when
they prevent rainwater from draining out. Ultimately, the city
will need more creative solutions.
Jamaica Bay, NY
Working-class communities along an urban coast contend with
the impacts of rapid increases in tidal flooding on daily life.
Spanning the shoreline of the populous boroughs of Queens
and Brooklyn in New York, Jamaica Bay’s salt marshes
provide habitat for fish and birdlife amid one of the world’s
largest cities. The narrow Rockaway Inlet, which links the
bay to the Atlantic Ocean, funnels tides and storm surges into
the bay with some force.
Hurricane Sandy had a devastating effect on communities
along the bay, including the Rockaways, Howard Beach, Broad
Channel, Sheepshead Bay, and Mill Basin, causing major
flooding (City of New York 2013a; Bloch et al. 2012). Rebuilding
continues, but scars on the landscape may be visible for years
to come. Though a far gentler force, regular high tides also
pose flooding problems for residents of these same belea-guered
areas, because of their low elevation and rising seas.
Jamaica Bay is part of the Gateway National Recreation
Area, a unique natural environment within a highly urban-ized
setting, an important waypoint for migratory birds, and a
place of significant historic and cultural heritage. This is the
only wildlife refuge in the country accessible by subway. But
dredging, shoreline bulkheads (barriers), sea level rise, and
sewage runoff have led to major erosion of the bay’s marshes
and islands (Swanson and Wilson 2008; CSOTP 2007; Hartig
et al. 2002).
The area once had rich shellfisheries, and the Rockaways
were a popular summer resort destination. Today, mostly
working-class neighborhoods enjoy spectacular water views,
but must contend with frequently flooded streets and side-walks
during high tides and heavy rainfall, and worse impacts
during larger storms.
Because drainage infrastructure is aging, flooding today
sometimes causes combined sewage and stormwater to over-flow
into streets. Standing water provides a breeding spot for
During extreme high tides, some Charleston streets tend to flood, creating
hazards for pedestrians and drivers. As part of its King Tide and Storm Witness
initiatives, the South Carolina Department of Health and Environmental Control
encourages the public to upload photos to a database used to assess vulnerability
and plan for long-term resilience.
NOAA Digital Coast
SOURCES: MAP BASED ON DATA FROM OPENSTREET-MAP
2014; USGS 2014; U.S. CENSUS BUREAU 2013.
30 union of concerned scientists