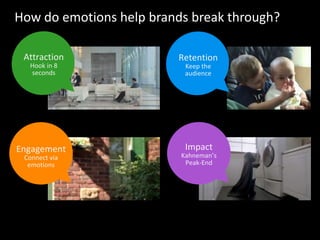
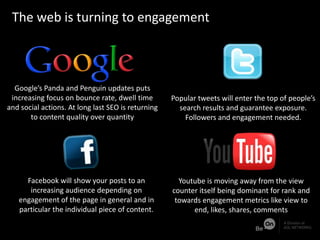
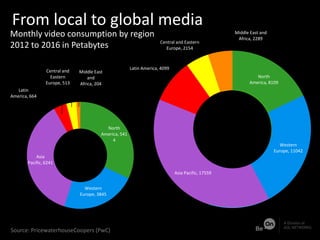
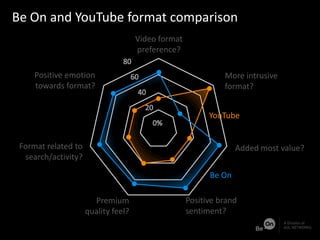
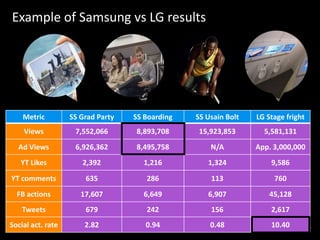
From viral to video everywhere
2005 Luca Bruno, 2013 Michael Sohn - AP
20,000
unique videos
since 2005
2005 2013
Create
Syndicate
Measure
Content
Consumption Connection
Choice
Why emotive?
• Content
2005 2013
5
4
3
2
2009
Global digital content created and shared
Source: KPCB, YouTube
YouTube hours of video uploaded per minute
100
75
50
25
ZB Hrs
100 hrs
of video uploaded
to YouTube each
minute
8 ZB
of data per year
will be created
by 2015
• Content
< 100 > 1m
YouTube videos by number of views
Source: Business Insider, Businessweek
%
30
20
10
29.6%
11.4%
0.3%
1k – 2.5k 10k – 100k
2.7%
0.0001%
probability user
will view your
content
• Choice
2000 2012
1,000
800
600
400
200
2008
Global internet connected device shipments
Source: BI intelligence, Microsoft
Units
(millions)
2004
Smart
phones
Tablets
Personal
computers
Wearables
47%
multi-task on
multiple
screens
• Choice
Share of device page traffic on a typical work day
Mobiles
brighten the
commute
PCs dominate
working hours
Tablets popular
at night
Source: comScore, Ericsson
60%
of consumers
watch video
on-demand
weekly
• Consumption
Source: Ericsson
• Consumption
#
##
Source: Ericsson, KPCB, Microsoft
150
times per day
a user checks
their smart
phone
1.6bn
Mobile
broadband
connections
(43% y/y)
75%
higher engagement
amongst users who
choose to watch
video content
9.26%
of adverts are
ad-blocked
Choice
vs
Interruption
• Connection
Native
vs
Pre-roll
82%
Higher brand lift
generated by
native ads,
compared to
pre-roll
• Connection
Brand
Consumer
The unwritten contract is breaking
Agencies
Publishers
Distributors
Consumer
Agencies
Distributors
Ad Exchanges/
Networks
The new landscape
Publisher
Advertiser
Publisher
Advertiser
Social Connections
Brand
Choice over interruption
Video format
preference?
Premium quality feel?
More intrusive
format?
Positive brand
sentiment?
Added most value?
Pre-roll
Positive emotion
towards format?
Format related to
search/activity?
Native
Source: Be On internal research
CREATE
Rational
Logical
Analytical
Fact-based
Reasoning
Emotional
Instinctive
Sense-based
Desire
The Gunn Report
SOM growth
ESOV
Source: Gunn Report, IPA
Efficiency advantage of creatively-awarded campaigns
Creatively awarded
Non-creatively awarded
11x
Correlation
1800s
Darwin
The Expression
of Emotions in
Man and
Animals
1960s
!
Ekman
Facial Action
Coding System
(FACS)
2010s1800s 1960s
Coding
Automated
Facial
Coding
Emotions
15” to 5’
content length
20+
categories
EmotionAll
1,000+
videos tested
30+
countries
Engagement
Connect via
emotions
Attraction
Hook in 8
seconds
Retention
Keep the
audience
Impact
Kahneman’s
Peak-End
How do emotions help brands break through?
EmotionAll
So Real It’s Scary 2
This video has very good
overall performance.
Better than 95% of videos.
Exceptional vs Standard
54,440
YouTube views
5
Tweets
8
Facebook shares
57,659,141
YouTube views
101,572
Tweets
1,367,366
Facebook shares
9
4
80
70
60
50
40
30
20
%happiness
Ad duration
The strongest video we have seen so far?
What’s the best video we have ever tested?
Consumers love emotional content...
3xhigher average
view to end %
8xhigher click
through rate
20xbetter in
converting views
into social
actions
100xQuicker in
attracting
viewers
Source: Be On research
SYNDICATE
The web is returning from scale to engagement
Google’s Panda and Penguin updates puts
increasing focus on bounce rate, dwell time
and social actions. At long last SEO is returning
to content quality over quantity
Facebook will show your posts to an
increasing audience depending on
engagement of the page in general and in
particular the individual piece of content.
Popular tweets will enter the top of people’s
search results and guarantee exposure.
Followers and engagement needed.
Youtube is moving away from the view
counter itself being dominant for rank and
towards engagement metrics like view to
end, likes, shares, comments
The web is turning to engagement
From local to global media
Source: PricewaterhouseCoopers (PwC)
Monthly video consumption by region
2012 to 2016 in Petabytes
North
America, 541
4
Western
Europe, 3845
Asia
Pacific, 6241
Latin
America, 664
Central and
Eastern
Europe, 513
Middle East
and
Africa, 204
2012
16,881
WORLD TOTAL
2016
45,252WORLD TOTAL
North
America, 8109
Western
Europe, 11042
Asia Pacific, 17559
Latin America, 4099
Central and Eastern
Europe, 2154
Middle East and
Africa, 2289
Be On and YouTube format comparison
Video format
preference?
Premium
quality feel?
More intrusive
format?
Positive brand
sentiment?
Added most value?
YouTube
Positive emotion
towards format?
Format related to
search/activity?
Be On
Example of Samsung vs LG results
Metric SS Grad Party SS Boarding SS Usain Bolt LG Stage fright
Views 7,552,066 8,893,708 15,923,853 5,581,131
Ad Views 6,926,362 8,495,758 N/A App. 3,000,000
YT Likes 2,392 1,216 1,324 9,586
YT comments 635 286 113 760
FB actions 17,607 6,649 6,907 45,128
Tweets 679 242 156 2,617
Social act. rate 2.82 0.94 0.48 10.40
Animated
start screen
Age gate
Branded
player
End play
terminal
Product
feed
Social feed
Interactive
video
Soundboard
How the player helps
About 30% of all goviral partners
publish on multiple platforms:
+8,000 Twitter Accounts
+7,800 Facebook Pages
+50,000 mid and long tail
sites and platforms from
Last.Fm and Wordpress to
small vertical sites and blogs
Vertical
Experts
Editorial
Network
Reach
How video is syndicated
Social Media
Outreach
In content syndication across
premium publishers across
International and local
publishers
Drive additional reach by
broadening out targeting to
relevant environments
across identified sites where
your audience are with
multiscreen coverage
MEASURE
Welcome to Insights
Performance
Impressions
Views
% Delivery
Actions
CTR
Interactions
Sharing
Viewing
Avg session (sec)
% complete/PTE
Feedback
Impact
Demographics
Uplift
Geography
Insights overview
Brand Lift Measurement Competitor Benchmarking Audience Visibility
Engagement Analysis Emotive Impact FeedbackSocial Buzz Monitoring
Emotion
Attraction
Retention
Engagement
Impact
Engagement
Syndication
Choice
Sharing
Effect
Brand Favorability
Purchase intent
Brand awareness
+ =
Creation Syndication Measurement
Introducing the
Short Video Impact Model (SVIM)

Be On - june, final deck

Editor's Notes

  • #11 Users, who choose to watch are 75% more engaged to the content compared to standard ads http://thenextweb.com/socialmedia/2011/06/12/only-30-of-youtube-users-skip-pre-roll-ads/ 15,000,000 Ad Block users on Chrome alone https://chrome.google.com/webstore/detail/adblock/gighmmpiobklfepjocnamgkkbiglidom?utm_source=chrome-ntp-icon On average 9.26% of impressions are ad-blocked, May 2012 http://clarityray.com/Content/ClarityRay_AdBlockReport.pdf
  • #12 Remember the last award winning pre-roll?82% brand lift compared to pre-rollNielsen ‘Comparing Resonance for Native and Pre-roll Video Ads with Real-time Metrics ‘, March 2013
  • #27 Point:1. Standard doesn’t work2. Even modest emotional differences make exponential difference in breaking through
  • #29 Emotionally stronger ads get3x higher average view to end %8x higher click through rate20x better in converting views into social actions100x quicker in attracting viewers.Source: Be On and Realeyes research based on 400 videos study, 2013
  • #35 … or Custom, in which we provide full access to Be On’sin house post production team, who will work with you to create bespoke enrichments to your content either within the player ...
  • #37 Viewership is splintering across the web and across devices. Our dedicated programming team makes sure that the right video reaches the right user at the right time.
  • #40 Understand emotions through an Impact Score