Downloaded 131 times
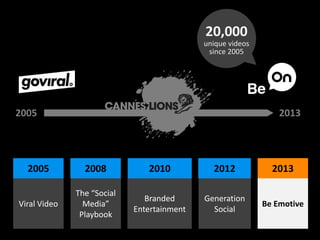
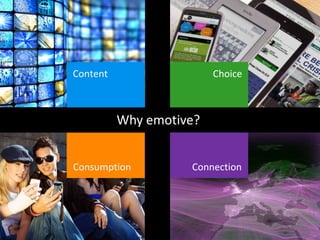
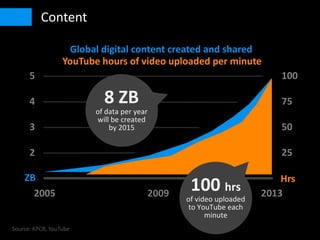

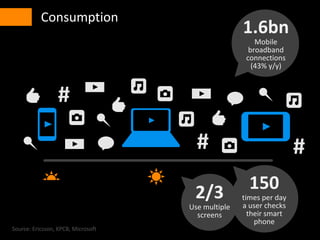
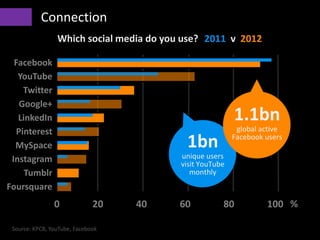
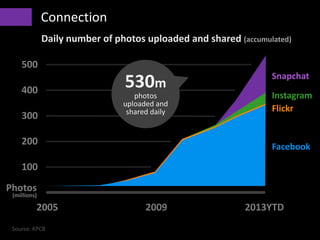

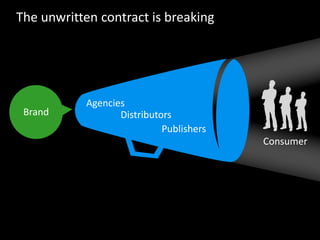


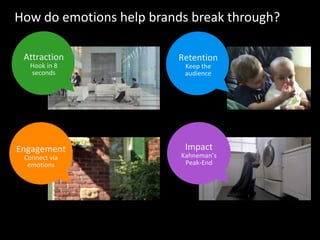

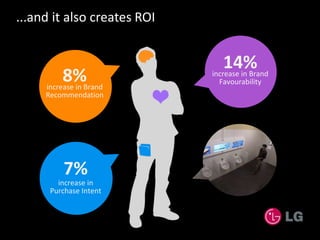

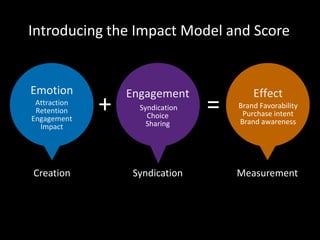

The document discusses the evolution and significance of emotional content in digital video advertising from 2005 to 2013, emphasizing the increase in content consumption and the importance of engaging viewers through emotional connections. It highlights key statistics on video upload rates, consumer behavior across devices, and the effectiveness of emotional appeals in advertising campaigns, which outperform traditional rational approaches. The findings suggest that emotionally resonant content can lead to higher engagement, brand favorability, and overall return on investment for brands.


