Downloaded 11 times


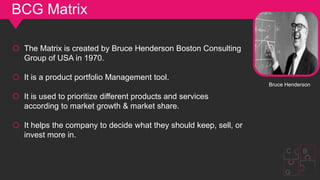
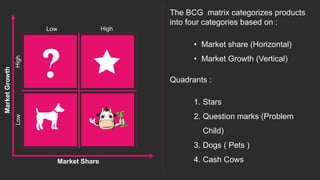
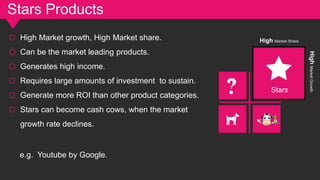
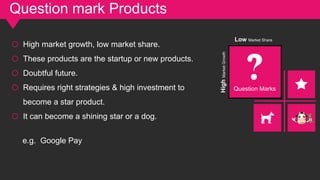
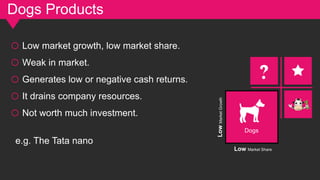
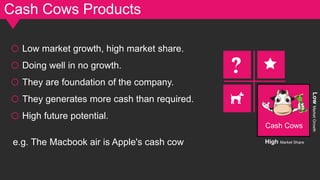
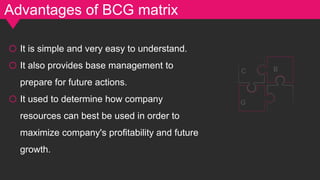


The document discusses the Boston Consulting Group's (BCG) growth-share matrix, a tool for product portfolio management developed in 1970 to categorize products based on market growth and market share into four quadrants: stars, question marks, dogs, and cash cows. It outlines the advantages such as its simplicity and effective resource allocation, along with limitations including potential misclassification and difficulties in defining the market. The document also provides examples from Google and concludes that despite its limitations, the BCG matrix remains a widely used strategic framework.