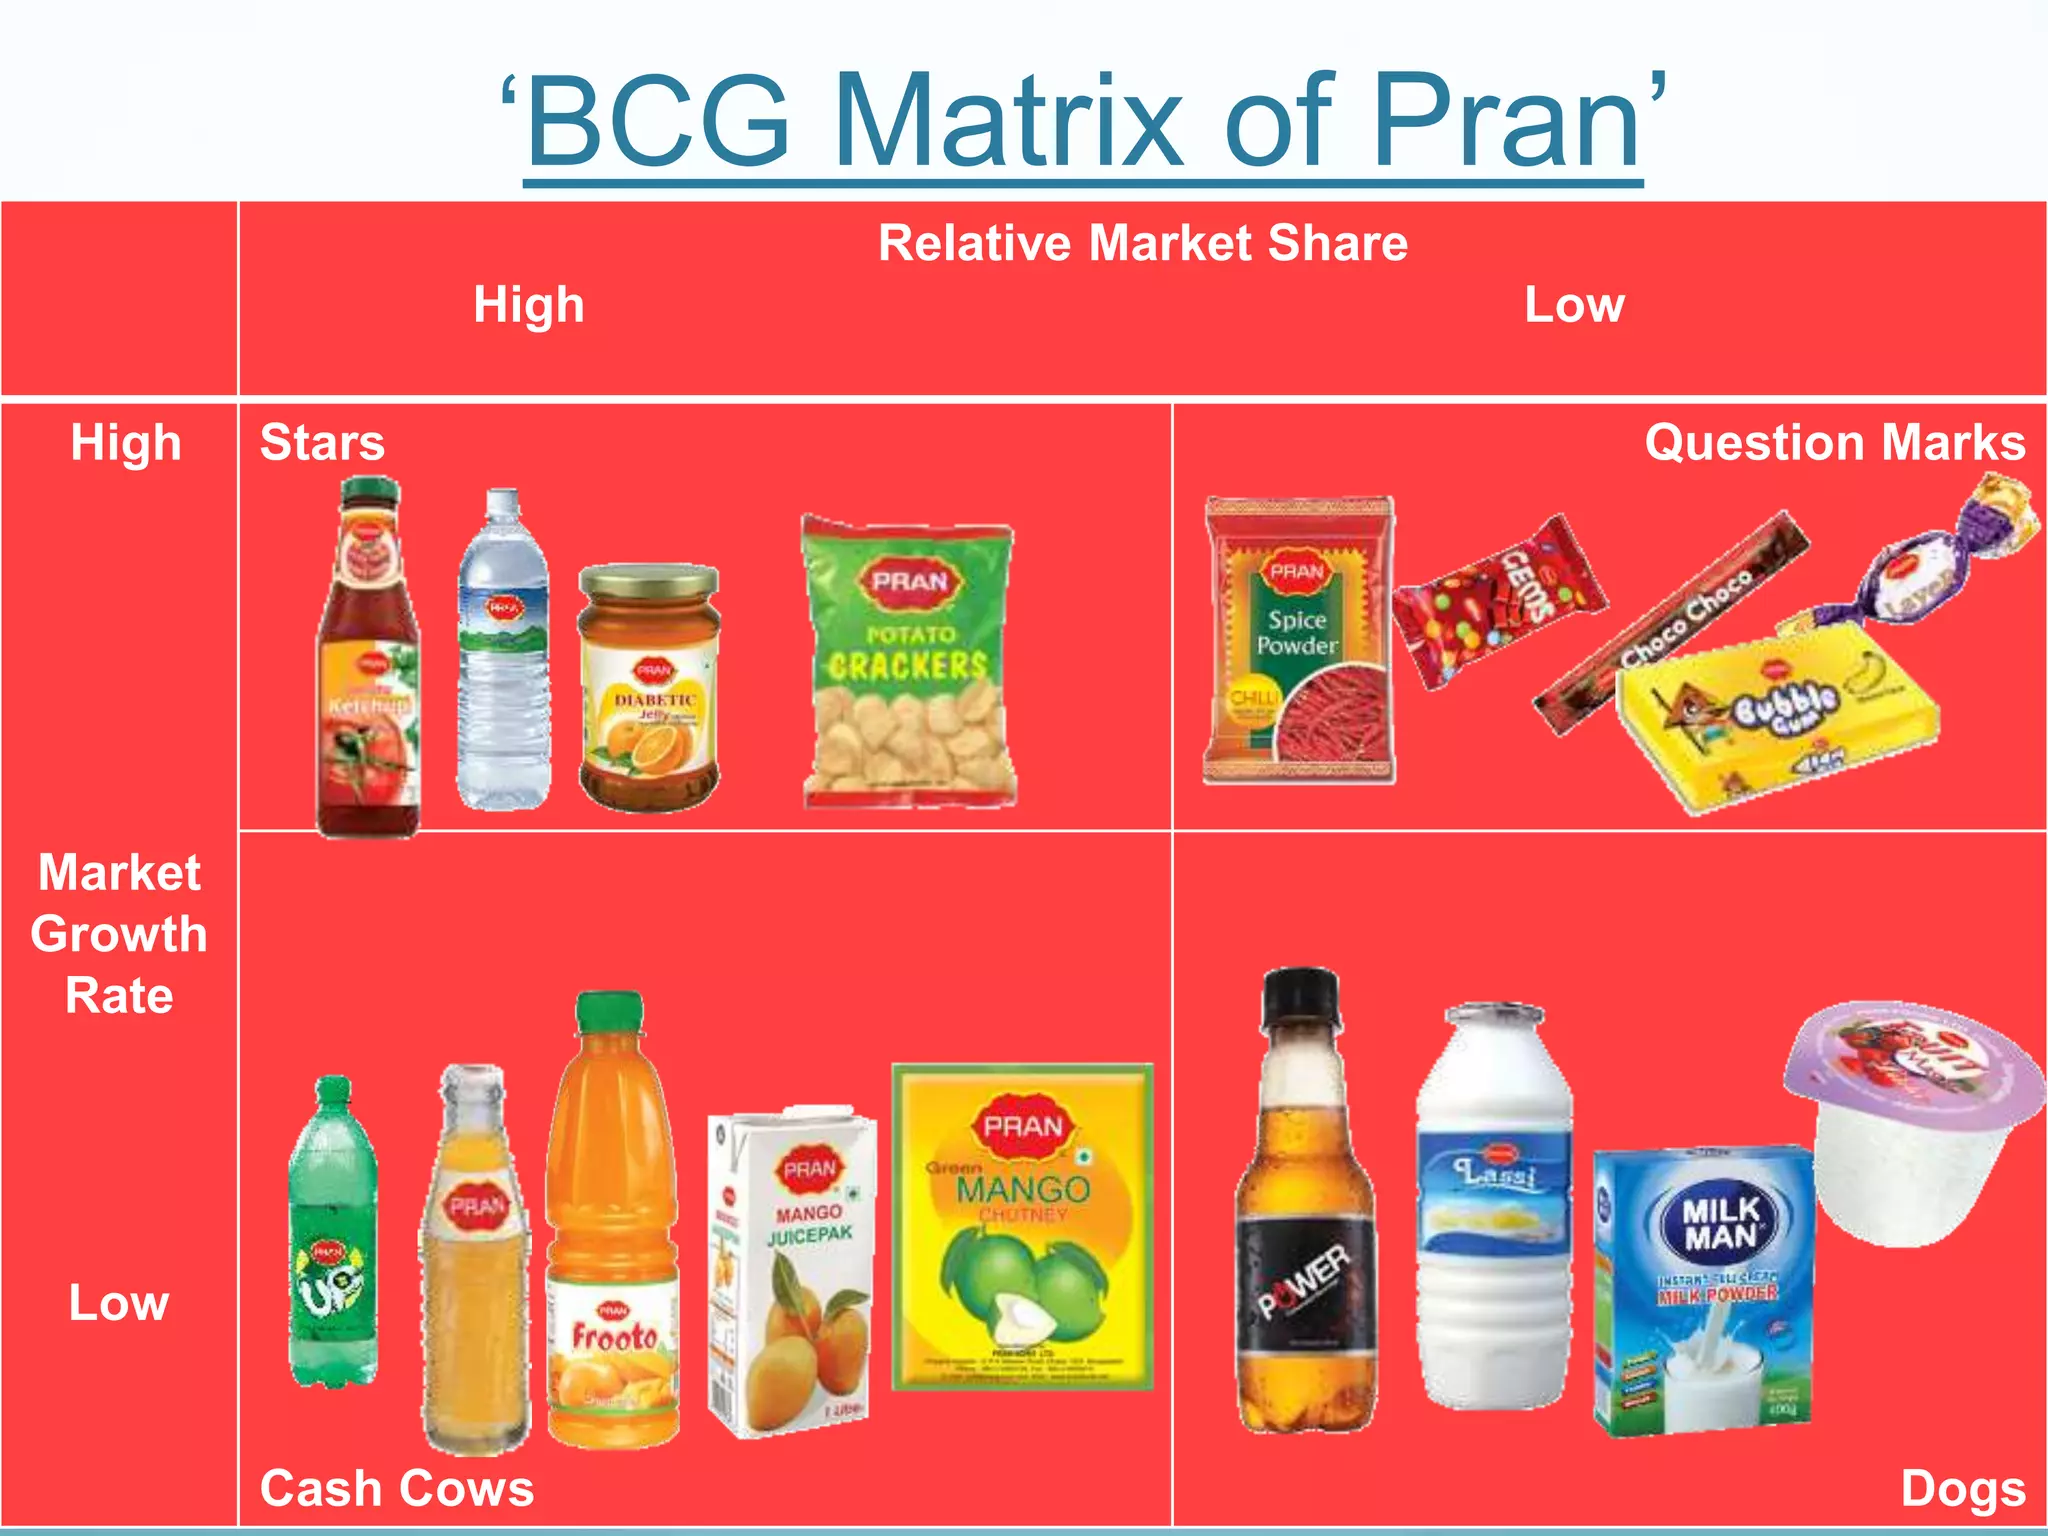
Presentation
on
‘BCG Matrix’
Group members
 Ahmed, Sakib- 14-28178-3
 Aman, Abdulla al- 14-28177-3
 Islam, Wafa- 14-27897-3
 Tahmid, Tanvir- 15-28508-1
 Bushra, Sabah emdad- 14-27248-2
Purpose of using BCG Matrix
 Identify market share and growth rate
 To determine what priorities should be given in the
product portfolio of a business unit
 Helps to understand the position of business
 Competitive market position
 Further investment strategies and guidelines
 Which units to fund and how much
 Established in 1970 (Boston consulting group)
‘BCG Matrix of Pran’
Relative Market Share
High Low
High
Market
Growth
Rate
Low
Stars Question Marks
Cash Cows Dogs
Stars (Katchup)
1. Market growth rate 15%
2. Market share 7.6%
3. Highest export
Question Marks (Spice powder)
1. Market growth rate 11%
2. Market share 0.6%
Cash Cows (Frooto)
‡1. 2.26 % growth rate per year.
2. 5.8% market share grow per year.
Dogs (Power drink)
1. PRAN launched it in 2008.
2. Market share is approximately 1%
3. Growth rate is 2tk/ bottle
Market Analysis
 Program for Rural Advancement Nationally
Evaluation of SBUs
Stars:
Profit potential
May need heavy investment to
grow
Cash Cows:
Low growth, high share
‡Established, successful SBUs
‡Produce cash
Question Marks:
High growth, low share
‡Build into Stars or phase out
‡Requires cash to hold market share
Dogs:
‡Low growth & share
‡Low profit potential
Investment Strategy
Differentiation:
When the business concentrates
on acquiring better performance
via an important customer
benefit area valued in a large
part of the market. The firm
seeks for quality assurance and
takes leadership.
Pran Group does not yet follow
the “Differentiation Strategy”,
however, they can do this via
surveys taken buy their
consumers after purchasing a
product of theirs from the many
locations they are sold.
Result: Consumer satisfaction
will cause a growth in sales and
profit.
BCG matrix of pran product

BCG matrix of pran product

  • 1.
  • 2.
    Group members  Ahmed,Sakib- 14-28178-3  Aman, Abdulla al- 14-28177-3  Islam, Wafa- 14-27897-3  Tahmid, Tanvir- 15-28508-1  Bushra, Sabah emdad- 14-27248-2
  • 3.
    Purpose of usingBCG Matrix  Identify market share and growth rate  To determine what priorities should be given in the product portfolio of a business unit  Helps to understand the position of business  Competitive market position  Further investment strategies and guidelines  Which units to fund and how much  Established in 1970 (Boston consulting group)
  • 4.
    ‘BCG Matrix ofPran’ Relative Market Share High Low High Market Growth Rate Low Stars Question Marks Cash Cows Dogs
  • 5.
    Stars (Katchup) 1. Marketgrowth rate 15% 2. Market share 7.6% 3. Highest export Question Marks (Spice powder) 1. Market growth rate 11% 2. Market share 0.6% Cash Cows (Frooto) ‡1. 2.26 % growth rate per year. 2. 5.8% market share grow per year. Dogs (Power drink) 1. PRAN launched it in 2008. 2. Market share is approximately 1% 3. Growth rate is 2tk/ bottle Market Analysis
  • 6.
     Program forRural Advancement Nationally Evaluation of SBUs Stars: Profit potential May need heavy investment to grow Cash Cows: Low growth, high share ‡Established, successful SBUs ‡Produce cash Question Marks: High growth, low share ‡Build into Stars or phase out ‡Requires cash to hold market share Dogs: ‡Low growth & share ‡Low profit potential Investment Strategy Differentiation: When the business concentrates on acquiring better performance via an important customer benefit area valued in a large part of the market. The firm seeks for quality assurance and takes leadership. Pran Group does not yet follow the “Differentiation Strategy”, however, they can do this via surveys taken buy their consumers after purchasing a product of theirs from the many locations they are sold. Result: Consumer satisfaction will cause a growth in sales and profit.