The document contains MATLAB scripts for simulating different digital modulation schemes:
1) A binary amplitude-shift keying (ASK) script that generates a random bit stream and maps 0s and 1s to different amplitude levels to create a modulated signal.
2) A binary frequency-shift keying (FSK) script that maps 0s and 1s to different frequency tones and sums the tones to create the modulated signal.
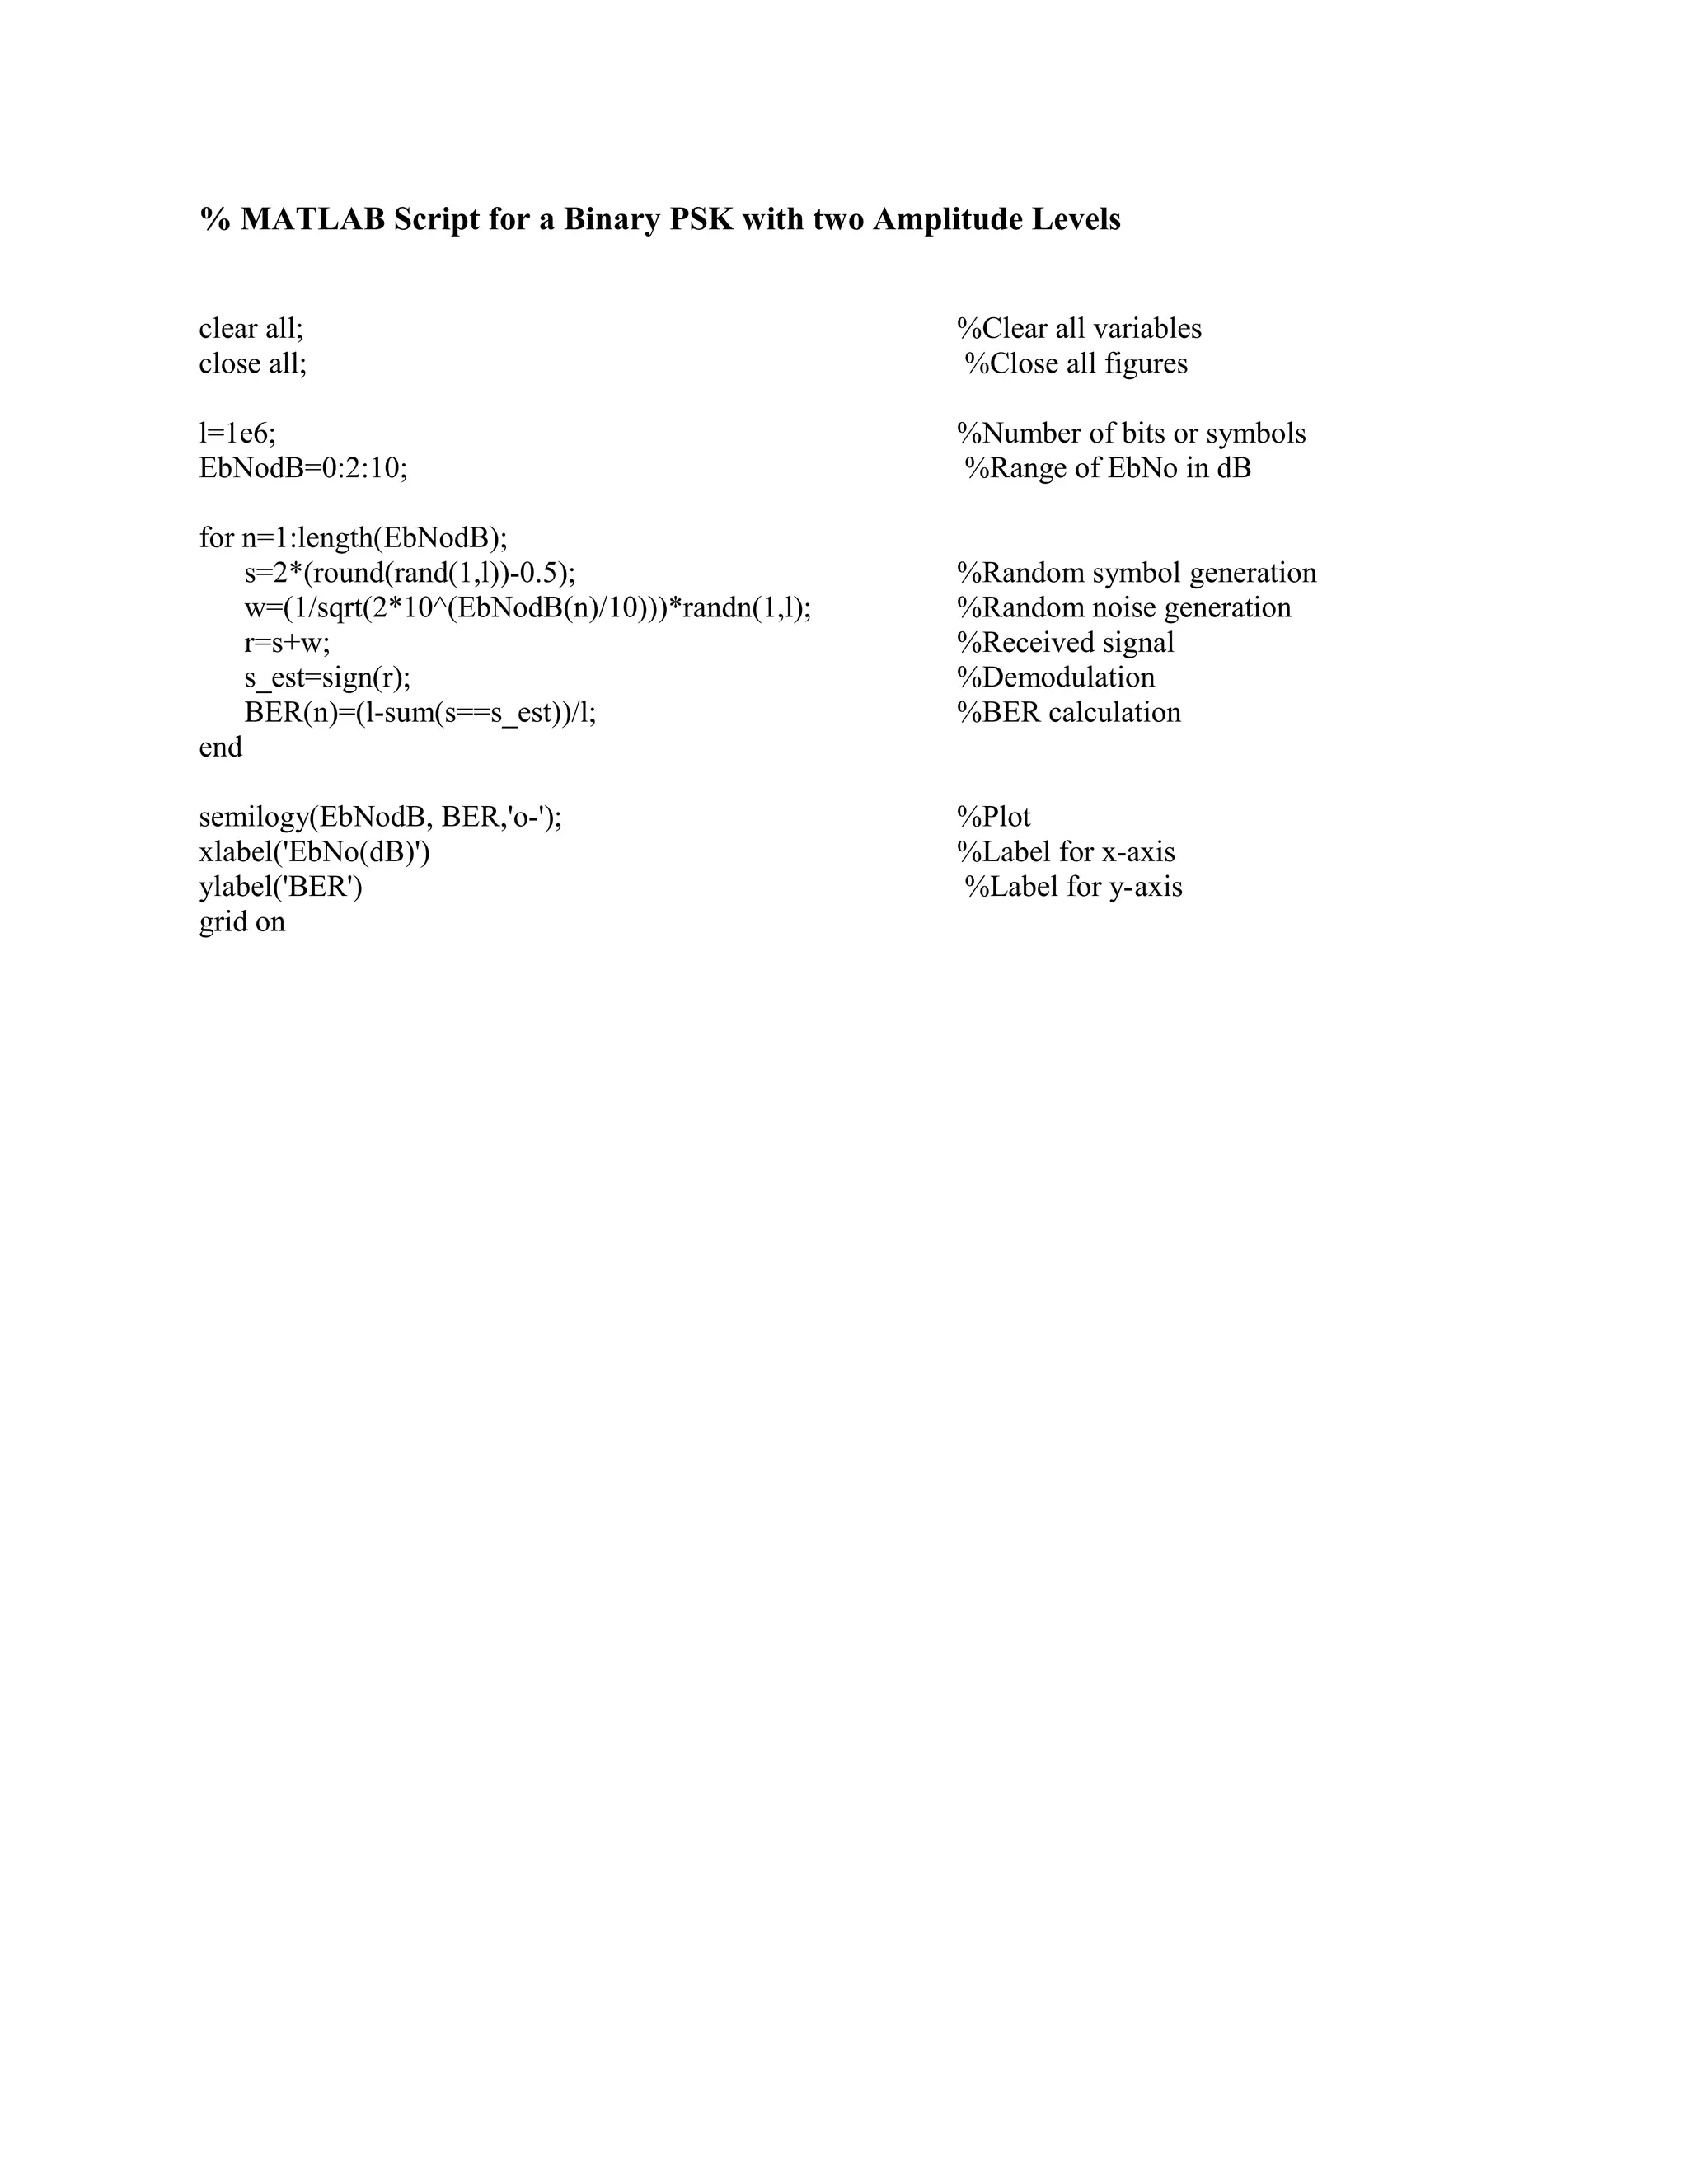
3) A binary phase-shift keying (PSK) script that maps 0s and 1s to different phase shifts, adds noise, and calculates the bit error rate for varying signal-to-noise ratios.
![% MATLAB Script for a Binary ASK with two Amplitude Levels
format long;
% Clear all variables and close all figures
clear all;
close all;
% The number of bits to send - Frame Length
N = 8;
% Generate a random bit stream
bit_stream = round(rand(1,N));
% Enter the two Amplitudes
% Amplitude for 0 bit
A1 = 3;
% Amplitude for 1 bit
A2 = 5;
% Frequency of Modulating Signal
f = 3;
% Sampling rate - This will define the resoultion
fs = 100;
% Time for one bit
t = 0: 1/fs : 1;
% This time variable is just for plot
time = [];
ASK_signal = [];
Digital_signal = [];
for ii = 1: 1: length(bit_stream)
% The FSK Signal
ASK_signal = [ASK_signal (bit_stream(ii)==0)*A1*sin(2*pi*f*t)+...
(bit_stream(ii)==1)*A2*sin(2*pi*f*t)];
% The Original Digital Signal
Digital_signal = [Digital_signal (bit_stream(ii)==0)*...](https://image.slidesharecdn.com/1-baskbfskbpsk-141028010735-conversion-gate02/75/bask-bfsk-bpsk-1-2048.jpg)
![zeros(1,length(t)) + (bit_stream(ii)==1)*ones(1,length(t))];
time = [time t];
t = t + 1;
end
% Plot the ASK Signal
subplot(2,1,1);
plot(time,ASK_signal,'LineWidth',2);
xlabel('Time (bit period)');
ylabel('Amplitude');
title('ASK Signal with two Amplitudes');
%axis([0 time(end) 1.5 1.5]);
grid on;
% Plot the Original Digital Signal
subplot(2,1,2);
plot(time,Digital_signal,'r','LineWidth',2);
xlabel('Time (bit period)');
ylabel('Amplitude');
title('Original Digital Signal');
axis([0 time(end) -0.5 1.5]);
grid on;](https://image.slidesharecdn.com/1-baskbfskbpsk-141028010735-conversion-gate02/75/bask-bfsk-bpsk-2-2048.jpg)
![% MATLAB Script for a Binary FSK with two Amplitude Levels
clear;
clc;
b = input('Enter the Bit stream n ');
%b = [0 1 0 1 1 1 0];
n = length(b);
t = 0:.01:n;
x = 1:1:(n+1)*100;
for i = 1:n
if (b(i) == 0)
b_p(i) = -1;
else
b_p(i) = 1;
end
for j = i:.1:i+1
bw(x(i*100:(i+1)*100)) = b_p(i);
end
end
bw = bw(100:end);
wo = 2*(2*pi*t);
W = 1*(2*pi*t);
sinHt = sin(wo+W);
sinLt = sin(wo-W);
st = sin(wo+(bw).*W);
subplot(4,1,1)
plot(t,bw)
grid on ; axis([0 n -2 +2])
subplot(4,1,2)
plot(t,sinHt)
grid on ; axis([0 n -2 +2])
subplot(4,1,3)
plot(t,sinLt)
grid on ; axis([0 n -2 +2])
subplot(4,1,4)
plot(t,st)
grid on ; axis([0 n -2 +2])
Fs=1;
figure
%pburg(st,10)
periodogram(st)](https://image.slidesharecdn.com/1-baskbfskbpsk-141028010735-conversion-gate02/75/bask-bfsk-bpsk-3-2048.jpg)