Downloaded 23 times


![3
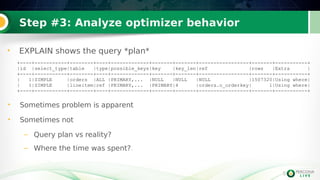
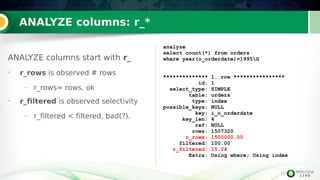
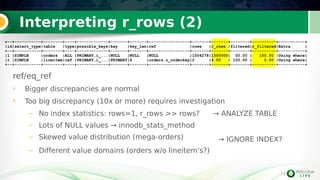
Step #1: Find badly-performing queries
Ways to find slow queries
• Slow query log
• PERFORMANCE_SCHEMA
• tcpdump + pt_query_digest
• (logs from your app)
3
# User@Host: root[root] @ localhost []
# Thread_id: 3 Schema: dbt3sf1 QC_hit: No
# Query_time: 7.891693 Lock_time: 0.000359 Rows_sent: 1 Rows_examined: 1500000
# Rows_affected: 0
# Full_scan: Yes Full_join: No Tmp_table: No Tmp_table_on_disk: No
# Filesort: No Filesort_on_disk: No Merge_passes: 0 Priority_queue: No
SET timestamp=1428947722;
select sum(o_totalprice) from orders;](https://image.slidesharecdn.com/analyze-statement-in-mariadb101-150501175901-conversion-gate02/85/ANALYZE-for-executable-statements-a-new-way-to-do-optimizer-troubleshooting-in-MariaDB-10-1-3-320.jpg)
![4
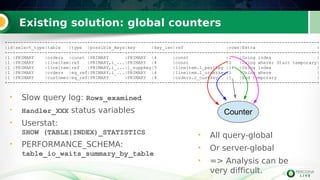
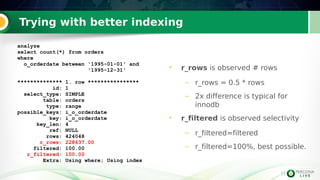
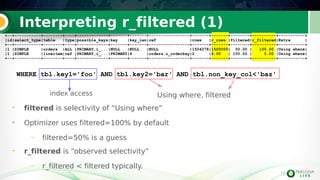
Step #2: Determine the problem is in optimizer
• Slow query log (or P_S) has *some* *clues*
4
# User@Host: root[root] @ localhost []
# Thread_id: 3 Schema: dbt3sf1 QC_hit: No
# Query_time: 7.891693 Lock_time: 0.000359 Rows_sent: 1 Rows_examined: 1500000
# Rows_affected: 0
# Full_scan: Yes Full_join: No Tmp_table: No Tmp_table_on_disk: No
# Filesort: No Filesort_on_disk: No Merge_passes: 0 Priority_queue: No
SET timestamp=1428947722;
select sum(o_totalprice) from orders;
+----------------------+----------+
| Status | Duration |
+----------------------+----------+
...
| Sending data | 7.704266 |
• SHOW PROFILE data (or P_S).
+----------------------+----------+
| Status | Duration |
+----------------------+----------+
...
| Copying to tmp table | 4.002318 |](https://image.slidesharecdn.com/analyze-statement-in-mariadb101-150501175901-conversion-gate02/85/ANALYZE-for-executable-statements-a-new-way-to-do-optimizer-troubleshooting-in-MariaDB-10-1-4-320.jpg)


![19
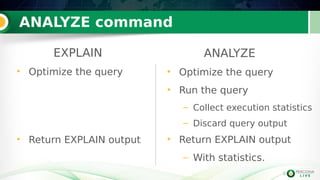
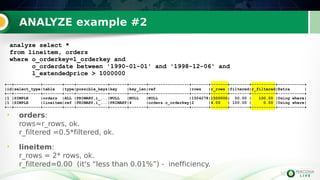
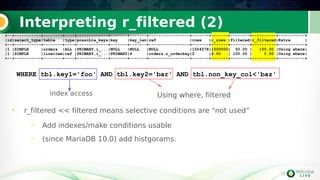
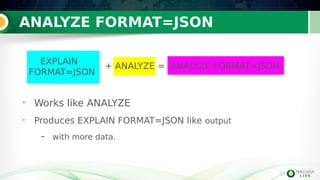
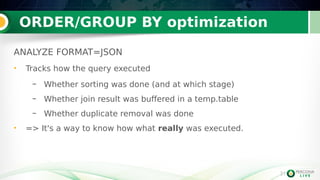
EXPLAIN FORMAT=JSON
MySQL 5.6 introduced EXPLAIN FORMAT=JSON
• Good! It shows more info (http://s.petrunia.net/blog/?p=83)
• But it has bugs
Bug#69567: EXPLAIN FORMAT=JSON lists subquery in optimized_away_subqueries, but it is run
Bug#69795: EXPLAIN FORMAT=JSON doesn't show Using filesort for UNION
Bug#74462: EXPLAIN FORMAT=JSON produces ordering_operation when no ordering takes place
Bug#74661: EXPLAIN FORMAT=JSON says two temptables are used, execution shows just one
Bug#74744: EXPLAIN FORMAT=JSON produces duplicates_removal where there is none
[no bug#]: EXPLAIN FORMAT=JSON shows the same subquery as two different subqueries
…
• And we were not happy with output
– Even MySQL Workbench choked on it (http://s.petrunia.net/blog/?p=93)
– “JSON format” != “print tabular EXPLAIN in JSON”
19
INSERT:EXPLAINFORMAT=JSON](https://image.slidesharecdn.com/analyze-statement-in-mariadb101-150501175901-conversion-gate02/85/ANALYZE-for-executable-statements-a-new-way-to-do-optimizer-troubleshooting-in-MariaDB-10-1-19-320.jpg)

![23
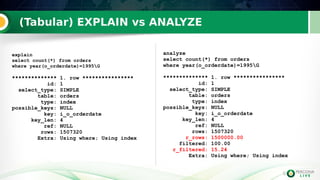
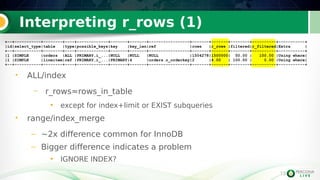
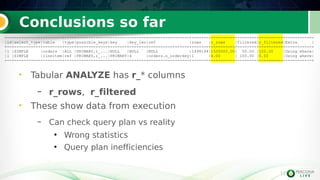
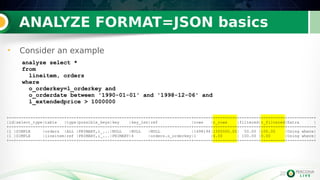
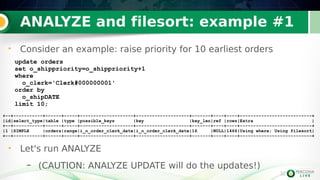
ANALYZE FORMAT=JSON basics
23
{
"query_block": {
"select_id": 1,
"r_loops": 1,
"r_total_time_ms": 191747,
"table": {
"table_name": "orders",
"access_type": "ALL",
"possible_keys": ["PRIMARY", "i_o_orderdate"],
"r_loops": 1,
"rows": 1498194,
"r_rows": 1.5e6,
"r_total_time_ms": 14261,
"filtered": 50,
"r_filtered": 100,
"attached_condition": "(orders.o_orderDATE between
1990-01-01 and 1998-12-06)"
},
},
"table": {
"table_name": "lineitem",
"access_type": "ref",
"possible_keys": ["PRIMARY", "i_l_orderkey",
"i_l_orderkey_quantity"],
"key": "PRIMARY",
"key_length": "4",
"used_key_parts": ["l_orderkey"],
"ref": ["dbt3sf1.orders.o_orderkey"],
"r_loops": 1500000,
"rows": 1,
"r_rows": 4.0008,
"r_total_time_ms": 170456,
"filtered": 100,
"r_filtered": 0,
"attached_condition": "(lineitem.l_extendedprice > 1000000)"
}
}
}](https://image.slidesharecdn.com/analyze-statement-in-mariadb101-150501175901-conversion-gate02/85/ANALYZE-for-executable-statements-a-new-way-to-do-optimizer-troubleshooting-in-MariaDB-10-1-23-320.jpg)
![24
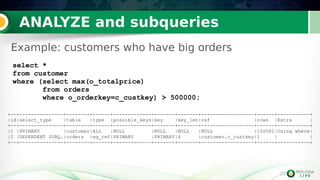
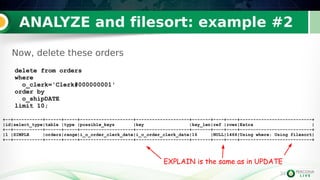
ANALYZE FORMAT=JSON basics
All ANALYZE fields start with r_
• Each table has
– r_loops
– r_total_time_ms ←!
• Checking
orders.r_total_time_ms=14261
lineitem.r_total_time_ms=170456
• Aha!
24
{
"query_block": {
"select_id": 1,
"r_loops": 1,
"r_total_time_ms": 191747,
"table": {
"table_name": "orders",
"access_type": "ALL",
"possible_keys": ["PRIMARY", "i_o_orderdate"],
"r_loops": 1,
"rows": 1498194,
"r_rows": 1.5e6,
"r_total_time_ms": 14261,
"filtered": 50,
"r_filtered": 100,
"attached_condition": "(orders.o_orderDATE between
1990-01-01 and 1998-12-06)"
},](https://image.slidesharecdn.com/analyze-statement-in-mariadb101-150501175901-conversion-gate02/85/ANALYZE-for-executable-statements-a-new-way-to-do-optimizer-troubleshooting-in-MariaDB-10-1-24-320.jpg)
![26
26
ANALYZE: {
"query_block": {
"select_id": 1,
"r_loops": 1,
"r_total_time_ms": 11214,
"table": {
"table_name": "customer",
"access_type": "ALL",
"r_loops": 1,
"rows": 150081,
"r_rows": 150000,
"r_total_time_ms": 1181.2,
"filtered": 100,
"r_filtered": 0,
"attached_condition": "((subquery#2) > 500000)"
},
"subqueries": [
{
"subqueries": [
{
"query_block": {
"select_id": 2,
"r_loops": 150000,
"r_total_time_ms": 9658.6,
"table": {
"table_name": "orders",
"access_type": "eq_ref",
"possible_keys": ["PRIMARY"],
"key": "PRIMARY",
"key_length": "4",
"used_key_parts": ["o_orderkey"],
"ref": ["dbt3sf1.customer.c_custkey"],
"r_loops": 150000,
"rows": 1,
"r_rows": 0.25,
"r_total_time_ms": 8497.7,
"filtered": 100,
"r_filtered": 100
}
}
}
]
}
}
ANALYZE subq](https://image.slidesharecdn.com/analyze-statement-in-mariadb101-150501175901-conversion-gate02/85/ANALYZE-for-executable-statements-a-new-way-to-do-optimizer-troubleshooting-in-MariaDB-10-1-26-320.jpg)


![33
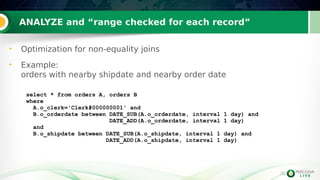
ANALYZE and filesort: example #1
33
• r_limit
• r_used_priority_queue
• r_output_rows
• ...
"table": {
"update": 1,
"table_name": "orders",
"access_type": "range",
"possible_keys": ["i_o_order_clerk_date"],
"key": "i_o_order_clerk_date",
"key_length": "16",
"used_key_parts": ["o_clerk"],
"rows": 1466,
"r_rows": 1467,
"r_filtered": 100,
"r_total_time_ms": 107.12,
"attached_condition": "(orders.o_clerk = 'Clerk#00001')"
}
}
}
}
ANALYZE: {
"query_block": {
"select_id": 1,
"r_total_time_ms": 109.02,
"filesort": {
"r_loops": 1,
"r_limit": 10,
"r_used_priority_queue": true,
"r_output_rows": 10,
"r_total_time_ms": 46.875,
"table": {](https://image.slidesharecdn.com/analyze-statement-in-mariadb101-150501175901-conversion-gate02/85/ANALYZE-for-executable-statements-a-new-way-to-do-optimizer-troubleshooting-in-MariaDB-10-1-33-320.jpg)
![35
ANALYZE and filesort: example #2
35
• DELETE doesnt' pass
LIMIT to filesort :-(.
ANALYZE: {
"query_block": {
"select_id": 1,
"r_total_time_ms": 11.265,
"filesort": {
"r_loops": 1,
"r_limit": "none",
"r_used_priority_queue": false,
"r_output_rows": 1494,
"r_total_time_ms": 10.228,
"r_buffer_size": "2048Kb",
"table": {
"table": {
"delete": 1,
"table_name": "orders",
"access_type": "range",
"possible_keys": ["i_o_order_clerk_date"],
"key": "i_o_order_clerk_date",
"key_length": "16",
"used_key_parts": ["o_clerk"],
"rows": 1493,
"r_rows": 1494,
"r_filtered": 100,
"r_total_time_ms": 9.7133,
"attached_condition": "(orders2.o_clerk = 'Clerk#00001')"
}
}
}
}
delete from orders where o_clerk='Clerk#00001' order by o_shipDATE limit 10
Wow :-(](https://image.slidesharecdn.com/analyze-statement-in-mariadb101-150501175901-conversion-gate02/85/ANALYZE-for-executable-statements-a-new-way-to-do-optimizer-troubleshooting-in-MariaDB-10-1-35-320.jpg)
![38
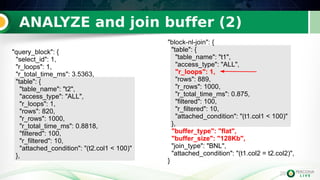
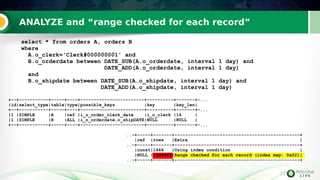
ANALYZE and “range checked for each record”
38
ANALYZE: {
"query_block": {
"select_id": 1,
"r_loops": 1,
"r_total_time_ms": 5769,
"table": {
"table_name": "A",
"access_type": "ref",
"possible_keys": ["i_o_order_clerk_date"],
"key": "i_o_order_clerk_date",
"key_length": "16",
"used_key_parts": ["o_clerk"],
"ref": ["const"],
"r_loops": 1,
"rows": 1466,
"r_rows": 1467,
"r_total_time_ms": 3.6642,
"filtered": 100,
"r_filtered": 100,
"index_condition": "(A.o_clerk = 'Clerk#00001')"
},
"range-checked-for-each-record": {
"keys": ["i_o_orderdate", "o_shipDATE"],
"r_keys": {
"full_scan": 0,
"index_merge": 0,
"range": {
"i_o_orderdate": 1467,
"o_shipDATE": 0
}
},
"table": {
"table_name": "B",
"access_type": "ALL",
"possible_keys": ["i_o_orderdate", "o_shipDATE"],
"r_loops": 1467,
"rows": 1499649,
"r_rows": 1871.2,
"r_total_time_ms": 3649.9,
"filtered": 100,
"r_filtered": 100
}
}
}
}.](https://image.slidesharecdn.com/analyze-statement-in-mariadb101-150501175901-conversion-gate02/85/ANALYZE-for-executable-statements-a-new-way-to-do-optimizer-troubleshooting-in-MariaDB-10-1-38-320.jpg)


The document presents a new approach for troubleshooting optimizer performance in MariaDB 10.1, detailing a three-step workflow that identifies poorly performing queries, examines optimizer behavior, and analyzes execution statistics. It introduces an 'analyze' command that offers execution insights similar to PostgreSQL’s EXPLAIN ANALYZE and facilitates deeper analysis through improved query planning. Furthermore, it compares observed and expected row counts and filtered values to identify potential inefficiencies in query execution.


![Introduction into MySQL Query Tuning for Dev[Op]s](https://cdn.slidesharecdn.com/ss_thumbnails/qtdevops-210717011329-thumbnail.jpg?width=640&height=640&fit=bounds)