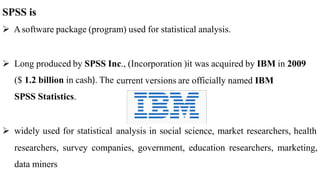
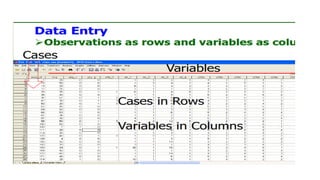
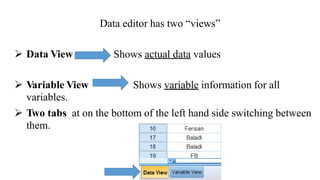
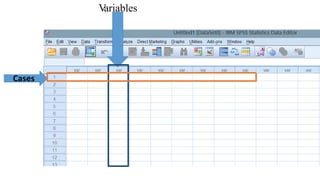
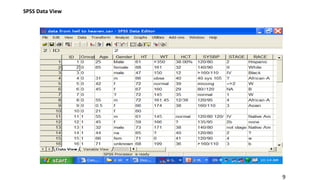
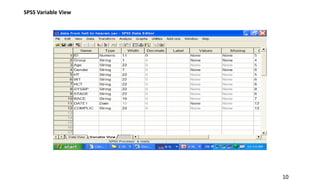
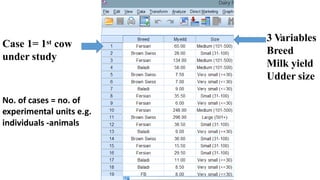
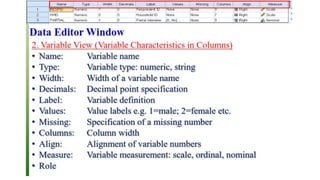
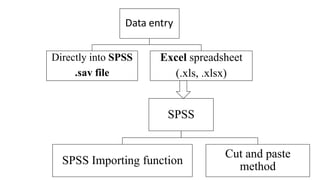
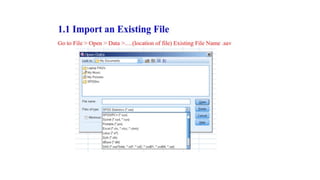
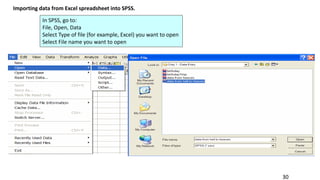
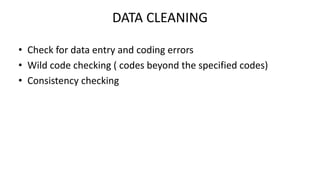
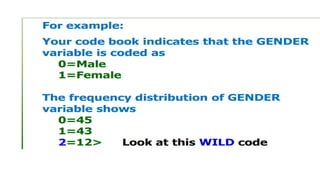
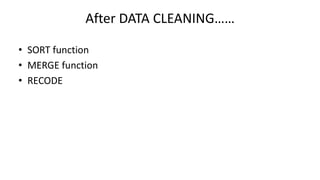
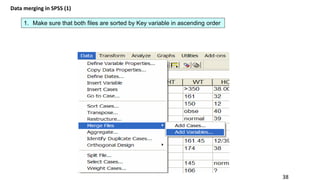
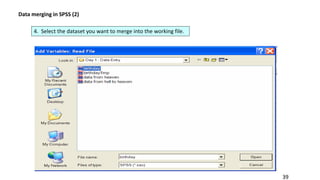
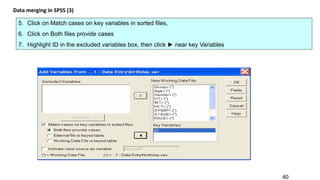
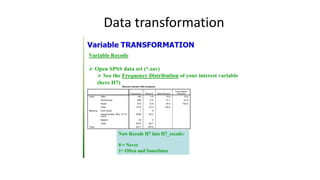
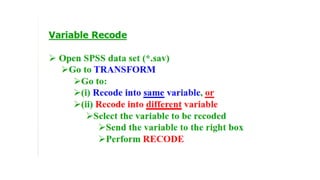
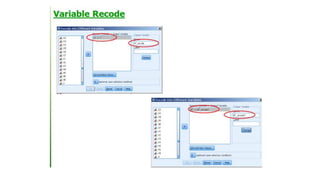
Presented by:
SUBODH KHANAL
Asst. Professor
Paklihawa Campus
Institute of Agriculture and Animal Science
S PS S
Statistical Package for the Social Sciences
SPSS is
 Asoftware package (program) used for statistical analysis.
 Long produced by SPSS Inc., (Incorporation )it was acquired by IBM in 2009
($ 1.2 billion in cash). The
SPSS Statistics.
current versions are officially named IBM
 widely used for statistical analysis in social science, market researchers, health
researchers,
data miners
survey companies, government, education researchers, marketing,
Why SPSS???
 Popular and has been used extensively in medical and biological
researches.
 More user-friendly (data analysis presentation) than other
statistical software (e.g., S-Plus, R, SAS) (Drop down menus not
commands!).
 Contain all statistical procedures which the researcher is in need
5
SPSS Windows has 3 windows:
Data Editor
Syntax Editor, which displays syntax files
Output: Viewer or Draft Viewer which displays the output files
The Data Editor has two parts:
Data View window, which displays data from the active file in spreadsheet format
Variable View window, which displays metadata or information about the data in the active file, such as
variable names and labels, value labels, formats, and missing value indicators.
Data analysis
Data editor has two “views”
 Data View Shows actual data values
 Variable View
variables.
Shows variable information for all
 Two tabs at on the bottom of the left hand side switching between
them.
Variables
Cases
9
SPSS Data View
10
SPSS Variable View
3 Variables
Breed
Milk yield
Udder size
1stCase 1= cow
under study
No. of cases = no. of
experimental units e.g.
individuals -animals
Variable View
create variable names and define the attributes of each variable.
Name name for each variable.
 only of letters, and the underbar (_)
 No pure numbers - space - dot .
Type
Width
Decimals
Label
specify type the variable. string
space the entries in the Data
or numeric type.
View will be for this variable.
decimal places will be shown for this variable in the Data View.
give a variable a label or title. makes all output much more readable.
Values specify numerical values for each category of categorical variable.
For example for the variable SEX 1 for Male, 2 for Females .
Missing specify values for a variable indicate missing data.
Columns spaces will be allocated for the variable in the Data View. different
from width in that width limits the number of spaces for the actual number.
Columns limits how many spaces will be visible in the Data View.
Align either left aligns, centers, or right aligns the entries for the variable.
Measure
Ascale variable
type of variable.
is a quantitative variable.
categorical variable where the categories have aAn ordinal variable
natural order such as
Anominal variable
poor, fair, good, better, best.
categorical variable no natural order to the categories,
such as male, female.
Entering and Saving Data
method
SPSS
SPSS Importing function
Cut and paste
Data entry
Directly into SPSS
.sav file
Excel spreadsheet
(.xls, .xlsx)
18
Figure 1. Data from Hell
19
Data from Heaven
 7.4.4 Example
 Consider the comparison of the mean body weights at the time of mating in one
group of ewes which have been flushed (put on a high plane of nutrition for 2–3
weeks prior to mating) and another group which have not. Each ewe in a random
sample of 54 ewes is randomly allocated to the flushed or control group. Table
7.2 shows the weights of two samples of 24 flushed and 30 control ewes.
 How many variables in this data set ?
 2 Variables:
 Ewe Weight (Quantitative)
 Group (Qualitative): 0;Flushed, 1;control
IMPORTING DATA INTO SPSS
• Direct data entry in SPSS making a template
• Data import from excel or any other kind of file
Direct data entry in SPSS
30
Importing data from Excel spreadsheet into SPSS.
In SPSS, go to:
File, Open, Data
Select Type of file (for example, Excel) you want to open
Select File name you want to open
DATA CLEANING
• Check for data entry and coding errors
• Wild code checking ( codes beyond the specified codes)
• Consistency checking
After DATA CLEANING……
• SORT function
• MERGE function
• RECODE
SORT FUNCTION
SELECT function
MERGE function
38
Data merging in SPSS (1)
1. Make sure that both files are sorted by Key variable in ascending order
39
Data merging in SPSS (2)
4. Select the dataset you want to merge into the working file.
40
Data merging in SPSS (3)
5. Click on Match cases on key variables in sorted files,
6. Click on Both files provide cases
7. Highlight ID in the excluded variables box, then click ► near key Variables
Data transformation
e.g. Bramins vs rest
janajati vs rest

Introduction to spss

  • 1.
    Presented by: SUBODH KHANAL Asst.Professor Paklihawa Campus Institute of Agriculture and Animal Science
  • 2.
    S PS S StatisticalPackage for the Social Sciences
  • 3.
    SPSS is  Asoftwarepackage (program) used for statistical analysis.  Long produced by SPSS Inc., (Incorporation )it was acquired by IBM in 2009 ($ 1.2 billion in cash). The SPSS Statistics. current versions are officially named IBM  widely used for statistical analysis in social science, market researchers, health researchers, data miners survey companies, government, education researchers, marketing,
  • 4.
    Why SPSS???  Popularand has been used extensively in medical and biological researches.  More user-friendly (data analysis presentation) than other statistical software (e.g., S-Plus, R, SAS) (Drop down menus not commands!).  Contain all statistical procedures which the researcher is in need
  • 5.
    5 SPSS Windows has3 windows: Data Editor Syntax Editor, which displays syntax files Output: Viewer or Draft Viewer which displays the output files The Data Editor has two parts: Data View window, which displays data from the active file in spreadsheet format Variable View window, which displays metadata or information about the data in the active file, such as variable names and labels, value labels, formats, and missing value indicators.
  • 6.
  • 7.
    Data editor hastwo “views”  Data View Shows actual data values  Variable View variables. Shows variable information for all  Two tabs at on the bottom of the left hand side switching between them.
  • 8.
  • 9.
  • 10.
  • 11.
    3 Variables Breed Milk yield Uddersize 1stCase 1= cow under study No. of cases = no. of experimental units e.g. individuals -animals
  • 13.
    Variable View create variablenames and define the attributes of each variable. Name name for each variable.  only of letters, and the underbar (_)  No pure numbers - space - dot . Type Width Decimals Label specify type the variable. string space the entries in the Data or numeric type. View will be for this variable. decimal places will be shown for this variable in the Data View. give a variable a label or title. makes all output much more readable.
  • 14.
    Values specify numericalvalues for each category of categorical variable. For example for the variable SEX 1 for Male, 2 for Females . Missing specify values for a variable indicate missing data. Columns spaces will be allocated for the variable in the Data View. different from width in that width limits the number of spaces for the actual number. Columns limits how many spaces will be visible in the Data View. Align either left aligns, centers, or right aligns the entries for the variable.
  • 15.
    Measure Ascale variable type ofvariable. is a quantitative variable. categorical variable where the categories have aAn ordinal variable natural order such as Anominal variable poor, fair, good, better, best. categorical variable no natural order to the categories, such as male, female.
  • 16.
  • 17.
    method SPSS SPSS Importing function Cutand paste Data entry Directly into SPSS .sav file Excel spreadsheet (.xls, .xlsx)
  • 18.
  • 19.
  • 20.
     7.4.4 Example Consider the comparison of the mean body weights at the time of mating in one group of ewes which have been flushed (put on a high plane of nutrition for 2–3 weeks prior to mating) and another group which have not. Each ewe in a random sample of 54 ewes is randomly allocated to the flushed or control group. Table 7.2 shows the weights of two samples of 24 flushed and 30 control ewes.
  • 22.
     How manyvariables in this data set ?
  • 23.
     2 Variables: Ewe Weight (Quantitative)  Group (Qualitative): 0;Flushed, 1;control
  • 24.
    IMPORTING DATA INTOSPSS • Direct data entry in SPSS making a template • Data import from excel or any other kind of file
  • 25.
  • 30.
    30 Importing data fromExcel spreadsheet into SPSS. In SPSS, go to: File, Open, Data Select Type of file (for example, Excel) you want to open Select File name you want to open
  • 31.
    DATA CLEANING • Checkfor data entry and coding errors • Wild code checking ( codes beyond the specified codes) • Consistency checking
  • 33.
    After DATA CLEANING…… •SORT function • MERGE function • RECODE
  • 34.
  • 35.
  • 36.
  • 38.
    38 Data merging inSPSS (1) 1. Make sure that both files are sorted by Key variable in ascending order
  • 39.
    39 Data merging inSPSS (2) 4. Select the dataset you want to merge into the working file.
  • 40.
    40 Data merging inSPSS (3) 5. Click on Match cases on key variables in sorted files, 6. Click on Both files provide cases 7. Highlight ID in the excluded variables box, then click ► near key Variables
  • 41.
  • 44.
    e.g. Bramins vsrest janajati vs rest