The document discusses climate change projections from several studies and organizations:
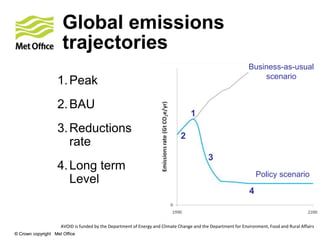
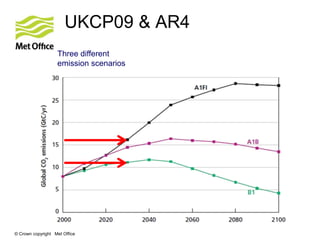
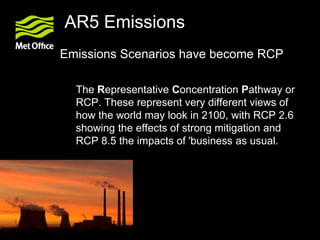
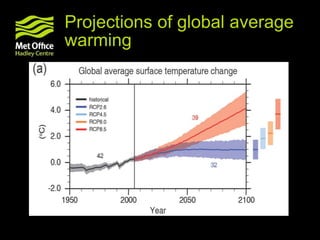
1) It references three emission scenarios from the UKCP09 and AR4 studies that project different trajectories for global emissions.
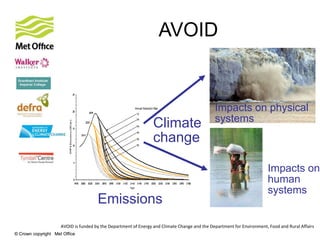
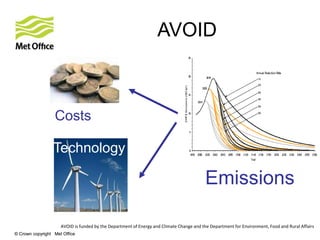
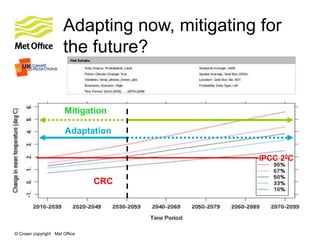
2) The AVOID study examines impacts of climate change on physical and human systems based on emissions, climate modeling, and economic costs and technologies.
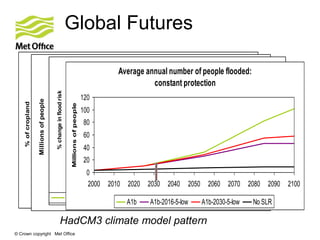
3) Global Futures projections show risks like decreased crop suitability, increased water stress, and greater flooding under various warming scenarios.
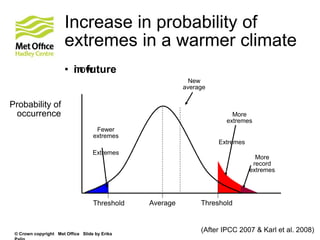
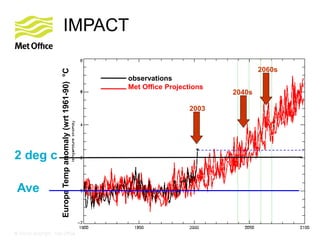
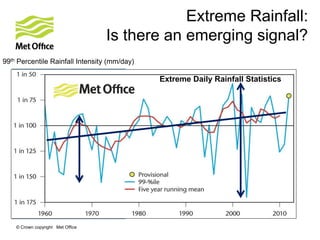
4) The Met Office's own projections for temperature increases in Europe and changes to extreme rainfall are also noted.