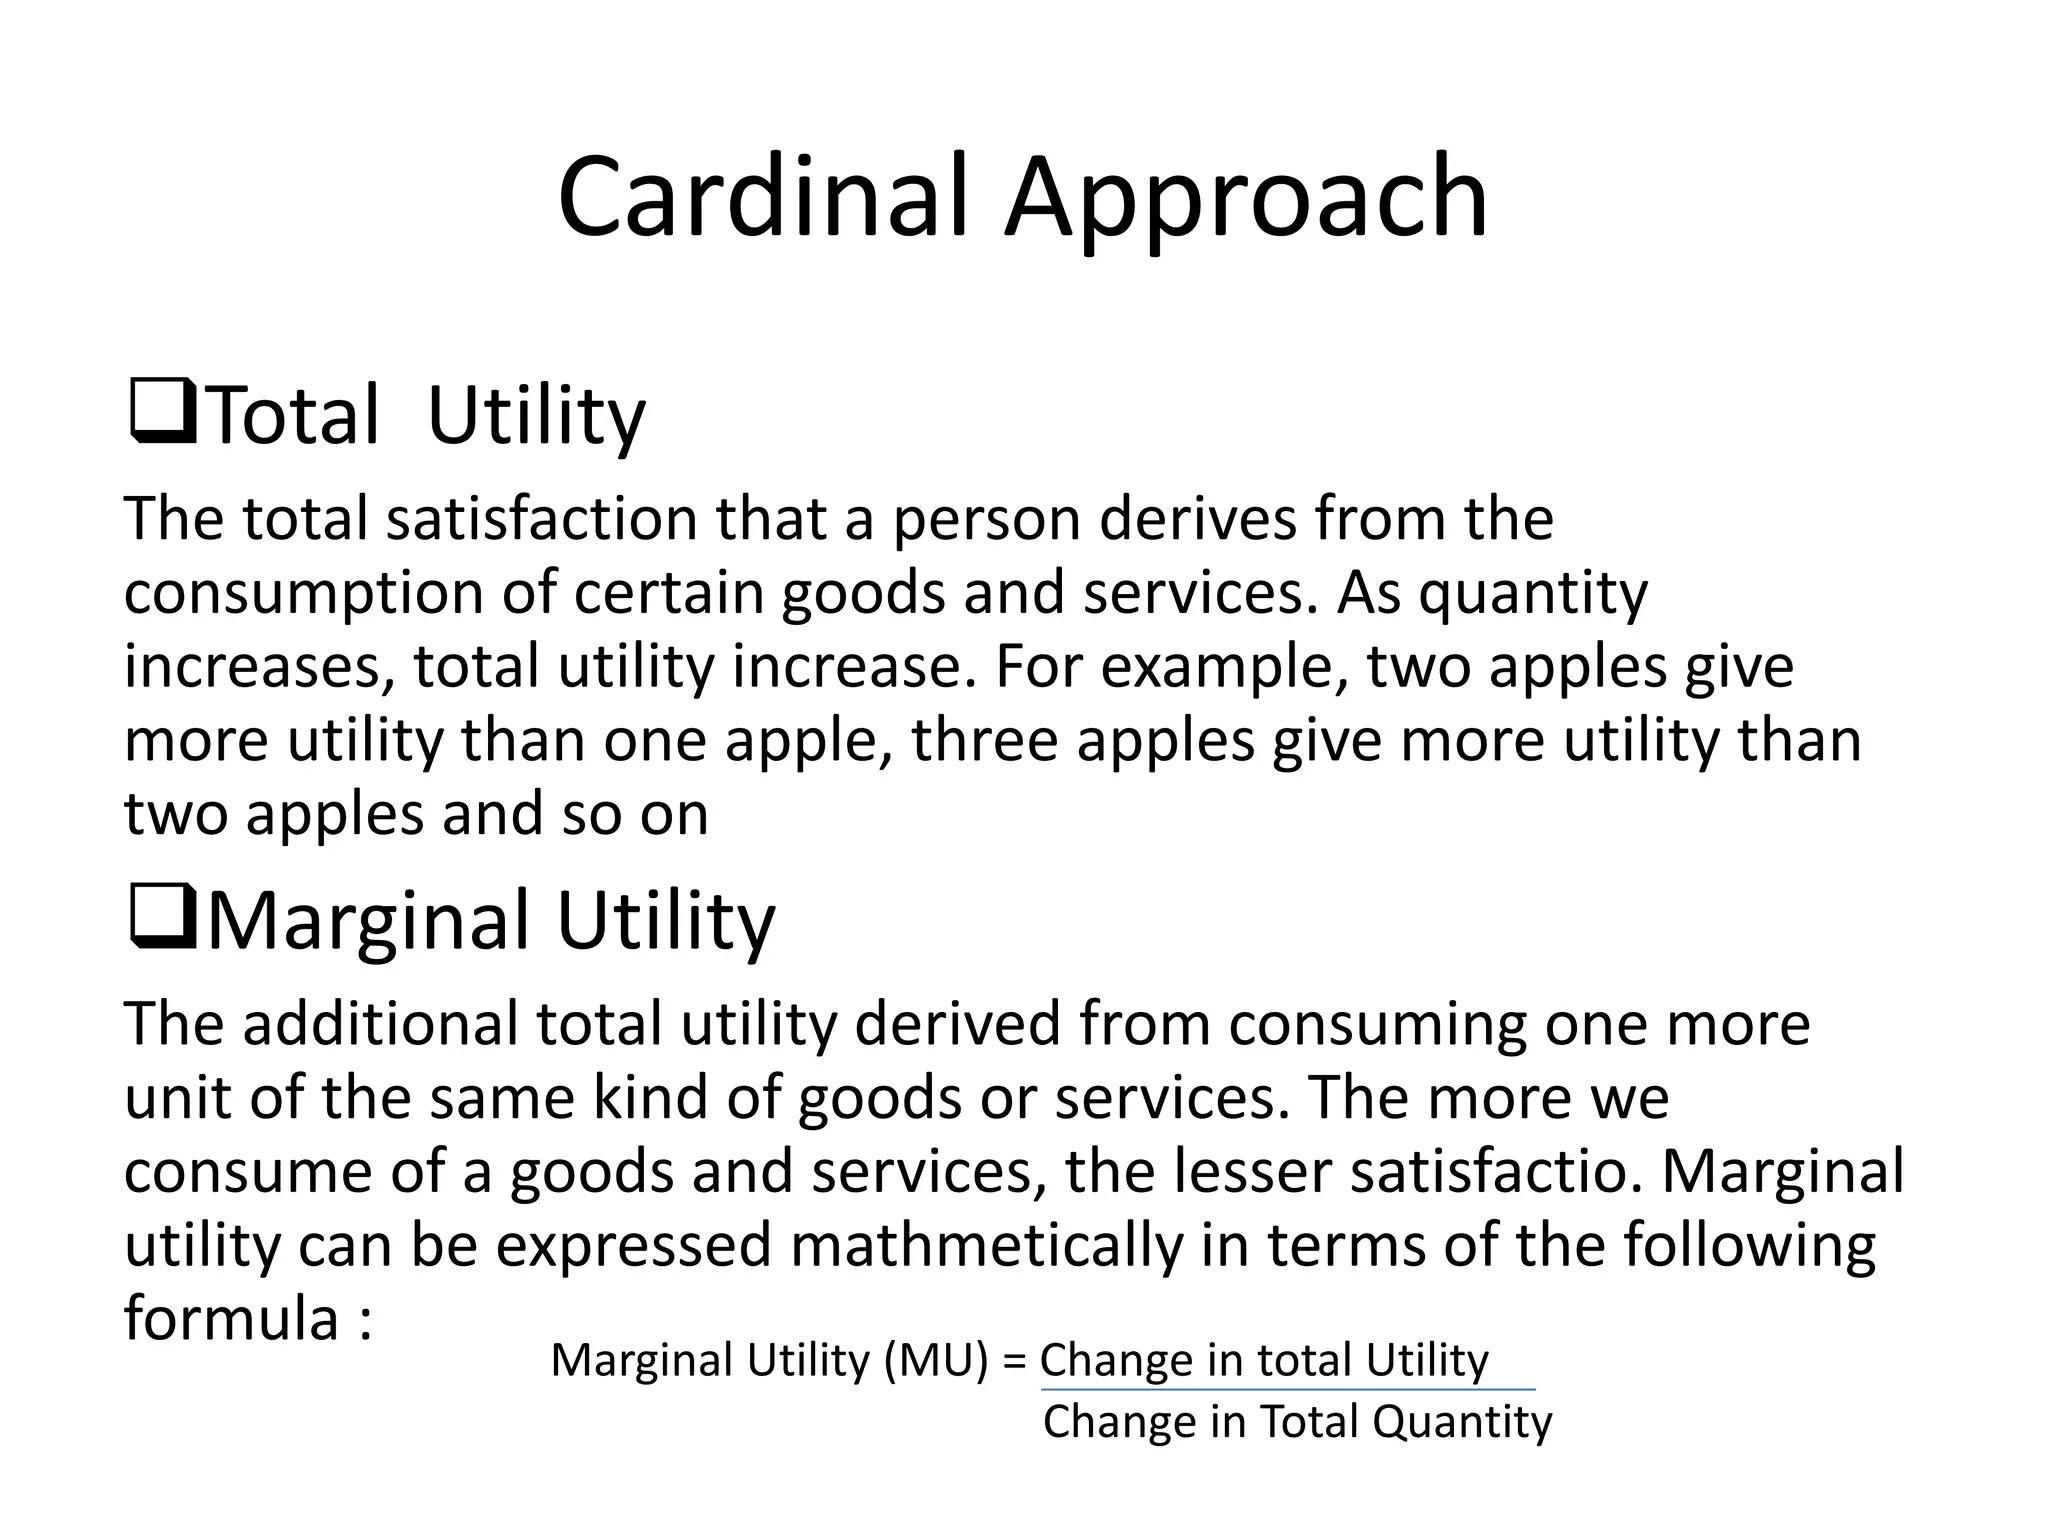
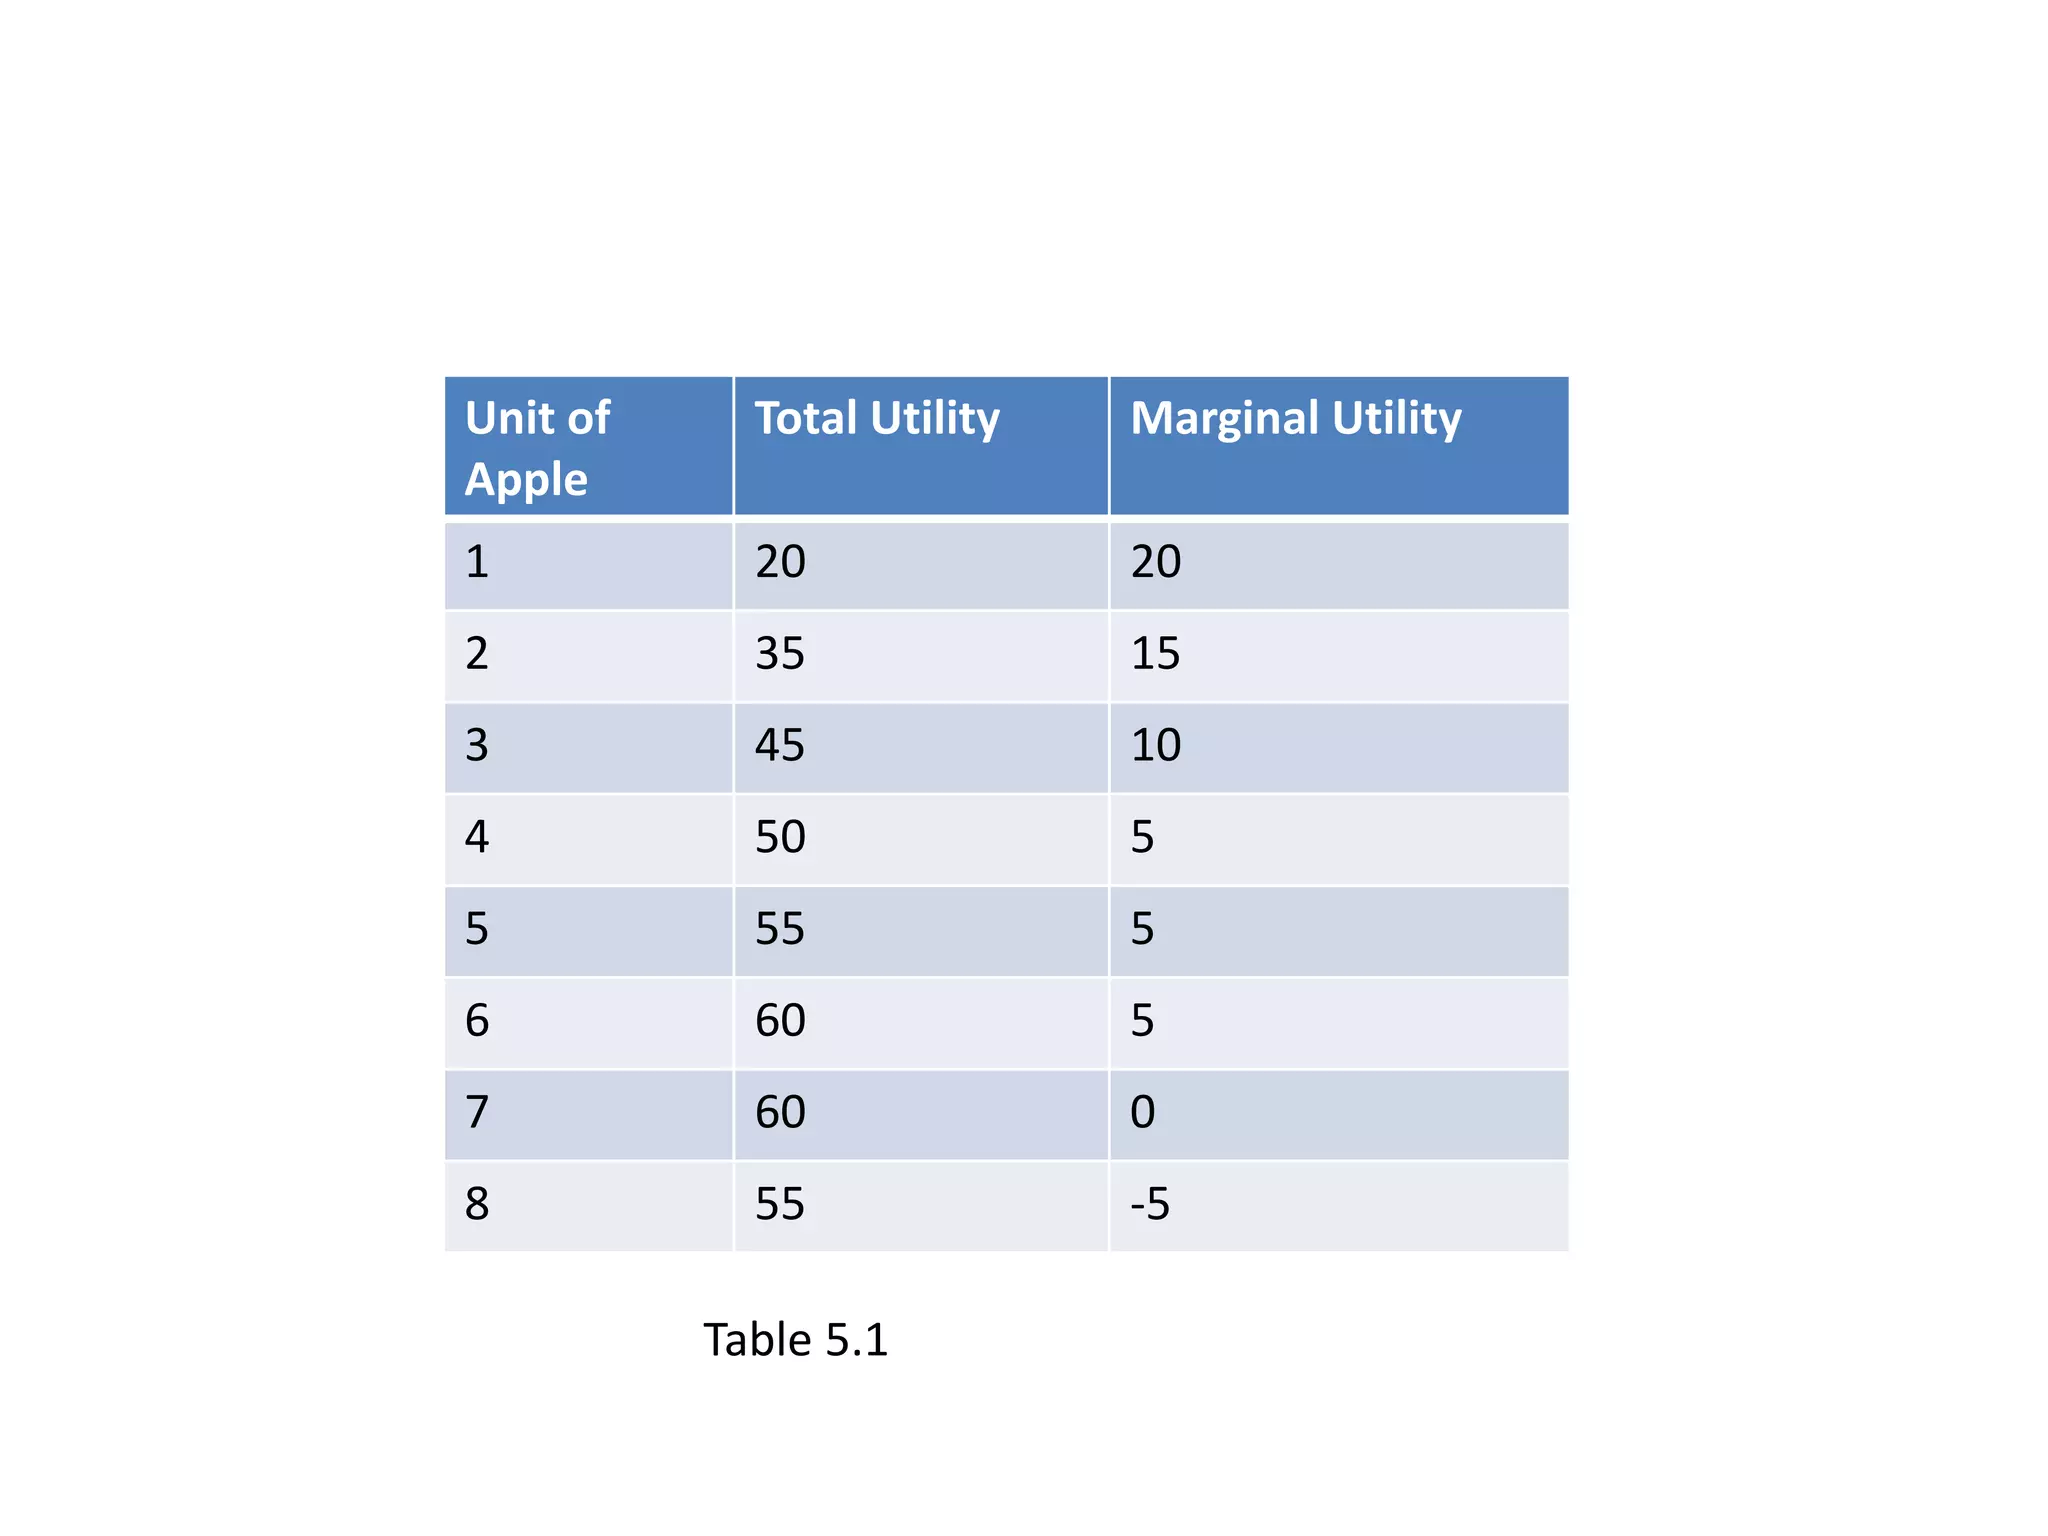
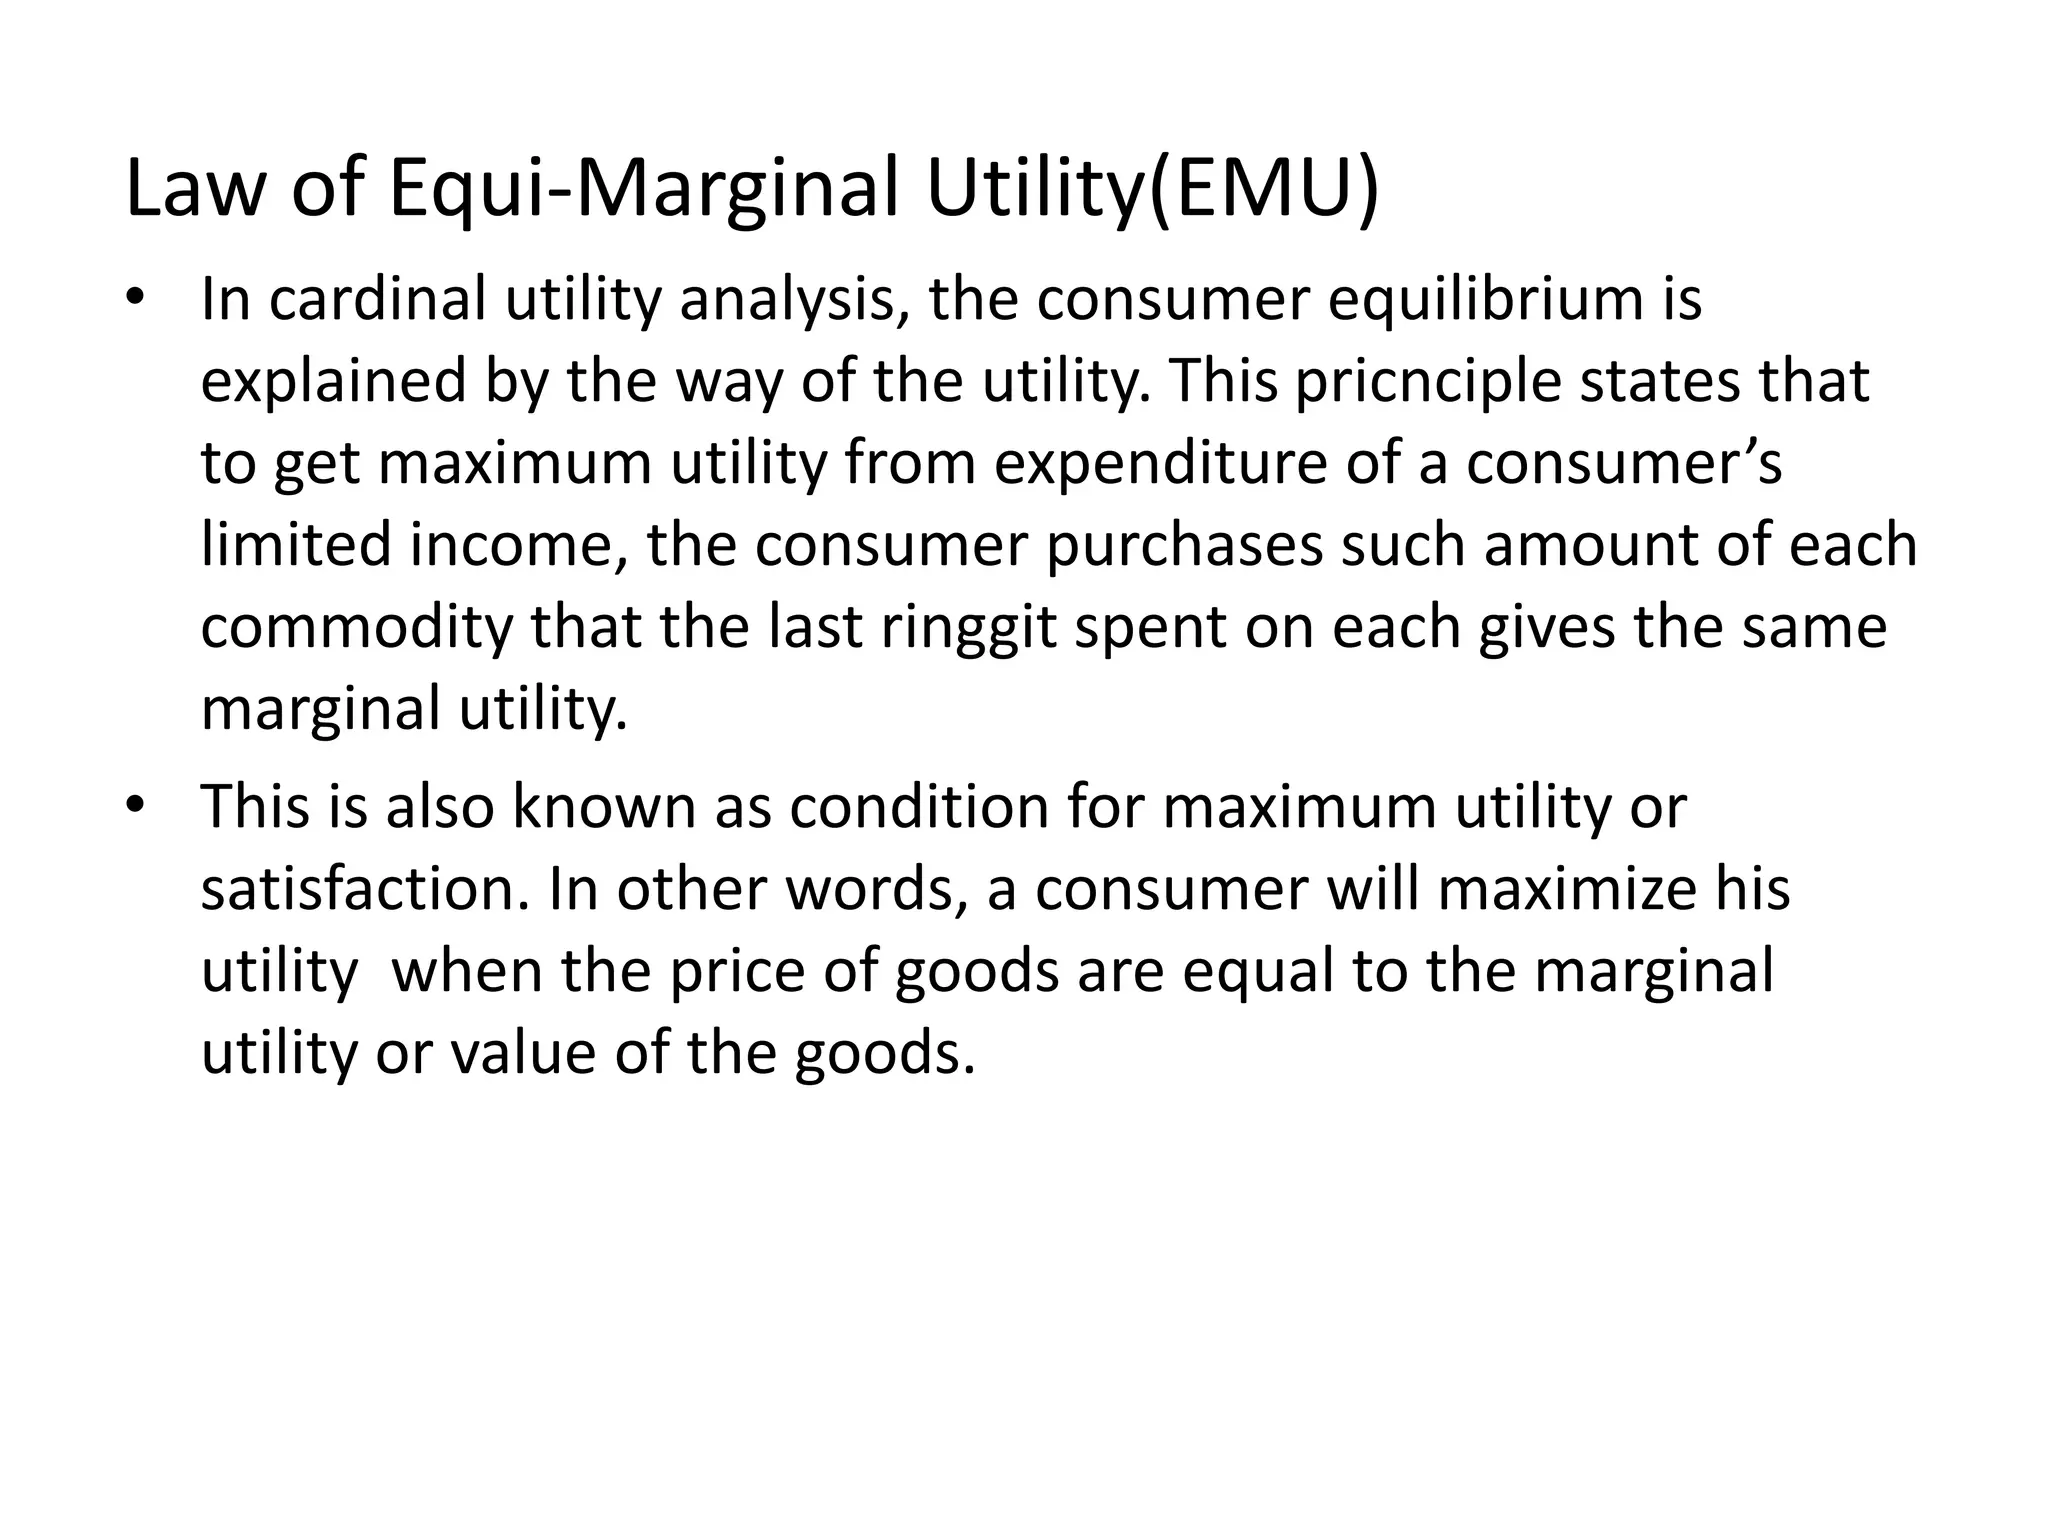
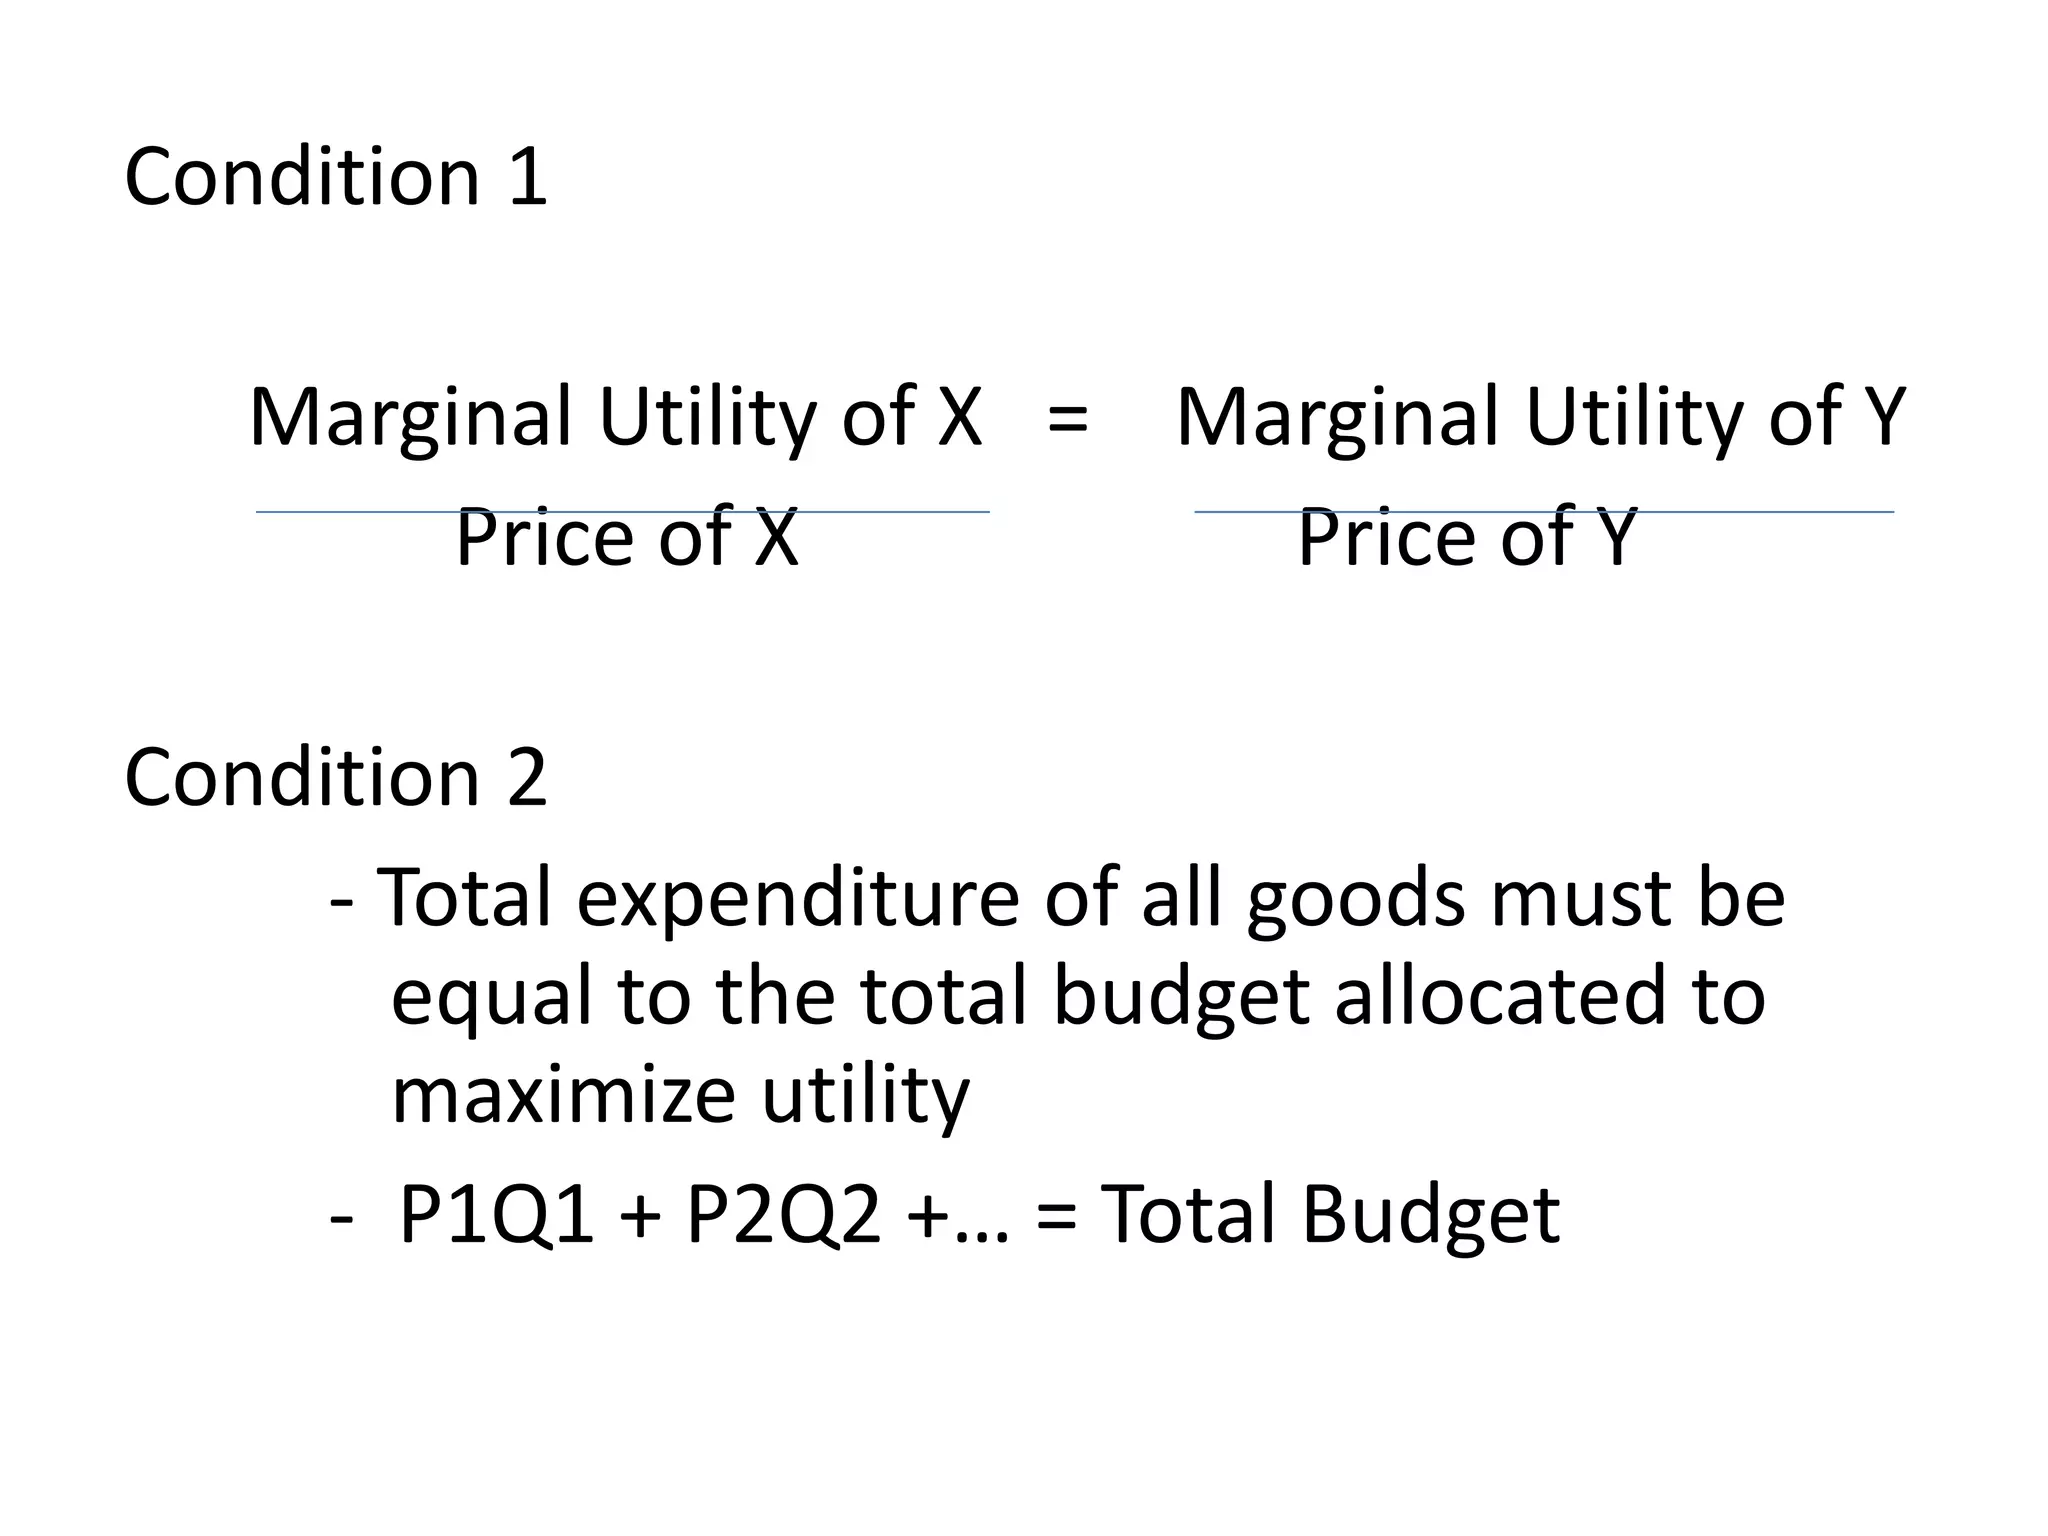
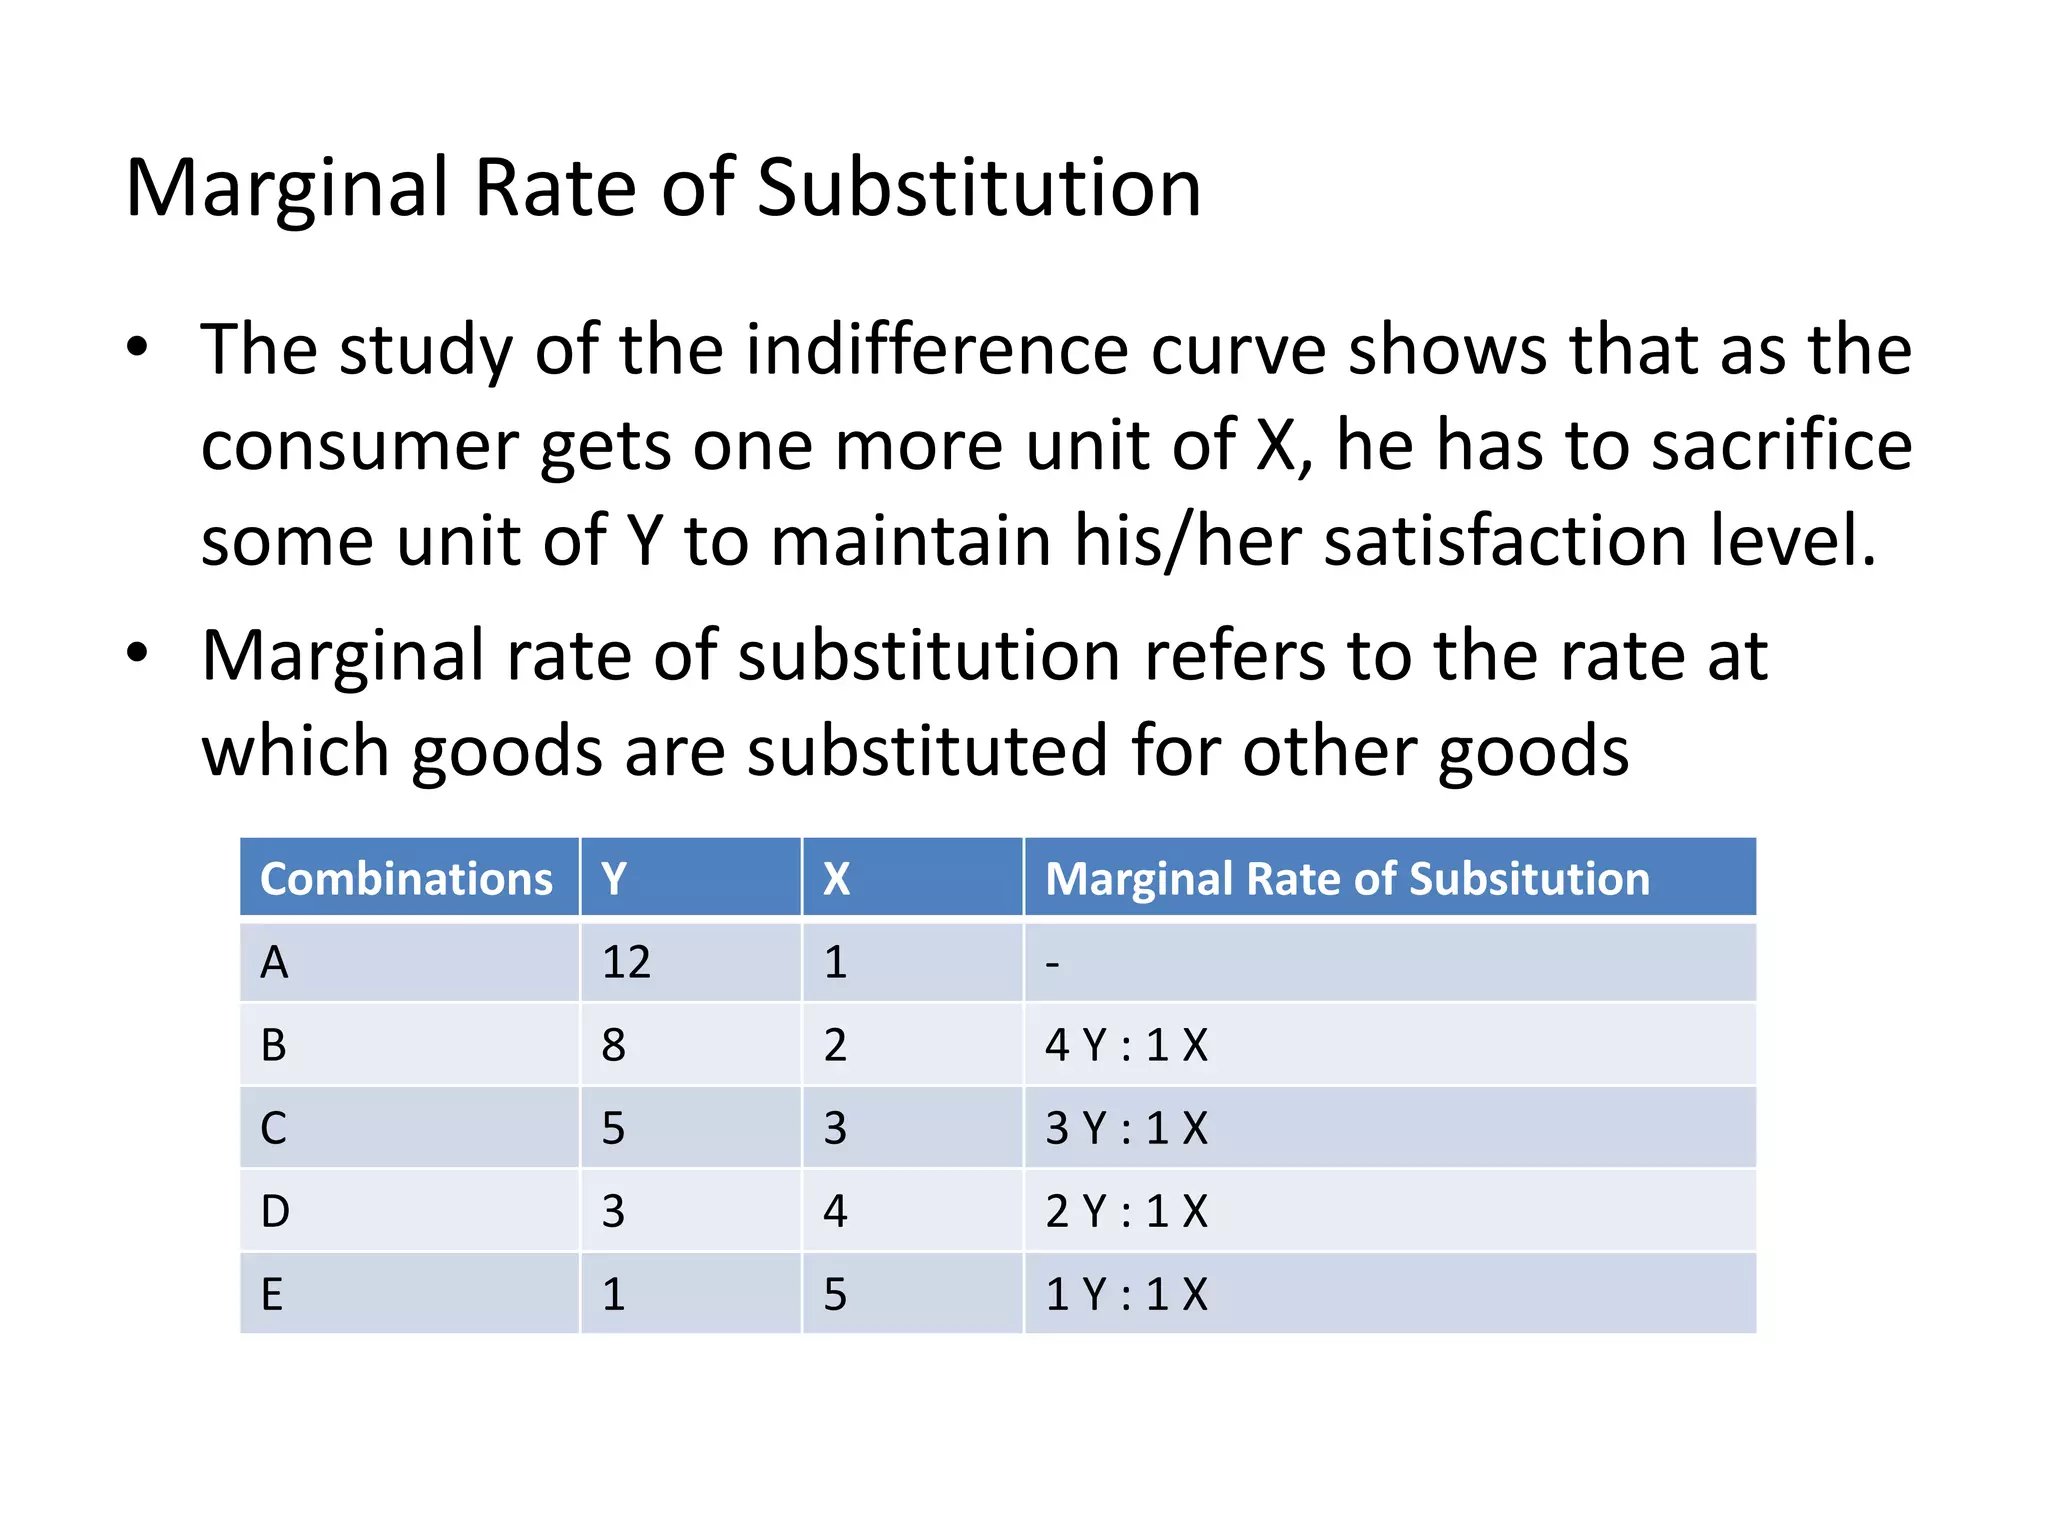
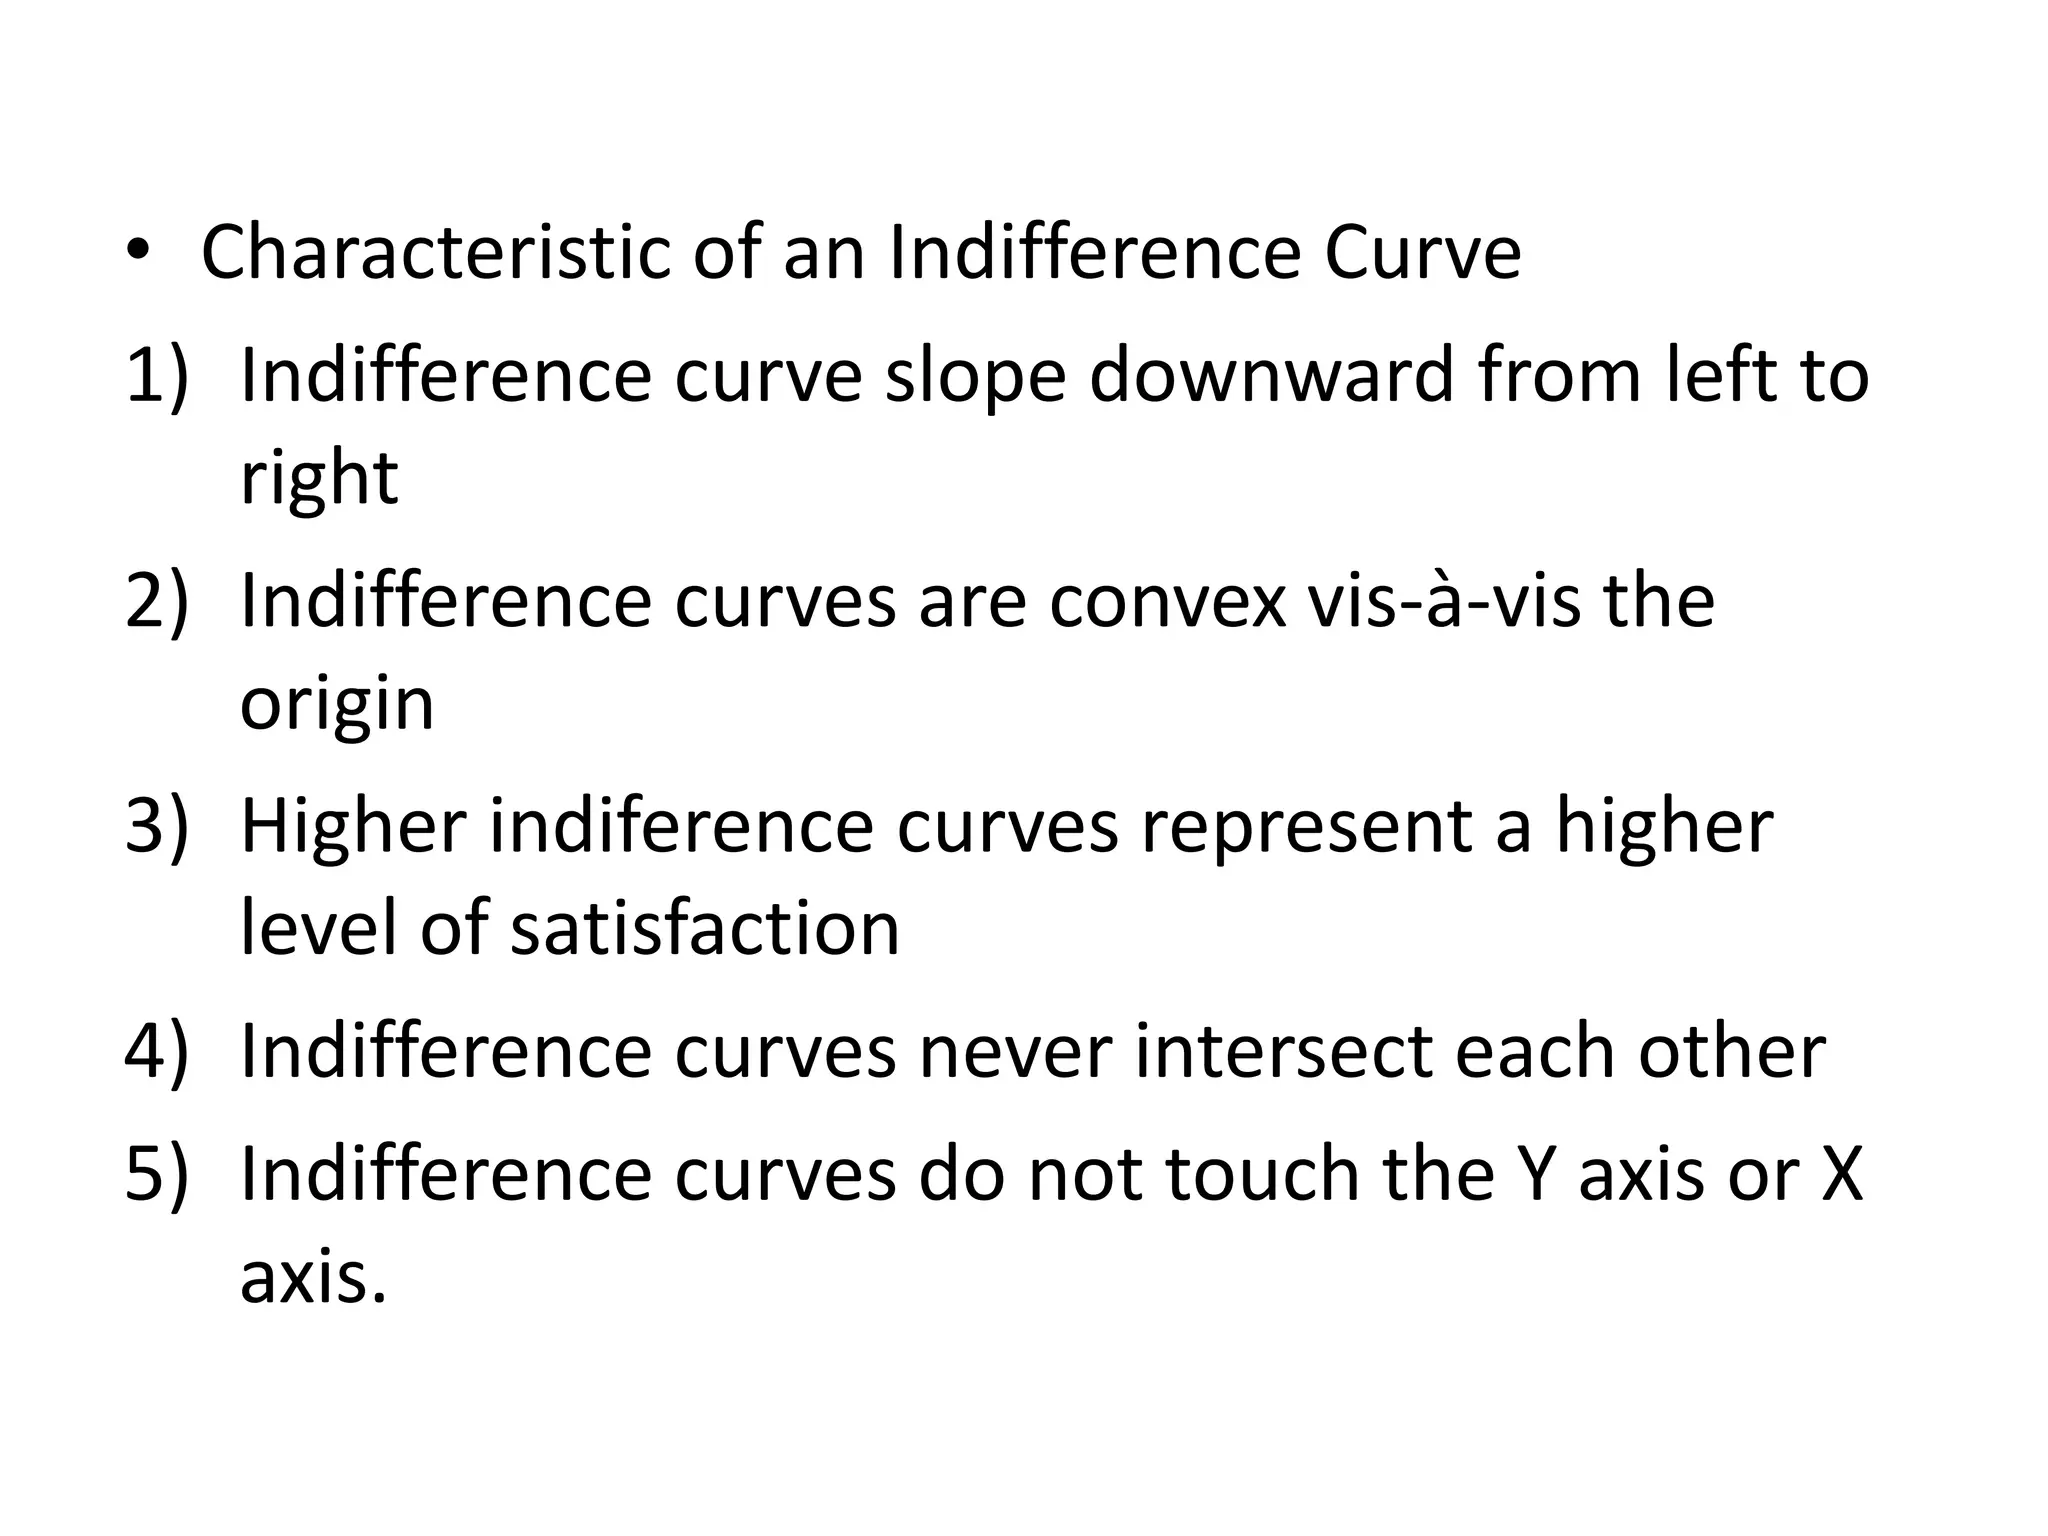
Theory of consumer behaviour
• Introduction
In previous chapter, we studied the concept of
individual demand and market demand. We
also looked at the various determinants of
demand, which will affect the quantity
demanded of particular goods. In this chapter ,
we will look at how a consumer chooses to
spend his/her limited income to purchase
available goods in the market so as to achieve
maximum utility. We will also l ook at two
approaches- the cardinal approach and the
ordinal approach.
• Definition of Consumer Behaviour
Consumer behaviour refers to the study of a
consumer while he/she is engaged in the process
of consumption. This will tell us how a consumer
with his limited resources (income) purchases
various goods and services, and we will compare
the price and utilities of different alternatives
Utility Approach
The term ‘utility’ means the satisfaction obtained from
consuming a commodity. Or in other words, ‘Utility is the ability
or the power of goods or services to satisfy the wants of a
consumer.’
There are two type of measurement or approach to explain the
condition of maximizing utility or satis faction
• Cardinal Approach
The cardinal utility theory says that utility is measurable
and by placing a number of altrnatives where the utility
can be added. The index used to measure utility is called
utils. For example an apple equals 5 utils or an orange
gives 8 utils.
• Ordinal Approach
The ordinal utility says that utility is not measurable but it
can be compared. The ordinal approach uses the ranking
of alternatives as first, second, third and so on. For
example, an apple is preferred to a durian. This only
means that an apple has higher utility than a durian, but
it cannot say by how much an apple has greater utility
than a durian.
Cardinal Approach
Total Utility
The total satisfaction that a person derives from the
consumption of certain goods and services. As quantity
increases, total utility increase. For example, two apples give
more utility than one apple, three apples give more utility than
two apples and so on
Marginal Utility
The additional total utility derived from consuming one more
unit of the same kind of goods or services. The more we
consume of a goods and services, the lesser satisfactio. Marginal
utility can be expressed mathmetically in terms of the following
formula :
Marginal Utility (MU) = Change in total Utility
Change in Total Quantity
Law of Diminishing Marginal Utility
One of the most important propositions of the marginal utility
approach to demand is the Law of Diminishing Utility . The first to
explain the Law was a German economist, Gossen.
‘The additional benefit which a person derives from a given
increase of a stock of a thing diminishes, other thing being equal, with
every increase sin the stock that he already has.’
Or in other words, as consumption increases marginal utility derived
become less.
An increase in consumption to satisfy needs result in intensity of the
want becoming lesser. We should all have experienced the Law of
Diminshing Marginal Utility at some point in our lives. The total will
increase until it reach certain maximum level after which it will decline.
For example, Zain is hungry and wants to consume aples. In this
situation, if he getan apple, the first apple will have high utility.
After the first apple he we be less hungry, so the second apple
will have lesser utility. The more apple he eats, the lower total
utility Zain derives.
Unit of
Apple
Total Utility Marginal Utility
1 20 20
2 35 15
3 45 10
4 50 5
5 55 5
6 60 5
7 60 0
8 55 -5
Table 5.1
From the table, it is clear that total utility increases with the
consumption of the first apple. At the seventh apple, it reaches
a saturation point. After the 7th apple, total utility decrease.
Marginal utility will decrease and become zero at the 7th apple
and further consumption of apple will not satisfy the consumer
as the marginal utility show negative results. If a person given for
the 8th apple to consume, he may no longer derive any
satisfaction. Therefore, the marginal utility for the 8th or more
apples will show negative results. The total utility and marginal
utility can be ilustrated by figure
Figure 5.1 illustrates the general relationship between total
utility and marginal utility. The total utility curve show how total
utility increases, reaches a maximum and the decrese. The
Marginal Utility curve show that marginal utility derease, reache
zero and then become negative.
Utility
Quantity
Total Utility Marginal Utility
Relationship between Total Utility (TU) and
Marginal Utility (MU)
– When TU is increasing, Mu will be positive
– When TU is at maximum, MU will be zero
– When TU is decreasing, MU will be negative
Assumptions
This Law states that on other things remain equal, total utility and
marginal utility will decrease after reaching a maximum level.
The main assumptionsw of the law follow as follws :
1. Homogenous unit
2. Consumption ini time frame
3. No change in taste
4. No change in price
5. Suitable quantity of consumption
Law of Equi-Marginal Utility(EMU)
• In cardinal utility analysis, the consumer equilibrium is
explained by the way of the utility. This pricnciple states that
to get maximum utility from expenditure of a consumer’s
limited income, the consumer purchases such amount of each
commodity that the last ringgit spent on each gives the same
marginal utility.
• This is also known as condition for maximum utility or
satisfaction. In other words, a consumer will maximize his
utility when the price of goods are equal to the marginal
utility or value of the goods.
Condition 1
Marginal Utility of X = Marginal Utility of Y
Price of X Price of Y
Condition 2
- Total expenditure of all goods must be
equal to the total budget allocated to
maximize utility
- P1Q1 + P2Q2 +… = Total Budget
For example: Arwin has income of RM 37 and the price
of goods P,Q,R are RM 5, RM 1 and RM 4 respectively.
The amount of total utility he would derive from
consuming P,Q and R is Shown in Table 5.2 below.
Quantity Product P Product Q Product R
Total
Utility
Mup/
Pp
Total
Utility
MUq
/ Pq
Total
Utility
MUr /
Pr
1 21 7 16
2 41 13 30
3 59 18 42
4 74 22 50
5 85 25 55
6 91 27 58
7 91 28 60
Example (continued)
Question : How many units of three products will Arwin
purchases ?
Answer : First Condition
There are two combination
Combination 1 : 2P, 4Q and 1R
Combination 2 : 4P,5Q and 3R
Second Condition
Combination 1 : 2(5) + 4(Q) + 1(R) = 18
Combination 2 :
Example (continued)
The total budget (income) is RM37, so combination 2
reflects consumer equilibrium because it fulfils both
condition. So, Arwin will purchase 4 units of Product P,
5 unit of Product Q and 3 unit of Product R.
Assumption of the Law of Equi-marginal Utility
1) The consumer is rational in his behavior and seeks maximum
satisfaction
2) The consumer has a fixed income
3) The prices of all goods are provided
4) Taste, fashion, preferences and habits of consumer remain
unchanged.
• Ordinal Approach
What will happen if the utility cannot be
measured absolutely? How can we achieve
consumer equilibrium? To answer these
questions, the indifference curve and budget line
analysis are used to explain the conditions of
consumer equilibrium or maximum utility.
Indifference Curve
An indifference curve represents all the possible combinations of
two goods which will give the same level of satisfaction. For all
possible points on the indifference curve, the total satisfaction
will be equal. Before we discuss how an indifference curve is
formed using an indifference schedule. Let us look at the
assimptions.
Assumption
1. Scale of preferances
2. Consumer’s Preferences are termed
transitivity
3. Rationality
4. Diminishing marginal rate of substitution
5. Concept of ordinal utility
• Indifference Shedule and curve
An indifference is a list of combinations of two
goods that give equal satisfaction to the
consumer. An indifference schedule may be
defined as a scheduleof various combinations of
goods that will satisfy the individual.
Combination Product Y Product X
A 12 2
B 6 4
C 4 6
D 3 8
E 2 12
Combination A show the consumer has 12 Y and 2 X, While combination B
shows he has 6Y and 4X. The consumer is indifference to these combinations
as they give him equal satisfaction.
• The above schedule can be shown as a diagram to
obtain the in the indifference curve. An indifference
curve represents all those combination of two goods,
X and Y which yield the same levelof satisfaction to a
consumer,
Good Y
Good X
Each indifference curve represent only one articular level of
satisfaction. If there are a number of indifference curves showing
different level of satisfaction, it is called an indifference map. The
higher the indifference curve from the origin, the higher the
utility.
Marginal Rate of Substitution
• The study of the indifference curve shows that as the
consumer gets one more unit of X, he has to sacrifice
some unit of Y to maintain his/her satisfaction level.
• Marginal rate of substitution refers to the rate at
which goods are substituted for other goods
Combinations Y X Marginal Rate of Subsitution
A 12 1 -
B 8 2 4 Y : 1 X
C 5 3 3 Y : 1 X
D 3 4 2 Y : 1 X
E 1 5 1 Y : 1 X
• Characteristic of an Indifference Curve
1) Indifference curve slope downward from left to
right
2) Indifference curves are convex vis-à-vis the
origin
3) Higher indiference curves represent a higher
level of satisfaction
4) Indifference curves never intersect each other
5) Indifference curves do not touch the Y axis or X
axis.

Bab5 theory of consumer behavior

  • 1.
  • 2.
    • Introduction In previouschapter, we studied the concept of individual demand and market demand. We also looked at the various determinants of demand, which will affect the quantity demanded of particular goods. In this chapter , we will look at how a consumer chooses to spend his/her limited income to purchase available goods in the market so as to achieve maximum utility. We will also l ook at two approaches- the cardinal approach and the ordinal approach.
  • 3.
    • Definition ofConsumer Behaviour Consumer behaviour refers to the study of a consumer while he/she is engaged in the process of consumption. This will tell us how a consumer with his limited resources (income) purchases various goods and services, and we will compare the price and utilities of different alternatives
  • 4.
    Utility Approach The term‘utility’ means the satisfaction obtained from consuming a commodity. Or in other words, ‘Utility is the ability or the power of goods or services to satisfy the wants of a consumer.’ There are two type of measurement or approach to explain the condition of maximizing utility or satis faction • Cardinal Approach The cardinal utility theory says that utility is measurable and by placing a number of altrnatives where the utility can be added. The index used to measure utility is called utils. For example an apple equals 5 utils or an orange gives 8 utils.
  • 5.
    • Ordinal Approach Theordinal utility says that utility is not measurable but it can be compared. The ordinal approach uses the ranking of alternatives as first, second, third and so on. For example, an apple is preferred to a durian. This only means that an apple has higher utility than a durian, but it cannot say by how much an apple has greater utility than a durian.
  • 6.
    Cardinal Approach Total Utility Thetotal satisfaction that a person derives from the consumption of certain goods and services. As quantity increases, total utility increase. For example, two apples give more utility than one apple, three apples give more utility than two apples and so on Marginal Utility The additional total utility derived from consuming one more unit of the same kind of goods or services. The more we consume of a goods and services, the lesser satisfactio. Marginal utility can be expressed mathmetically in terms of the following formula : Marginal Utility (MU) = Change in total Utility Change in Total Quantity
  • 7.
    Law of DiminishingMarginal Utility One of the most important propositions of the marginal utility approach to demand is the Law of Diminishing Utility . The first to explain the Law was a German economist, Gossen. ‘The additional benefit which a person derives from a given increase of a stock of a thing diminishes, other thing being equal, with every increase sin the stock that he already has.’ Or in other words, as consumption increases marginal utility derived become less. An increase in consumption to satisfy needs result in intensity of the want becoming lesser. We should all have experienced the Law of Diminshing Marginal Utility at some point in our lives. The total will increase until it reach certain maximum level after which it will decline.
  • 8.
    For example, Zainis hungry and wants to consume aples. In this situation, if he getan apple, the first apple will have high utility. After the first apple he we be less hungry, so the second apple will have lesser utility. The more apple he eats, the lower total utility Zain derives.
  • 9.
    Unit of Apple Total UtilityMarginal Utility 1 20 20 2 35 15 3 45 10 4 50 5 5 55 5 6 60 5 7 60 0 8 55 -5 Table 5.1
  • 10.
    From the table,it is clear that total utility increases with the consumption of the first apple. At the seventh apple, it reaches a saturation point. After the 7th apple, total utility decrease. Marginal utility will decrease and become zero at the 7th apple and further consumption of apple will not satisfy the consumer as the marginal utility show negative results. If a person given for the 8th apple to consume, he may no longer derive any satisfaction. Therefore, the marginal utility for the 8th or more apples will show negative results. The total utility and marginal utility can be ilustrated by figure Figure 5.1 illustrates the general relationship between total utility and marginal utility. The total utility curve show how total utility increases, reaches a maximum and the decrese. The Marginal Utility curve show that marginal utility derease, reache zero and then become negative.
  • 11.
  • 12.
    Relationship between TotalUtility (TU) and Marginal Utility (MU) – When TU is increasing, Mu will be positive – When TU is at maximum, MU will be zero – When TU is decreasing, MU will be negative Assumptions This Law states that on other things remain equal, total utility and marginal utility will decrease after reaching a maximum level. The main assumptionsw of the law follow as follws : 1. Homogenous unit 2. Consumption ini time frame 3. No change in taste 4. No change in price 5. Suitable quantity of consumption
  • 13.
    Law of Equi-MarginalUtility(EMU) • In cardinal utility analysis, the consumer equilibrium is explained by the way of the utility. This pricnciple states that to get maximum utility from expenditure of a consumer’s limited income, the consumer purchases such amount of each commodity that the last ringgit spent on each gives the same marginal utility. • This is also known as condition for maximum utility or satisfaction. In other words, a consumer will maximize his utility when the price of goods are equal to the marginal utility or value of the goods.
  • 14.
    Condition 1 Marginal Utilityof X = Marginal Utility of Y Price of X Price of Y Condition 2 - Total expenditure of all goods must be equal to the total budget allocated to maximize utility - P1Q1 + P2Q2 +… = Total Budget
  • 15.
    For example: Arwinhas income of RM 37 and the price of goods P,Q,R are RM 5, RM 1 and RM 4 respectively. The amount of total utility he would derive from consuming P,Q and R is Shown in Table 5.2 below. Quantity Product P Product Q Product R Total Utility Mup/ Pp Total Utility MUq / Pq Total Utility MUr / Pr 1 21 7 16 2 41 13 30 3 59 18 42 4 74 22 50 5 85 25 55 6 91 27 58 7 91 28 60
  • 16.
    Example (continued) Question :How many units of three products will Arwin purchases ? Answer : First Condition There are two combination Combination 1 : 2P, 4Q and 1R Combination 2 : 4P,5Q and 3R Second Condition Combination 1 : 2(5) + 4(Q) + 1(R) = 18 Combination 2 :
  • 17.
    Example (continued) The totalbudget (income) is RM37, so combination 2 reflects consumer equilibrium because it fulfils both condition. So, Arwin will purchase 4 units of Product P, 5 unit of Product Q and 3 unit of Product R. Assumption of the Law of Equi-marginal Utility 1) The consumer is rational in his behavior and seeks maximum satisfaction 2) The consumer has a fixed income 3) The prices of all goods are provided 4) Taste, fashion, preferences and habits of consumer remain unchanged.
  • 18.
    • Ordinal Approach Whatwill happen if the utility cannot be measured absolutely? How can we achieve consumer equilibrium? To answer these questions, the indifference curve and budget line analysis are used to explain the conditions of consumer equilibrium or maximum utility.
  • 19.
    Indifference Curve An indifferencecurve represents all the possible combinations of two goods which will give the same level of satisfaction. For all possible points on the indifference curve, the total satisfaction will be equal. Before we discuss how an indifference curve is formed using an indifference schedule. Let us look at the assimptions.
  • 20.
    Assumption 1. Scale ofpreferances 2. Consumer’s Preferences are termed transitivity 3. Rationality 4. Diminishing marginal rate of substitution 5. Concept of ordinal utility
  • 21.
    • Indifference Sheduleand curve An indifference is a list of combinations of two goods that give equal satisfaction to the consumer. An indifference schedule may be defined as a scheduleof various combinations of goods that will satisfy the individual.
  • 22.
    Combination Product YProduct X A 12 2 B 6 4 C 4 6 D 3 8 E 2 12 Combination A show the consumer has 12 Y and 2 X, While combination B shows he has 6Y and 4X. The consumer is indifference to these combinations as they give him equal satisfaction.
  • 23.
    • The aboveschedule can be shown as a diagram to obtain the in the indifference curve. An indifference curve represents all those combination of two goods, X and Y which yield the same levelof satisfaction to a consumer, Good Y Good X
  • 24.
    Each indifference curverepresent only one articular level of satisfaction. If there are a number of indifference curves showing different level of satisfaction, it is called an indifference map. The higher the indifference curve from the origin, the higher the utility.
  • 25.
    Marginal Rate ofSubstitution • The study of the indifference curve shows that as the consumer gets one more unit of X, he has to sacrifice some unit of Y to maintain his/her satisfaction level. • Marginal rate of substitution refers to the rate at which goods are substituted for other goods Combinations Y X Marginal Rate of Subsitution A 12 1 - B 8 2 4 Y : 1 X C 5 3 3 Y : 1 X D 3 4 2 Y : 1 X E 1 5 1 Y : 1 X
  • 26.
    • Characteristic ofan Indifference Curve 1) Indifference curve slope downward from left to right 2) Indifference curves are convex vis-à-vis the origin 3) Higher indiference curves represent a higher level of satisfaction 4) Indifference curves never intersect each other 5) Indifference curves do not touch the Y axis or X axis.