Download to read offline
![Comparative study of sympathetic cardiovascular parameters in overweight, normal and underweight
www.iosrjournals.org 11 | Page
MAP in overweight children(6). But beyond equilibrium, sympathetic nervous system cannot act to reduce body
weight. This causes sympathetic insufficiency in chronic overweight children which makes them pre-
hypertensive. This is shown by these tests. Cold pressure test is an indicator of vasoconstrictor tone. The lesser
increase in SBP, DBP & MAP during cold pressure test from its basal value in overweight boys in compare to
control group suggest sympathetic insufficiency(7). Sympathetic insufficiency leads to inadequate sympathetic
cholinergic vasodilatation in contracting muscles resulting in significant increase in maximum SBP, DBP &
MAP during Hand grip dynamometer test (8). But in underweight boys sympathetic system is not sufficiently
stimulated.
VI. Conclusion:
Our results indicate sympathetic insufficiency in overweight children. Data for underweight children is
not so contrast. So this study establishes the correlation of ANS (sympathetic activity), body weight regulation
(energy balance) & cardiovascular function.
Reference
[1]. Venkatnaraya KM, Campagna AF, Imperatore G. Type 2 diabetes in children : a problem lurking from india ? Indian Pediatr
2001; 38: 17.
[2]. Bray GA. Autonomic and endocrine factors in the regulation of energy balance. Fed Proc. 1986 ; 45[5]:1404-1410
[3]. Katzmarzyk PT, Srinibash SR, Chen W, Malina RM, Bouchard C, and waist hip ratio as diagnostic tests for fatness in
adolescents. Int J Obese 2004; doi:10.1038/sj.ijo.0802867, URL: www.nature.com.last accessed 3 Jan 2005.
[4]. Bedi M, Babbar R, Chakrabarty AS, Sachdev HP. Comparative study of autonomic nervous system activity in malnourished and
normal children in India. Inn Trop Paediatr 1999;19: 185- 189.
[5]. Heinrich WL. Autonomic insufficiency. Arch Intern Med 1982; 142: 339-344.
[6]. Sorof J, Daniels S. Obesity hypertension in children. A problem of epidemic proportions. Hypertension 2005; 45: 1159-1164.
[7]. De Simone G, Mancini M, Turko S, Marotta I, Gaeta I, Lannuzzi R, Ferrara LA, Mancini M. Cardiovascular response to the cold
test in obese subjects. Effect of a hypo caloric, normal sodium diet. Minerva endocrinol. 1990 Oct-Dec; 15(4): 231-233.
[8]. Leary AC, Donnan PT, MacDonald TM, Murphy MB. The influence of physical activity on the variability of ambulatory blood
pressue. Am J Hypertens. 2003; 13: 1067-73.
[9]. Ravisankar P, Madanmohan, Kaviraja U, and E. Sankaranarayanan Prakash. Correlation between body mass index and blood
pressure indices, handgrip strength and handgrip endurance overweight adolescents. Indian J Physiol Pharmacol 2005; 49(4): 455-
461.
[10]. Nageswari KR, Sharma R, Kohli DR. Assessment of respiratory and sympathetic cardiovascular parameters in obese school
children. Indian J Physiol Pharmacol 2007;51(3):235-243.](https://image.slidesharecdn.com/b0710911-150501070906-conversion-gate02/75/Comparative-study-of-sympathetic-cardiovascular-parameters-in-overweight-normal-and-underweight-school-children-in-southern-Odisha-basing-on-BMI-criteria-3-2048.jpg)

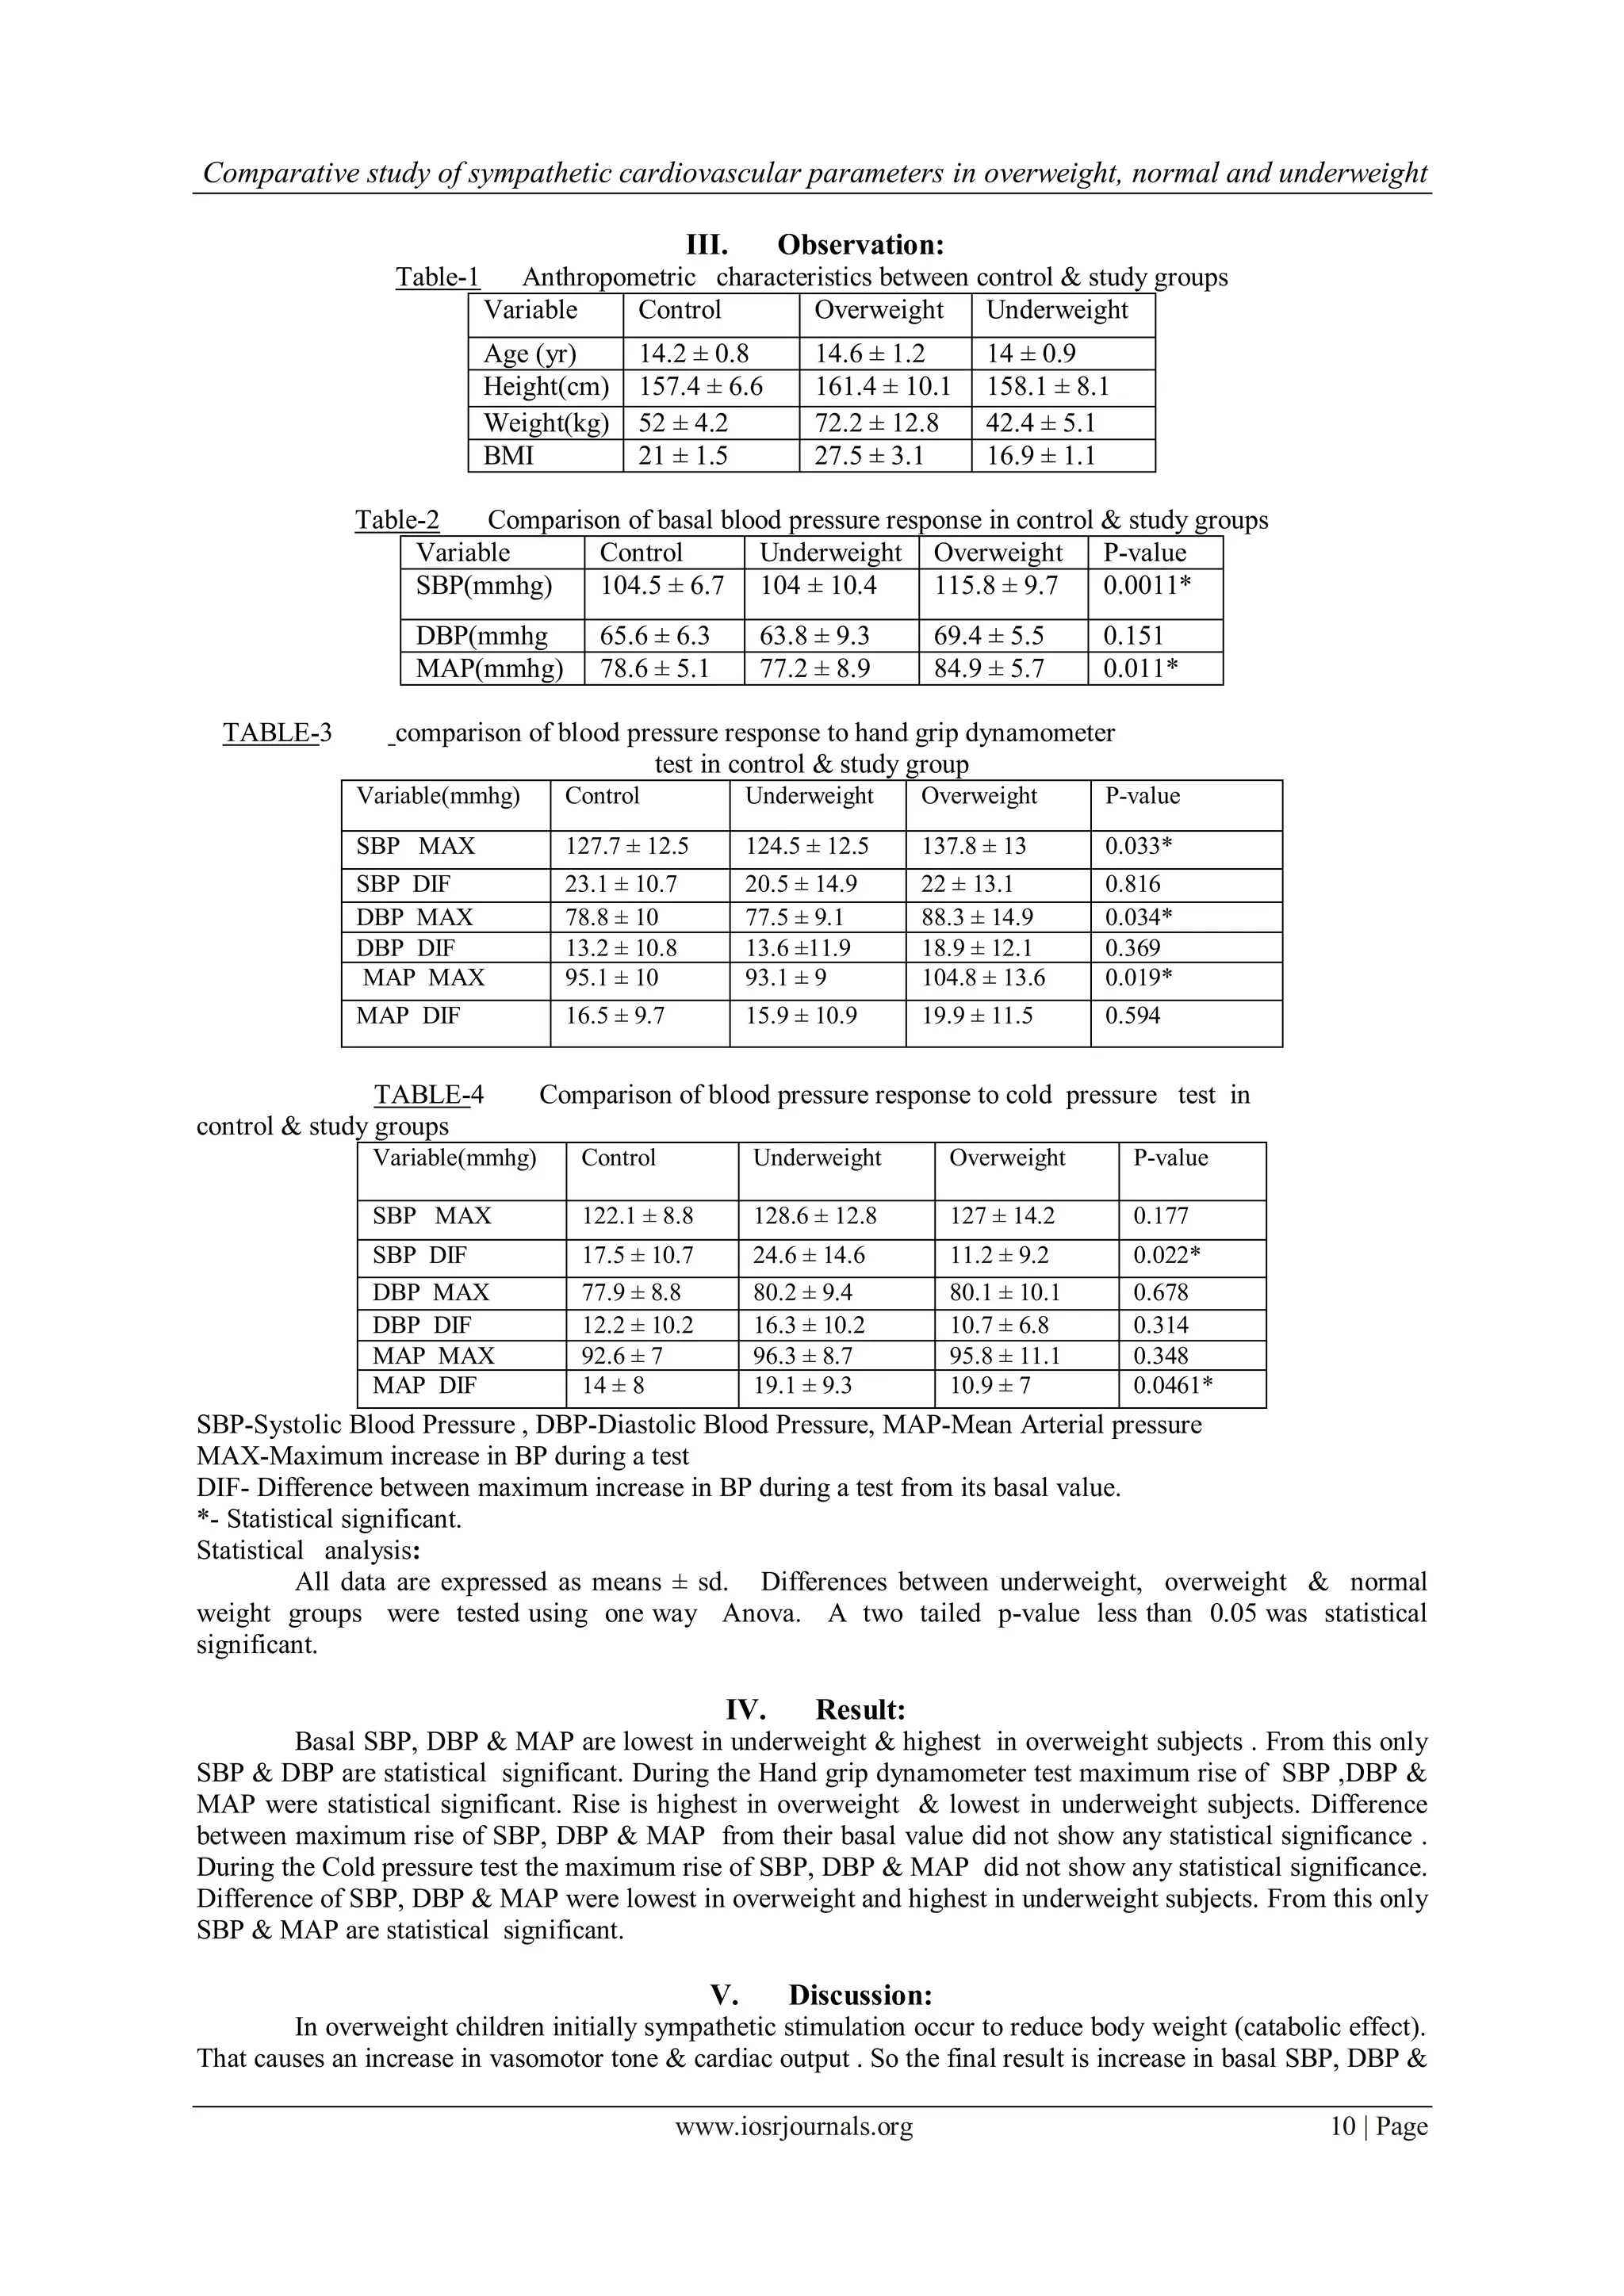
This study compares sympathetic cardiovascular parameters in overweight, underweight, and normal weight schoolboys in Southern Odisha, focusing on age-matched groups aged 12-16. Findings revealed that overweight boys had higher baseline systolic and mean arterial blood pressure compared to their underweight counterparts, with significant differences during exercise tests. The results indicate sympathetic insufficiency in overweight children, highlighting the correlation between autonomic nervous system activity, body weight regulation, and cardiovascular function.