More Related Content


Similar to Index Percentile Distribution Poster


![PERI-PROSTHETIC FRACTURE NAIL-PLATE CONSTRUCT [NPC].pptx](https://cdn.slidesharecdn.com/ss_thumbnails/drarunkumardrmohamedashrafperiprostheticfrasturenail-plateconstructnpc-260209164459-7e9d15a1-thumbnail.jpg?width=640&height=640&fit=bounds)


Index Percentile Distribution Poster
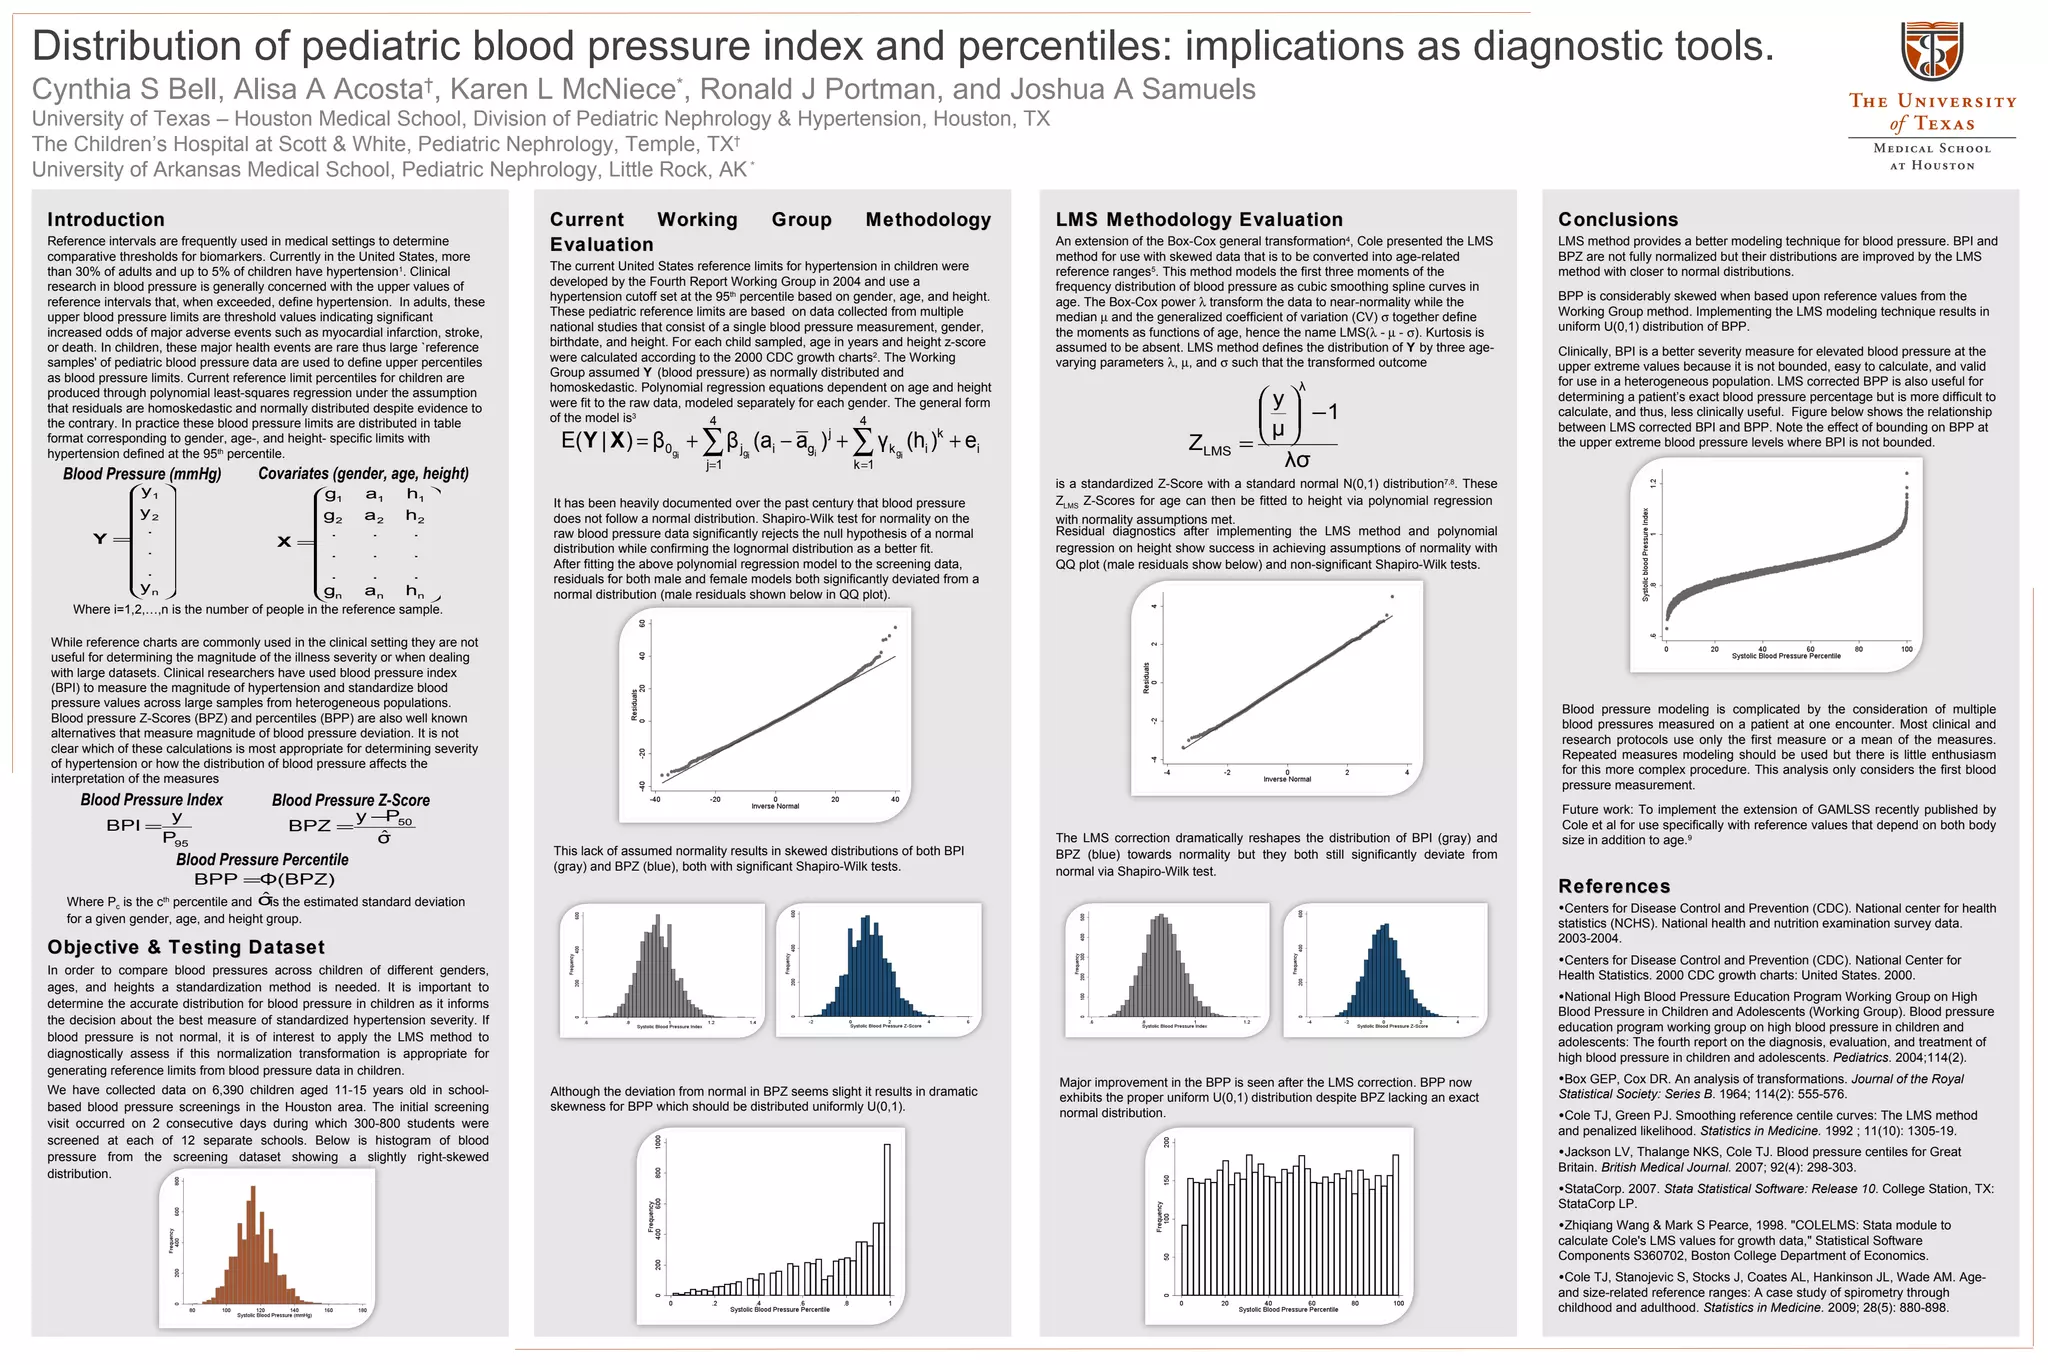
- 1. Cynthia S Bell,Alisa A Acosta † , Karen L McNiece * , Ronald J Portman, and Joshua A Samuels University of Texas – Houston Medical School, Division of Pediatric Nephrology & Hypertension, Houston, TX The Children’s Hospital at Scott & White, Pediatric Nephrology, Temple, TX † University of Arkansas Medical School, Pediatric Nephrology, Little Rock, AK * Distribution of pediatric blood pressure index and percentiles: implications as diagnostic tools. Introduction Reference intervals are frequently used in medical settings to determine comparative thresholds for biomarkers. Currently in the United States, more than 30% of adults and up to 5% of children have hypertension 1 . Clinical research in blood pressure is generally concerned with the upper values of reference intervals that, when exceeded, define hypertension. In adults, these upper blood pressure limits are threshold values indicating significant increased odds of major adverse events such as myocardial infarction, stroke, or death. In children, these major health events are rare thus large `reference samples' of pediatric blood pressure data are used to define upper percentiles as blood pressure limits. Current reference limit percentiles for children are produced through polynomial least-squares regression under the assumption that residuals are homoskedastic and normally distributed despite evidence to the contrary. In practice these blood pressure limits are distributed in table format corresponding to gender, age-, and height- specific limits with hypertension defined at the 95 th percentile. LMS Methodology Evaluation An extension of the Box-Cox general transformation 4 , Cole presented the LMS method for use with skewed data that is to be converted into age-related reference ranges 5 . This method models the first three moments of the frequency distribution of blood pressure as cubic smoothing spline curves in age. The Box-Cox power transform the data to near-normality while the median and the generalized coefficient of variation (CV) together define the moments as functions of age, hence the name LMS( - - ). Kurtosis is assumed to be absent. LMS method defines the distribution of Y by three age-varying parameters , , and such that the transformed outcome Current Working Group Methodology Evaluation The current United States reference limits for hypertension in children were developed by the Fourth Report Working Group in 2004 and use a hypertension cutoff set at the 95 th percentile based on gender, age, and height. These pediatric reference limits are based on data collected from multiple national studies that consist of a single blood pressure measurement, gender, birthdate, and height. For each child sampled, age in years and height z-score were calculated according to the 2000 CDC growth charts 2 . The Working Group assumed Y (blood pressure) as normally distributed and homoskedastic. Polynomial regression equations dependent on age and height were fit to the raw data, modeled separately for each gender. The general form of the model is 3 Conclusions LMS method provides a better modeling technique for blood pressure. BPI and BPZ are not fully normalized but their distributions are improved by the LMS method with closer to normal distributions. BPP is considerably skewed when based upon reference values from the Working Group method. Implementing the LMS modeling technique results in uniform U(0,1) distribution of BPP. Clinically, BPI is a better severity measure for elevated blood pressure at the upper extreme values because it is not bounded, easy to calculate, and valid for use in a heterogeneous population. LMS corrected BPP is also useful for determining a patient’s exact blood pressure percentage but is more difficult to calculate, and thus, less clinically useful. Figure below shows the relationship between LMS corrected BPI and BPP. Note the effect of bounding on BPP at the upper extreme blood pressure levels where BPI is not bounded. While reference charts are commonly used in the clinical setting they are not useful for determining the magnitude of the illness severity or when dealing with large datasets. Clinical researchers have used blood pressure index (BPI) to measure the magnitude of hypertension and standardize blood pressure values across large samples from heterogeneous populations. Blood pressure Z-Scores (BPZ) and percentiles (BPP) are also well known alternatives that measure magnitude of blood pressure deviation. It is not clear which of these calculations is most appropriate for determining severity of hypertension or how the distribution of blood pressure affects the interpretation of the measures Objective & Testing Dataset In order to compare blood pressures across children of different genders, ages, and heights a standardization method is needed. It is important to determine the accurate distribution for blood pressure in children as it informs the decision about the best measure of standardized hypertension severity. If blood pressure is not normal, it is of interest to apply the LMS method to diagnostically assess if this normalization transformation is appropriate for generating reference limits from blood pressure data in children. We have collected data on 6,390 children aged 11-15 years old in school-based blood pressure screenings in the Houston area. The initial screening visit occurred on 2 consecutive days during which 300-800 students were screened at each of 12 separate schools. Below is h istogram of blood pressure from the screening dataset showing a slightly right-skewed distribution. It has been heavily documented over the past century that blood pressure does not follow a normal distribution. Shapiro-Wilk test for normality on the raw blood pressure data significantly rejects the null hypothesis of a normal distribution while confirming the lognormal distribution as a better fit. After fitting the above polynomial regression model to the screening data, residuals for both male and female models both significantly deviated from a normal distribution (male residuals shown below in QQ plot). This lack of assumed normality results in skewed distributions of both BPI (gray) and BPZ (blue), both with significant Shapiro-Wilk tests. is a standardized Z-Score with a standard normal N(0,1) distribution 7,8 . These Z LMS Z-Scores for age can then be fitted to height via polynomial regression with normality assumptions met. Residual diagnostics after implementing the LMS method and polynomial regression on height show success in achieving assumptions of normality with QQ plot (male residuals show below) and non-significant Shapiro-Wilk tests. The LMS correction dramatically reshapes the distribution of BPI (gray) and BPZ (blue) towards normality but they both still significantly deviate from normal via Shapiro-Wilk test. References Centers for Disease Control and Prevention (CDC). National center for health statistics (NCHS). National health and nutrition examination survey data. 2003-2004. Centers for Disease Control and Prevention (CDC). National Center for Health Statistics. 2000 CDC growth charts: United States. 2000. National High Blood Pressure Education Program Working Group on High Blood Pressure in Children and Adolescents (Working Group). Blood pressure education program working group on high blood pressure in children and adolescents: The fourth report on the diagnosis, evaluation, and treatment of high blood pressure in children and adolescents. Pediatrics . 2004;114(2). Box GEP, Cox DR. An analysis of transformations. Journal of the Royal Statistical Society: Series B . 1964; 114(2): 555-576. Cole TJ, Green PJ. Smoothing reference centile curves: The LMS method and penalized likelihood. Statistics in Medicine. 1992 ; 11(10): 1305-19. Jackson LV, Thalange NKS, Cole TJ. Blood pressure centiles for Great Britain. British Medical Journal. 2007; 92(4): 298-303. StataCorp. 2007. Stata Statistical Software: Release 10 . College Station, TX: StataCorp LP. Zhiqiang Wang & Mark S Pearce, 1998. "COLELMS: Stata module to calculate Cole's LMS values for growth data," Statistical Software Components S360702, Boston College Department of Economics. Cole TJ, Stanojevic S, Stocks J, Coates AL, Hankinson JL, Wade AM. Age- and size-related reference ranges: A case study of spirometry through childhood and adulthood. Statistics in Medicine. 2009; 28(5): 880-898. Blood pressure modeling is complicated by the consideration of multiple blood pressures measured on a patient at one encounter. Most clinical and research protocols use only the first measure or a mean of the measures. Repeated measures modeling should be used but there is little enthusiasm for this more complex procedure. This analysis only considers the first blood pressure measurement. Future work: To implement the extension of GAMLSS recently published by Cole et al for use specifically with reference values that depend on both body size in addition to age. 9 Although the deviation from normal in BPZ seems slight it results in dramatic skewness for BPP which should be distributed uniformly U(0,1). Major improvement in the BPP is seen after the LMS correction. BPP now exhibits the proper uniform U(0,1) distribution despite BPZ lacking an exact normal distribution. Blood Pressure Index Blood Pressure Z-Score Blood Pressure (mmHg) Covariates (gender, age, height) Where i=1,2,…,n is the number of people in the reference sample. Where P c is the c th percentile and is the estimated standard deviation for a given gender, age, and height group. Blood Pressure Percentile