Download to read offline


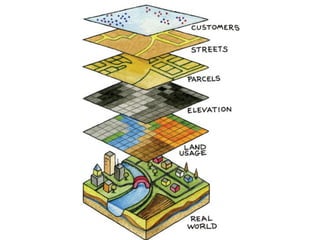
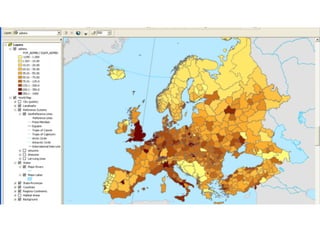


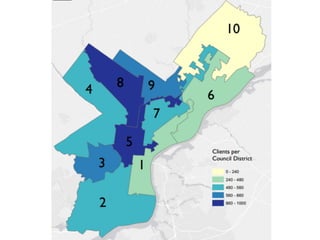
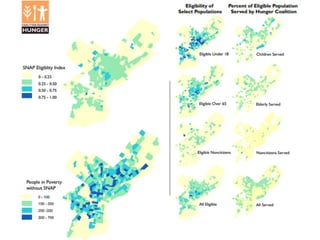
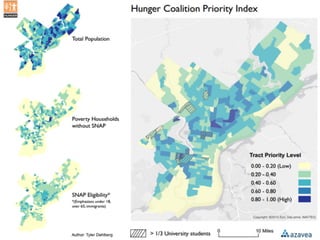
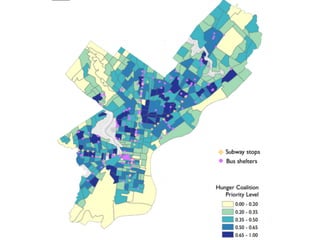


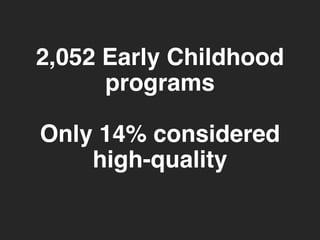


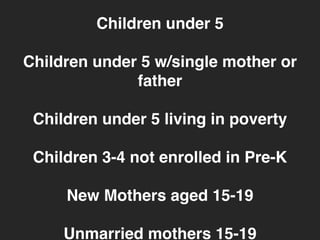
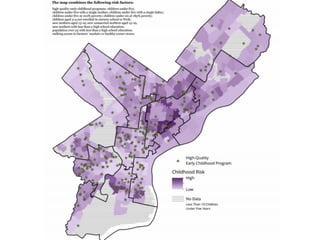
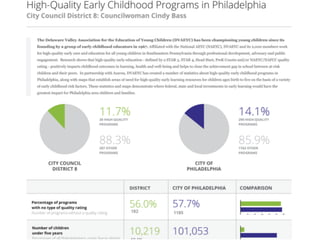
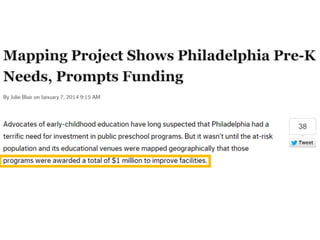
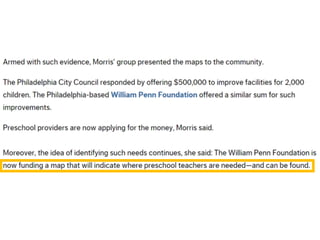
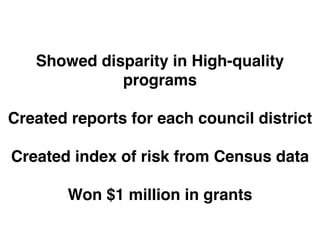


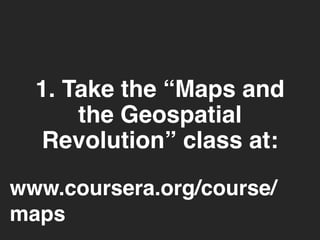
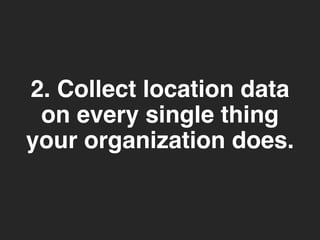

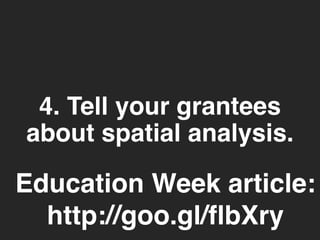


The document discusses how spatial analysis and mapping can help organizations better understand data and make decisions. It provides examples of how mapping has helped address issues like crime, food access, and early childhood education. The document encourages organizations to think spatially and collect location data, and provides tips on getting started with spatial analysis.


![[Archived Webinar, Sept. 2015] Best Practices: Ad Sales for Community News St...](https://cdn.slidesharecdn.com/ss_thumbnails/adsalesmclellan09152015v2-150915215141-lva1-app6891-thumbnail.jpg?width=640&height=640&fit=bounds)


