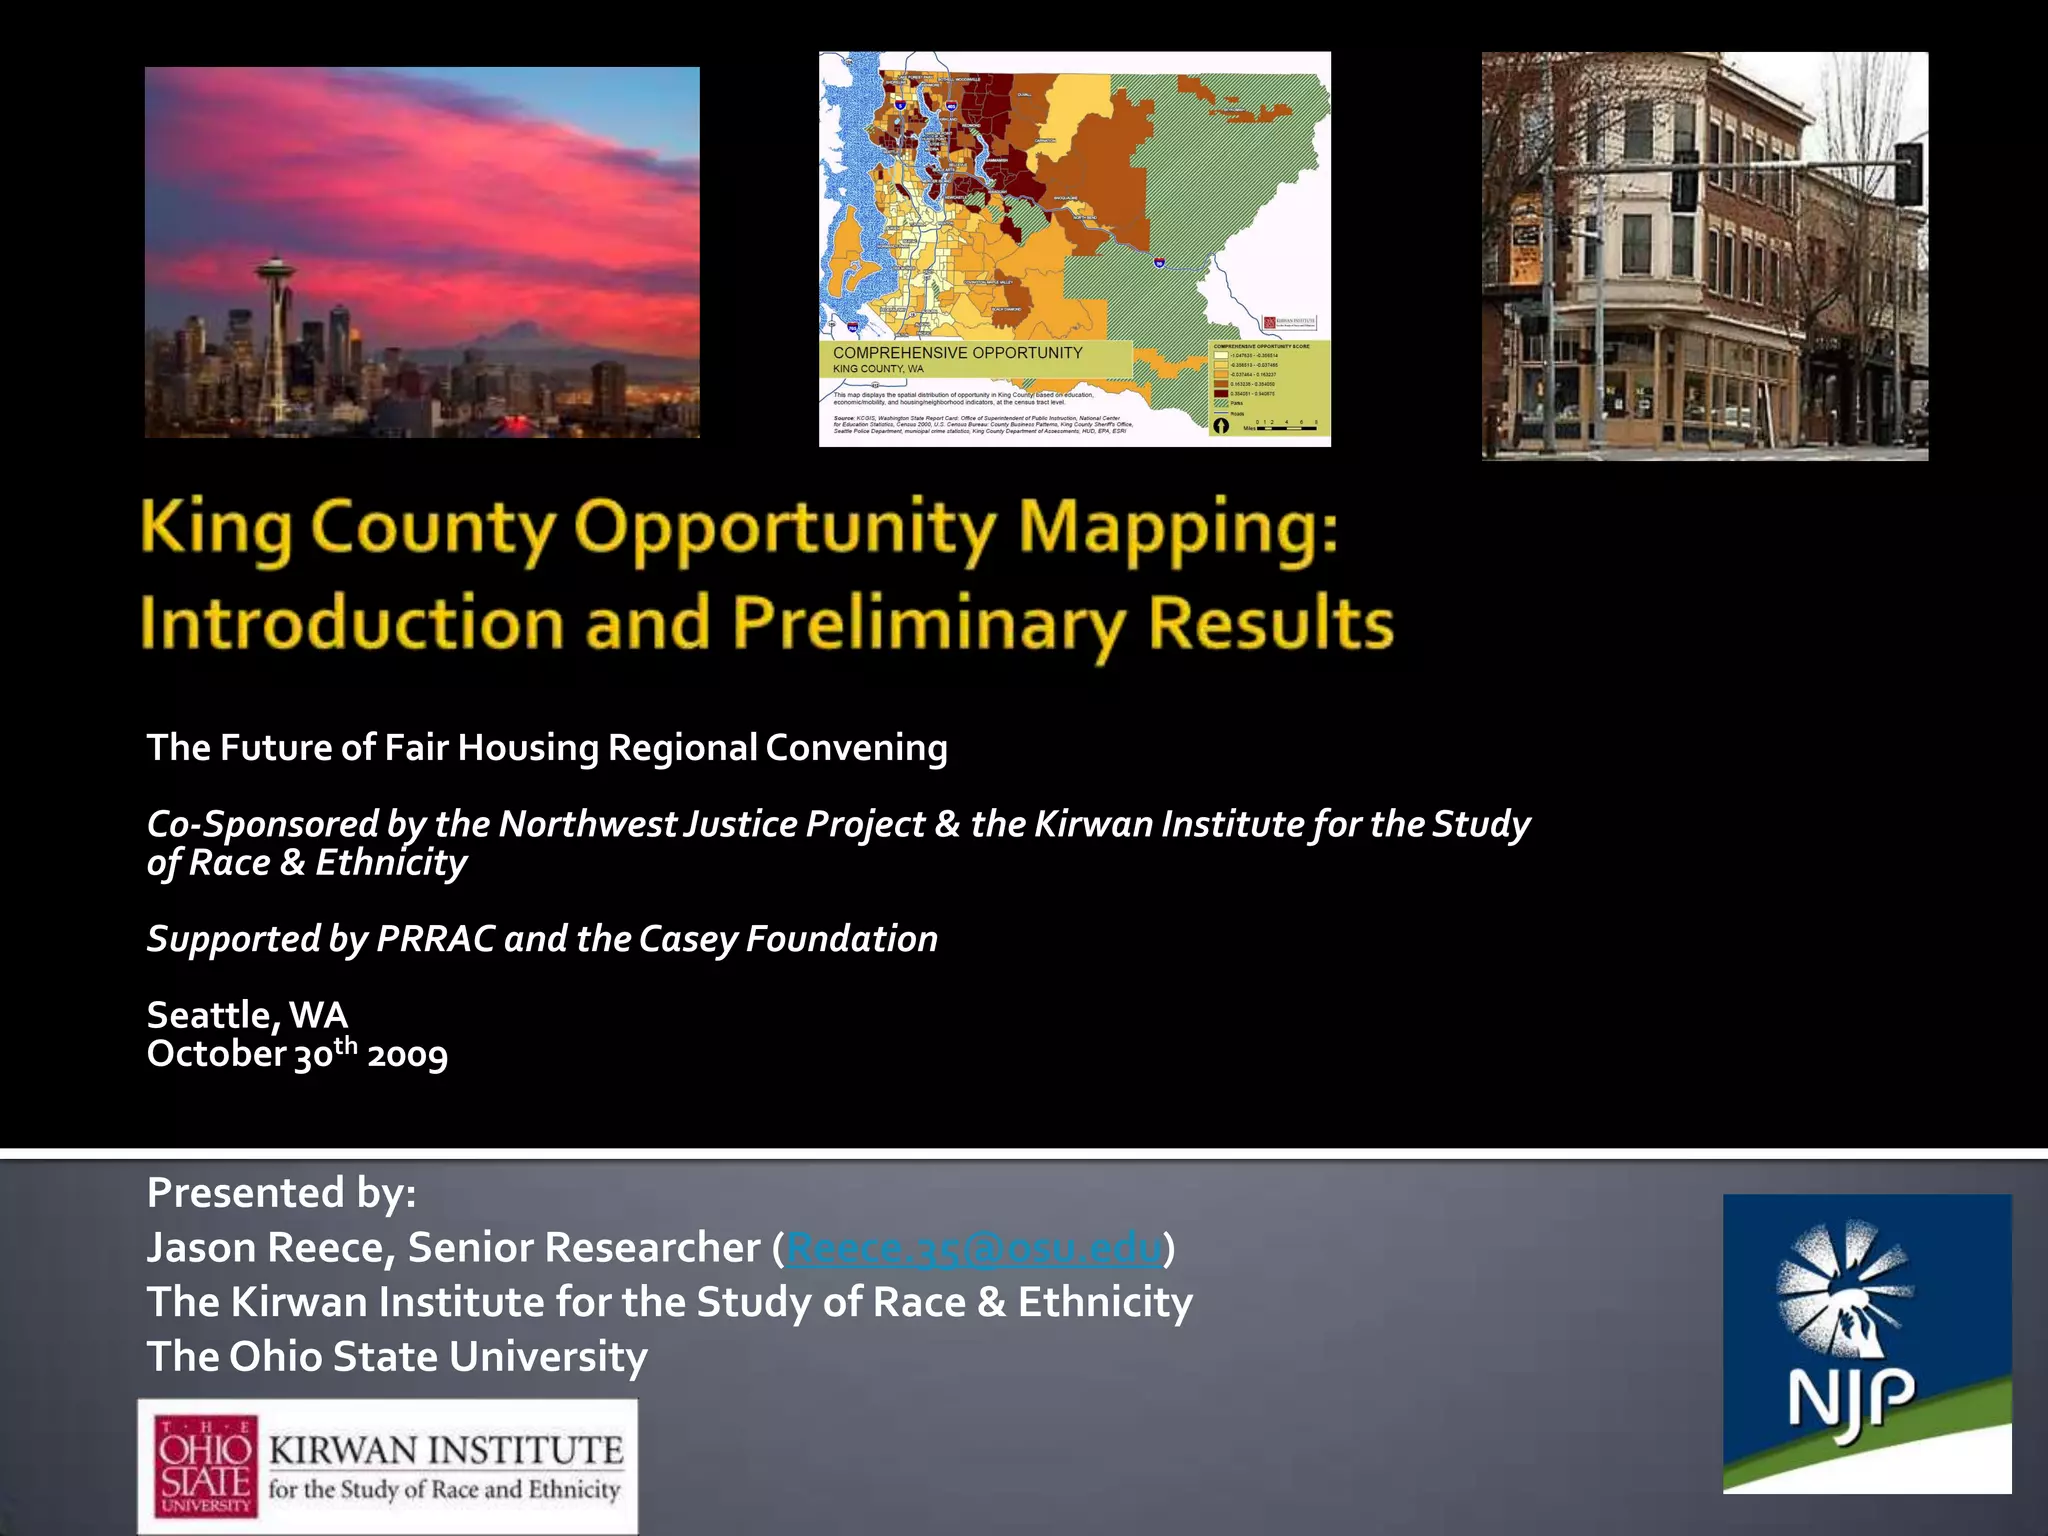
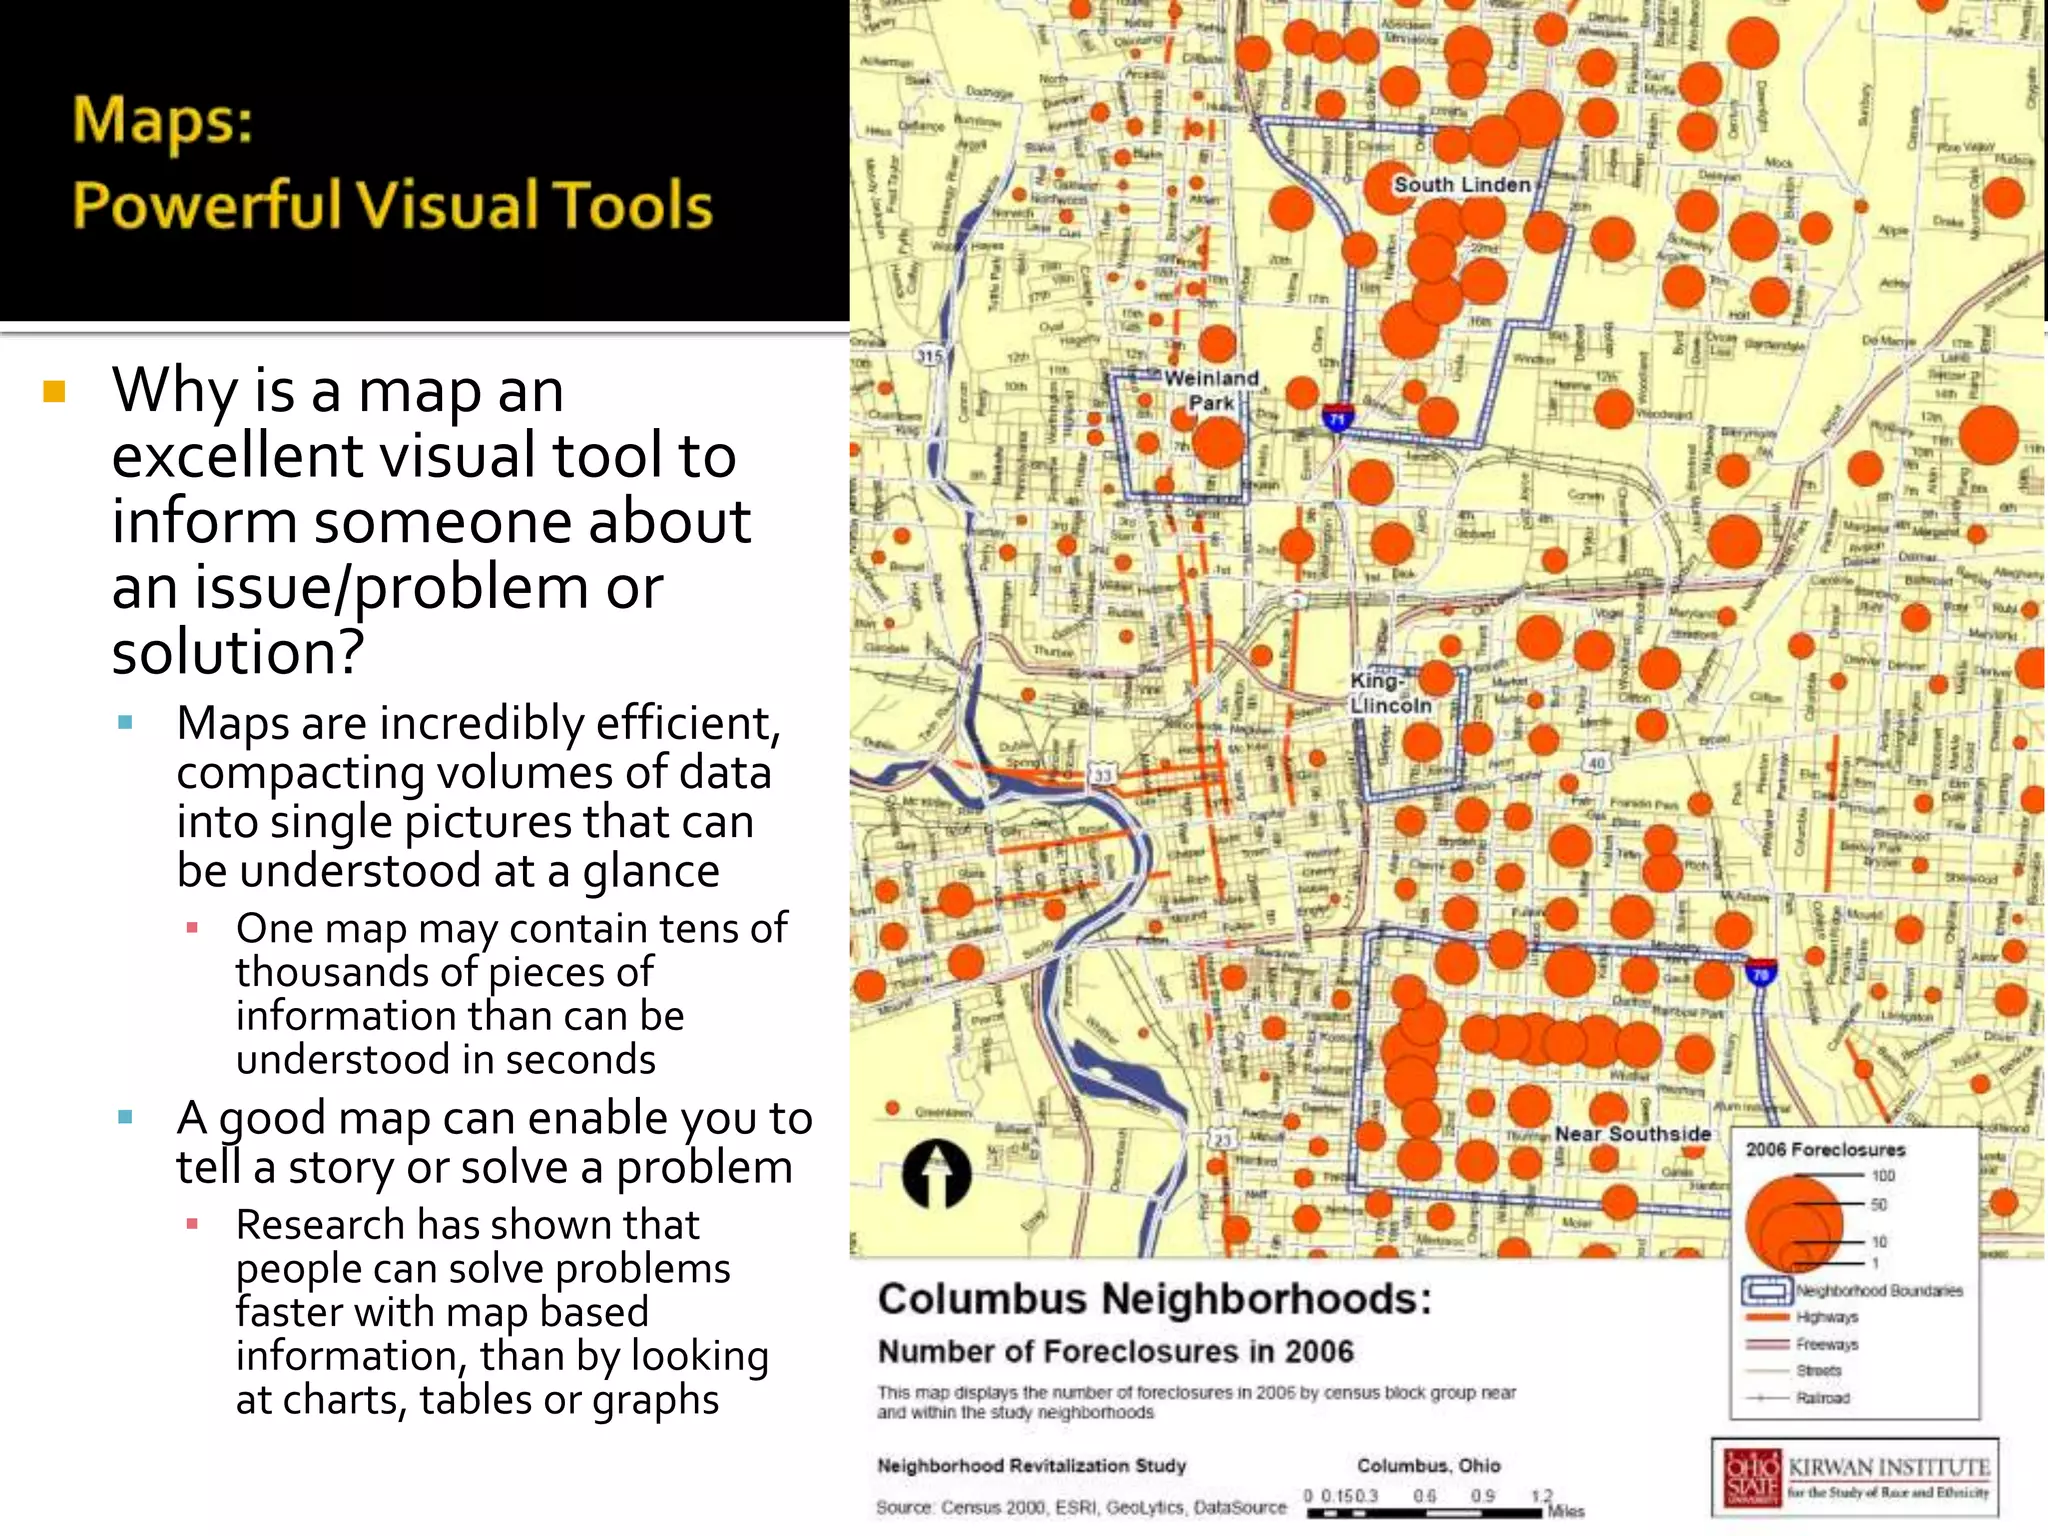
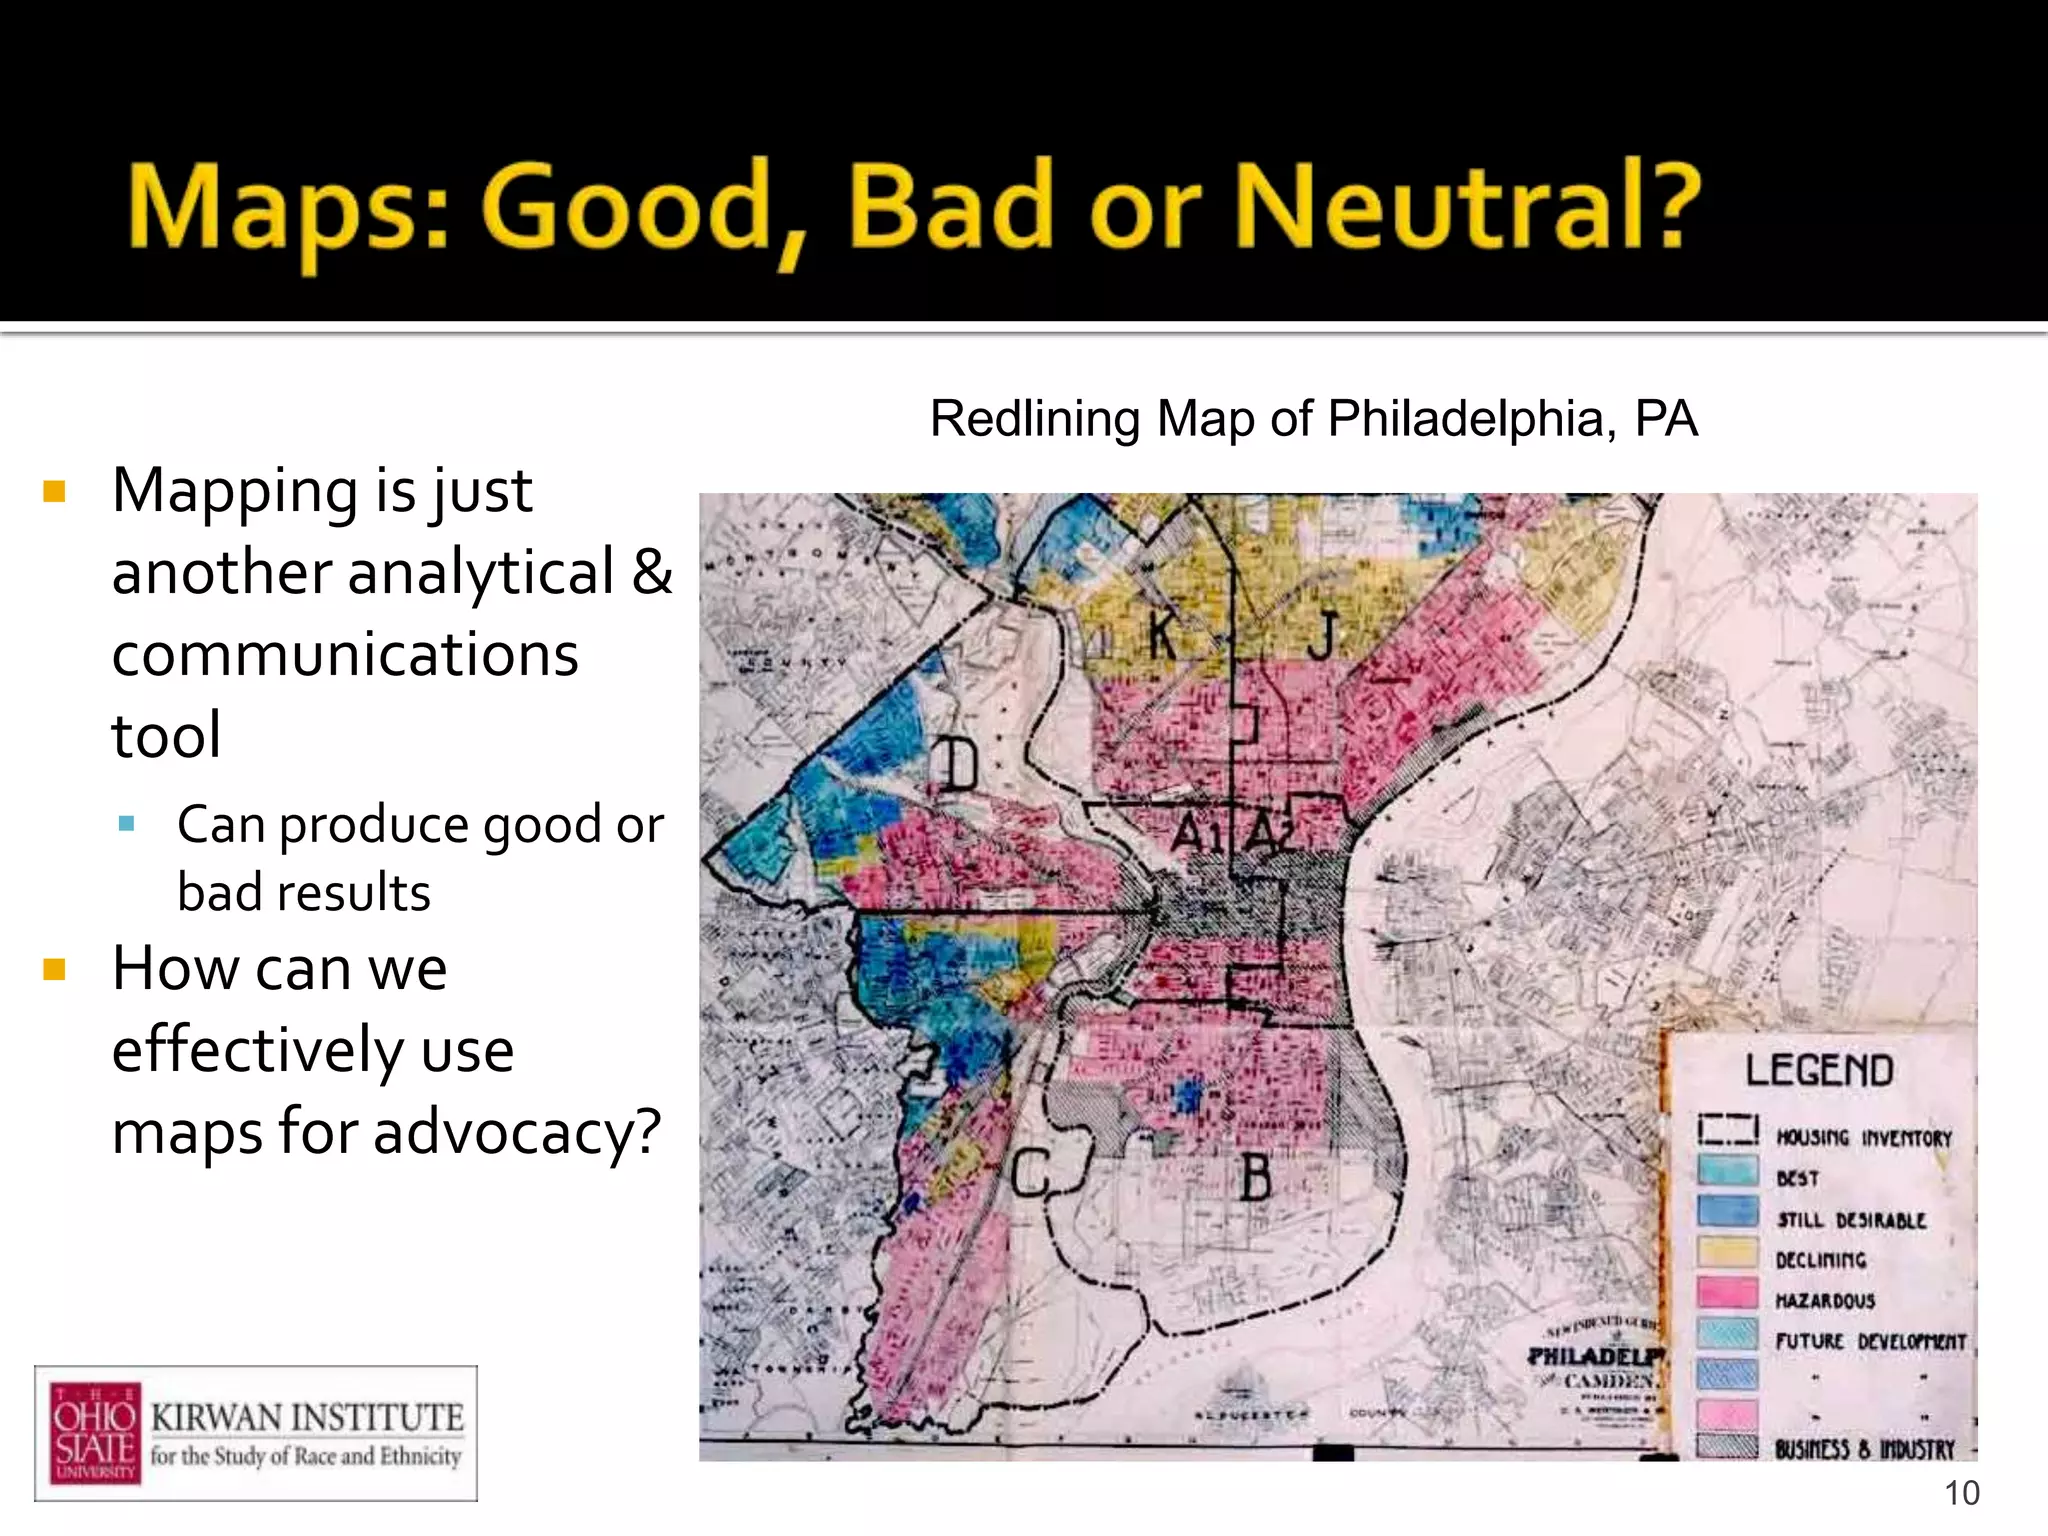
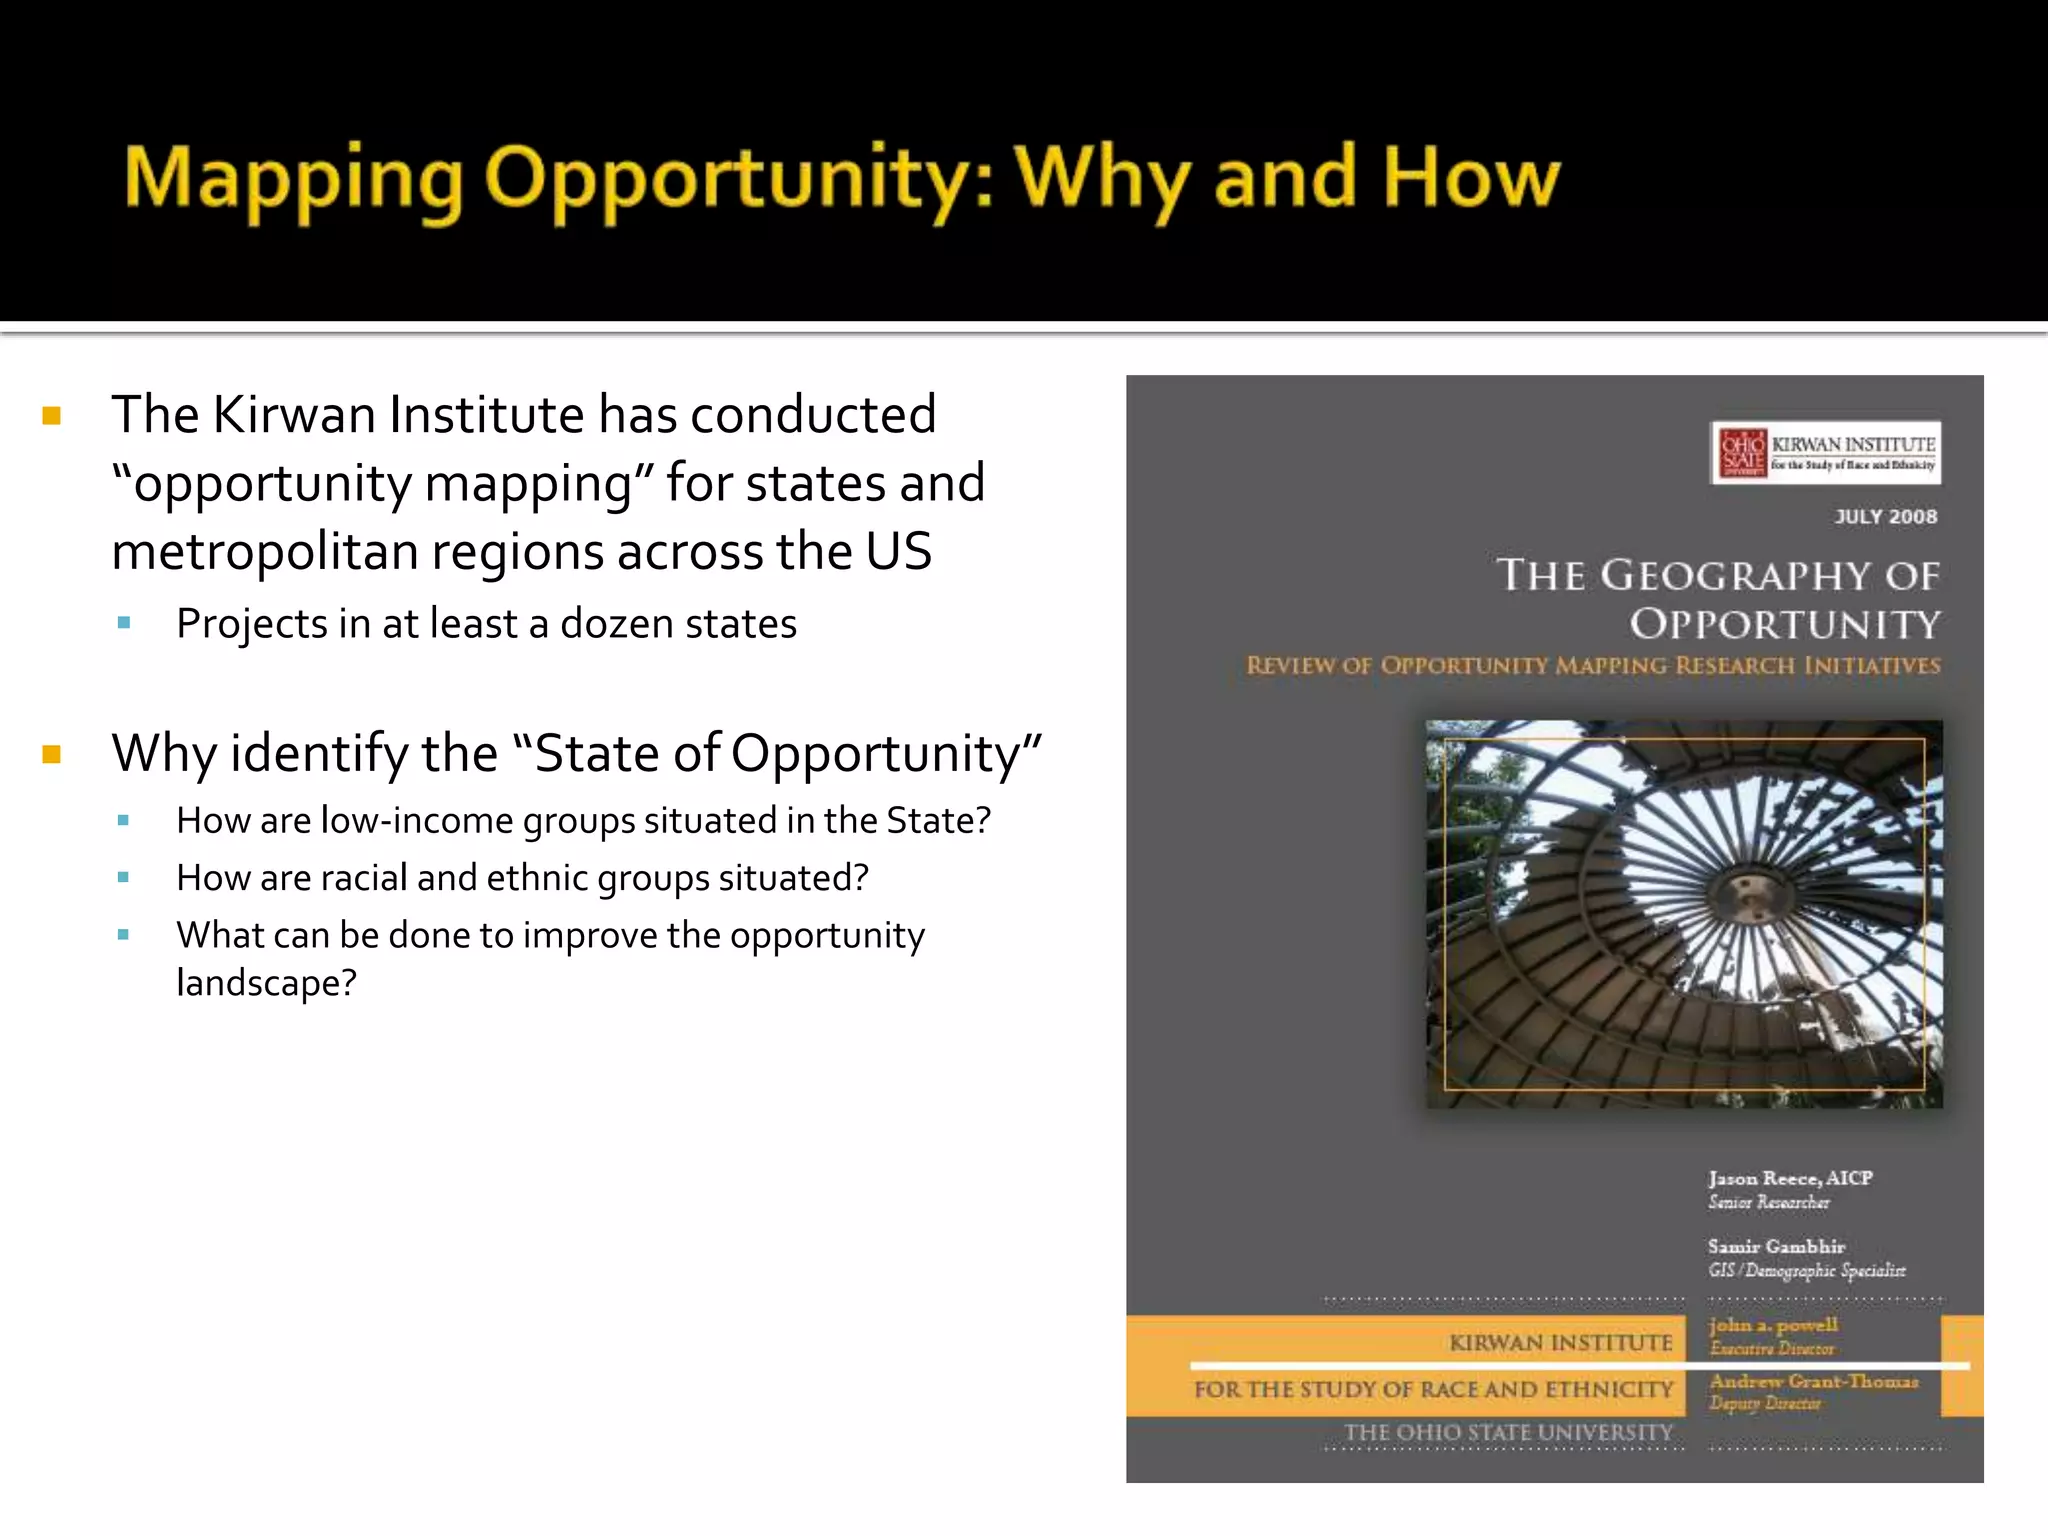
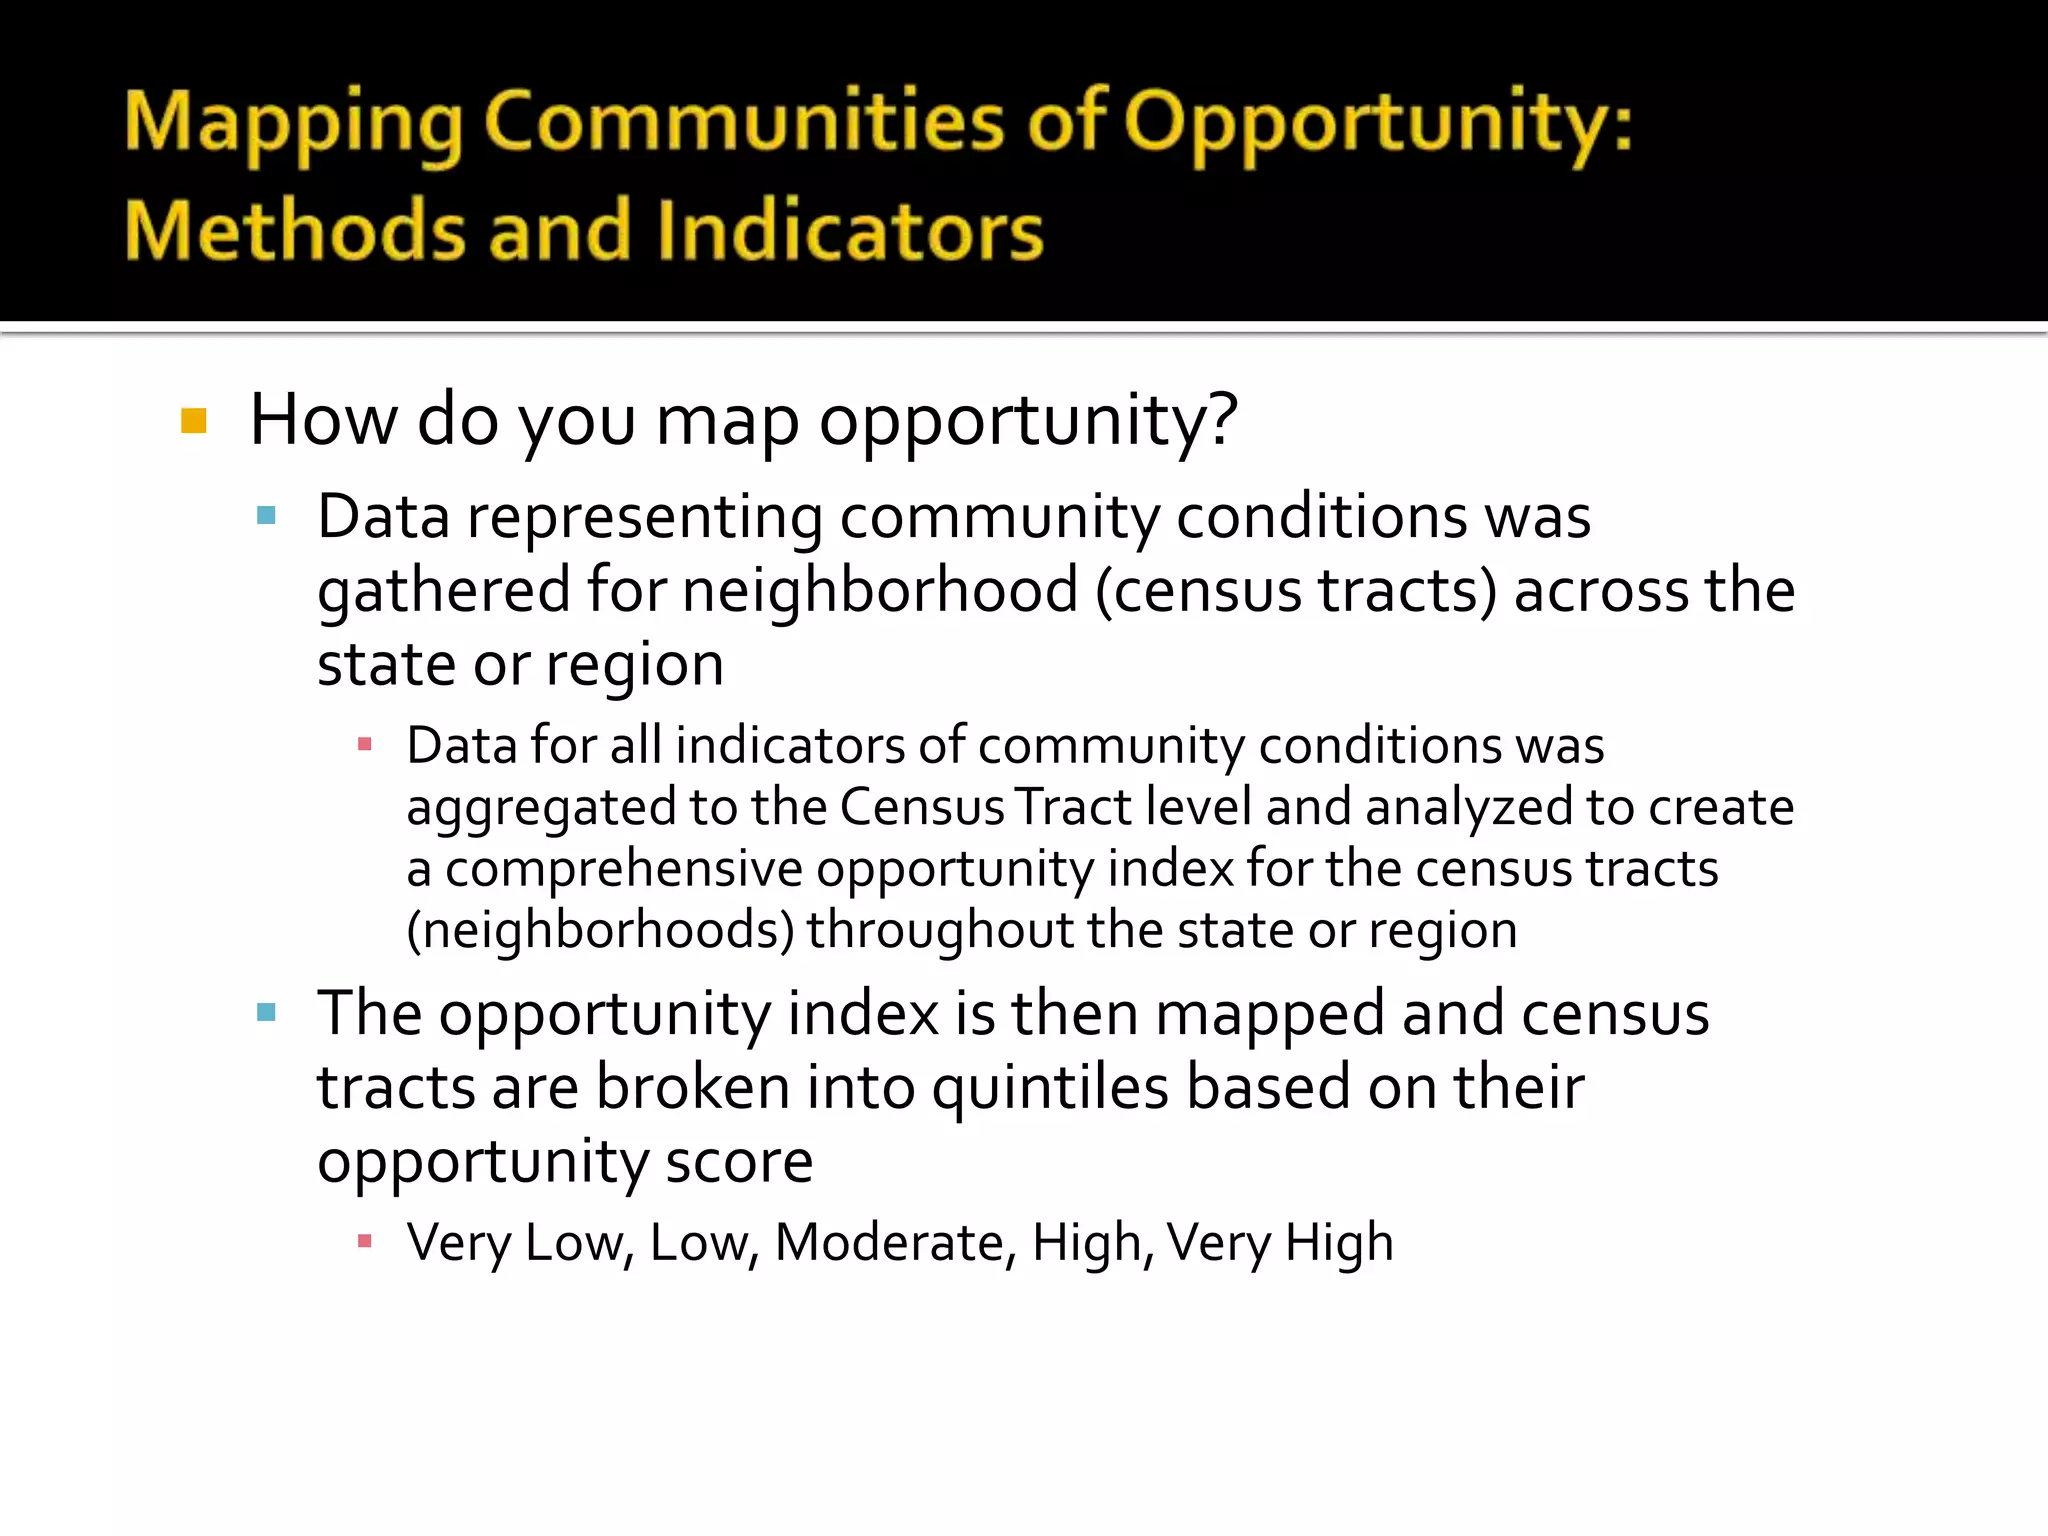
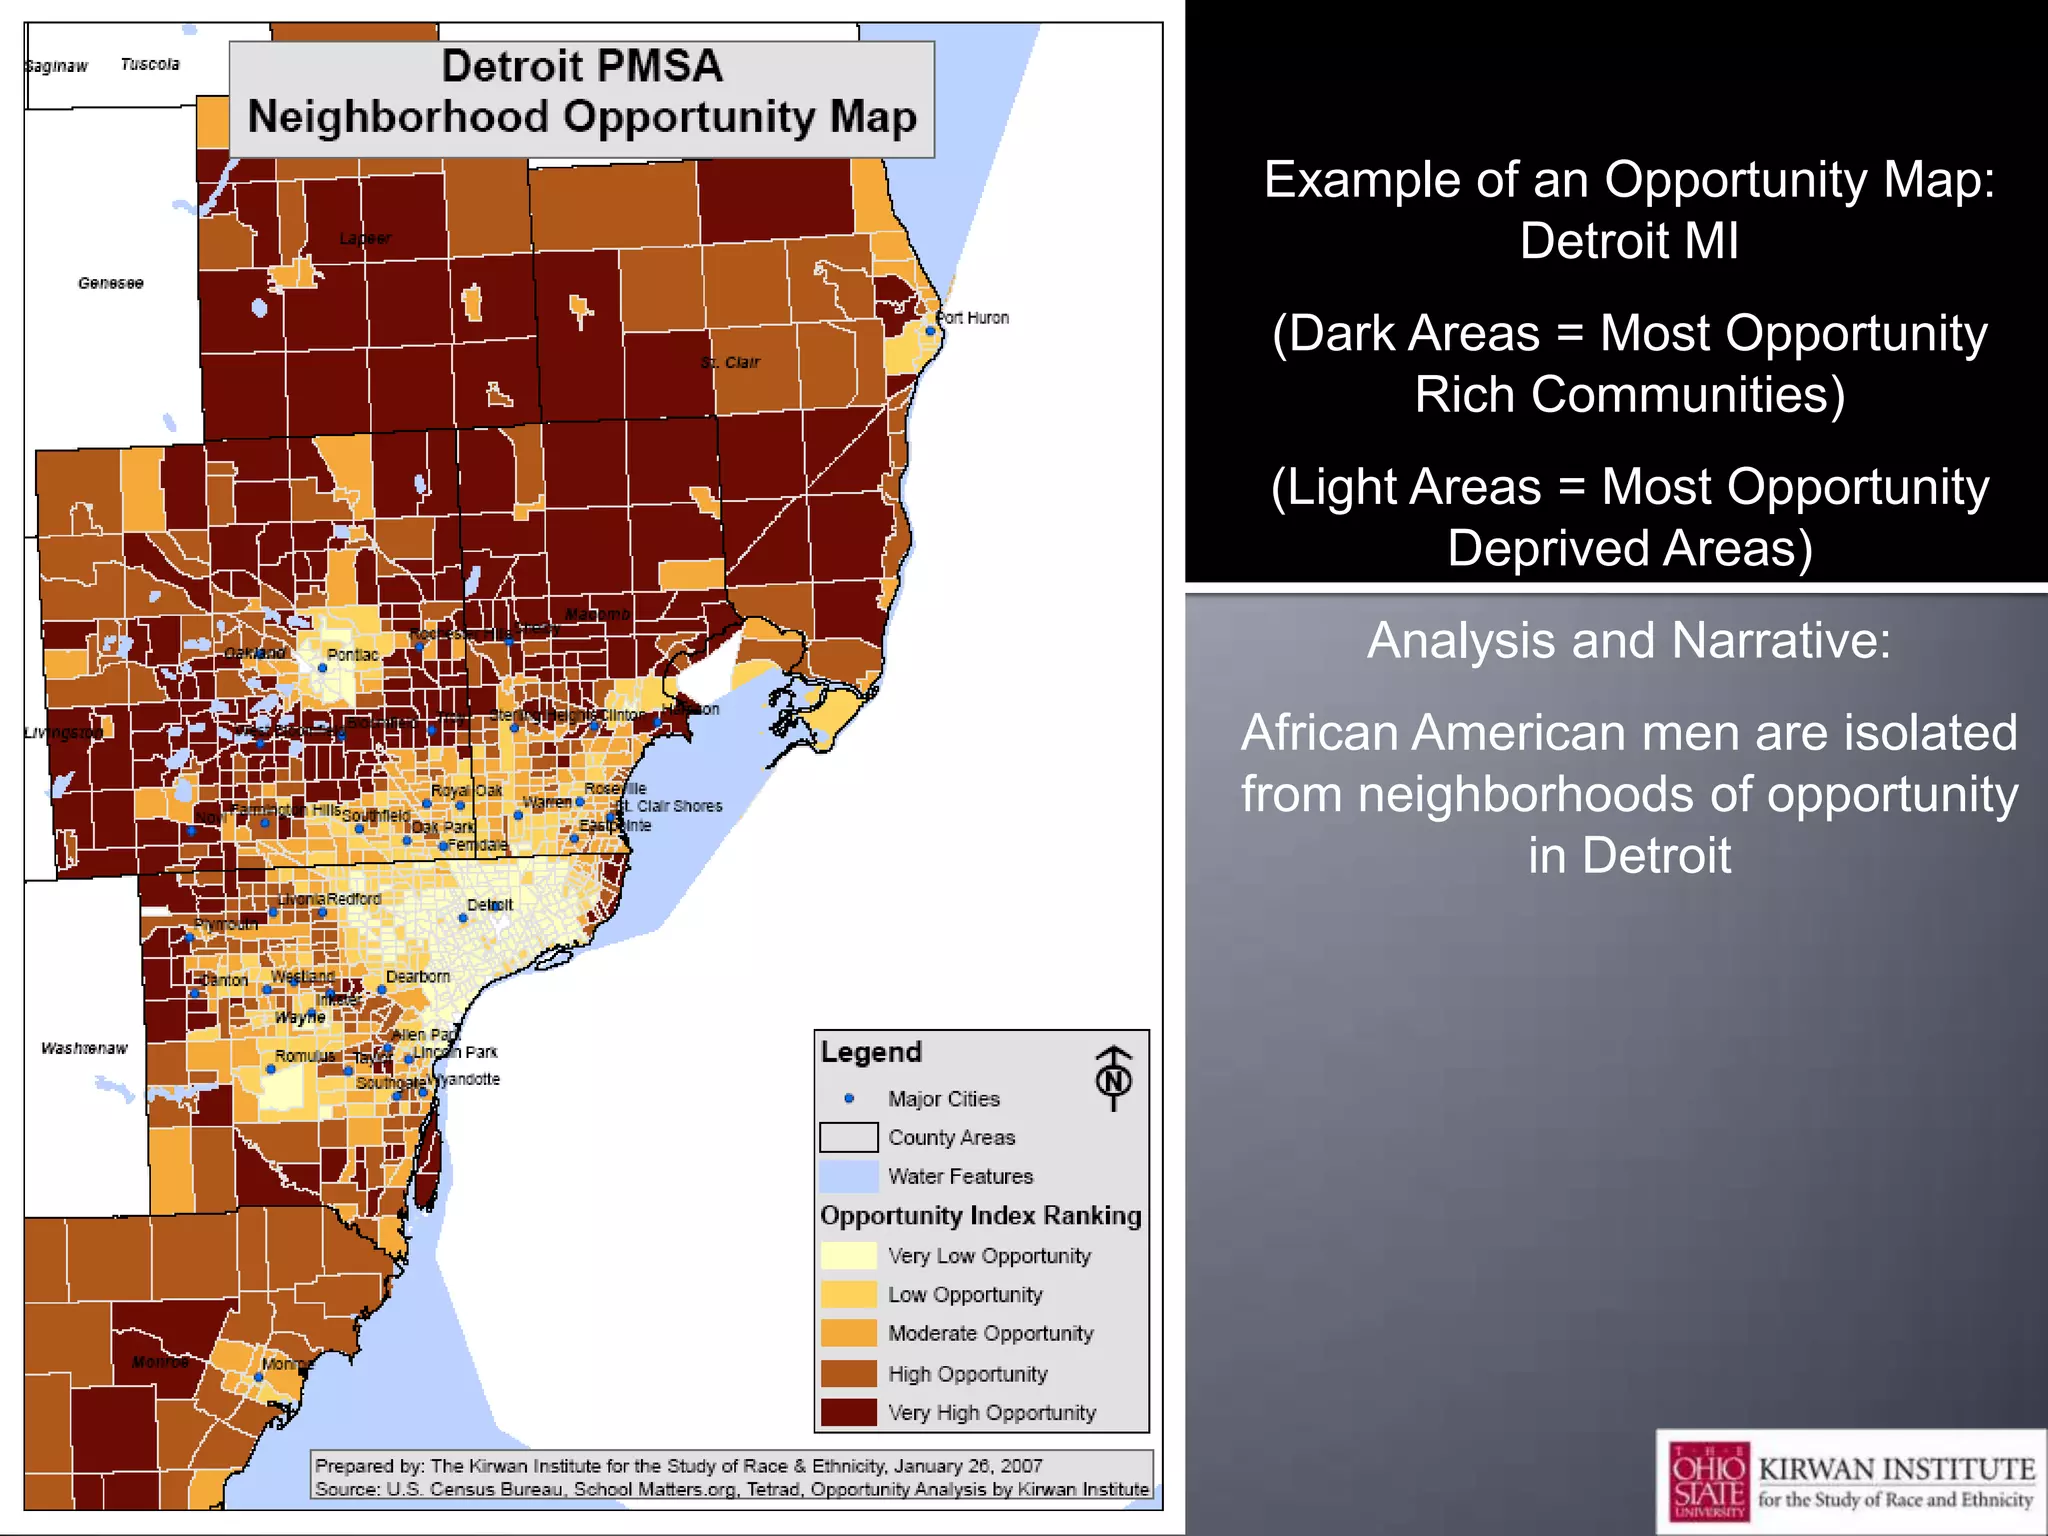
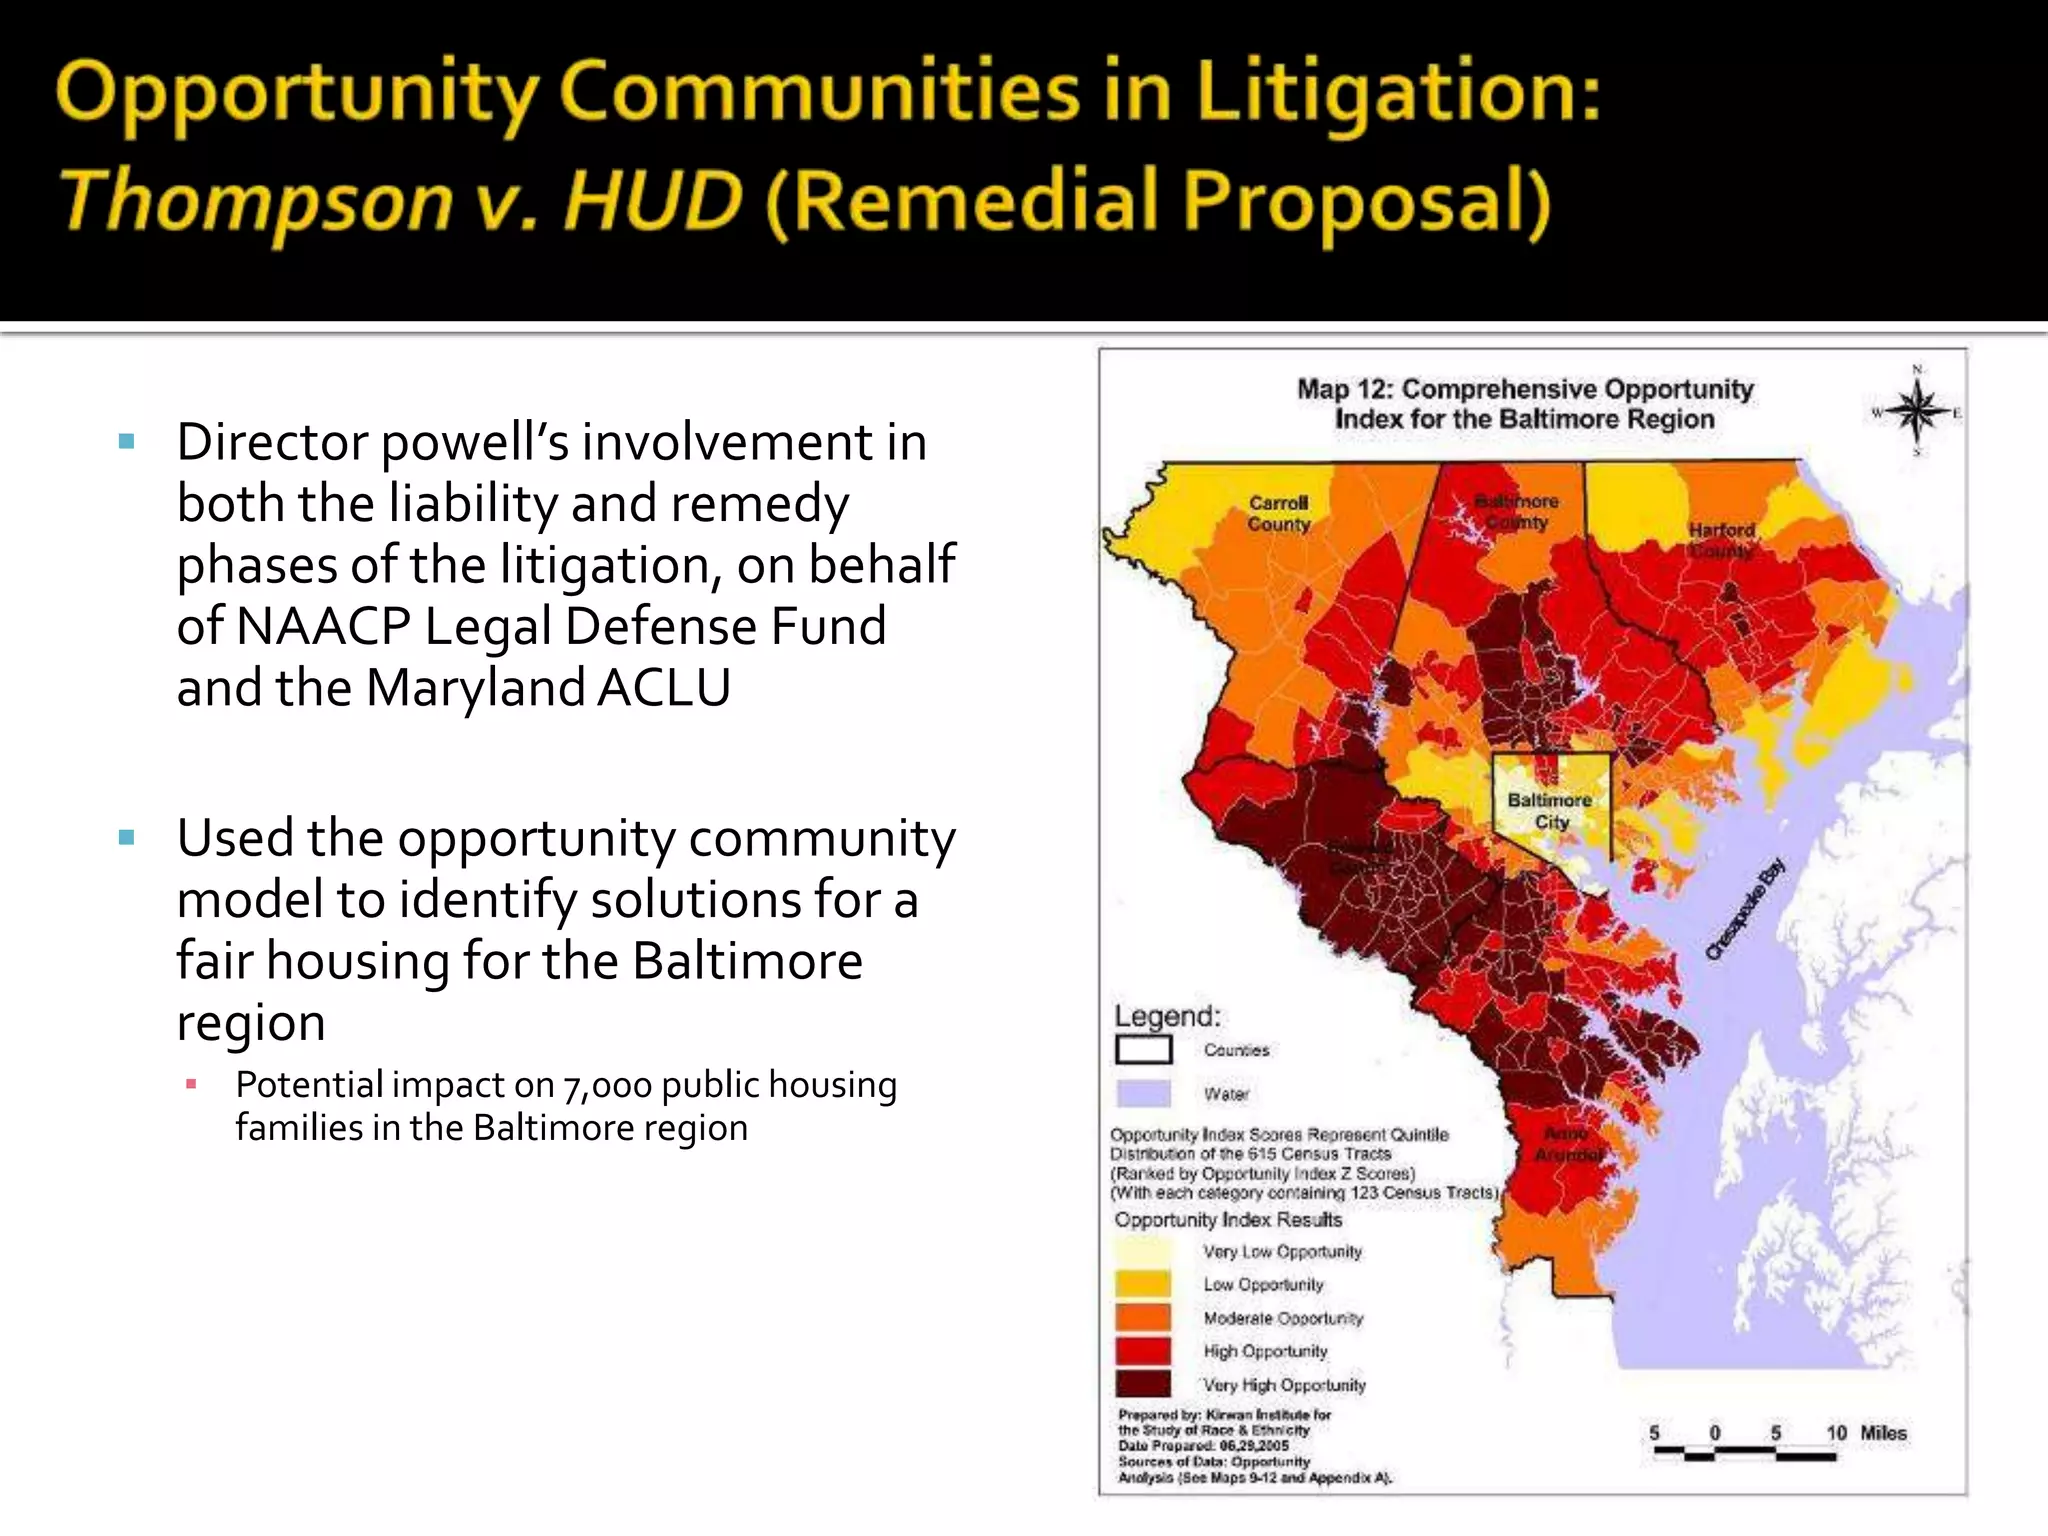
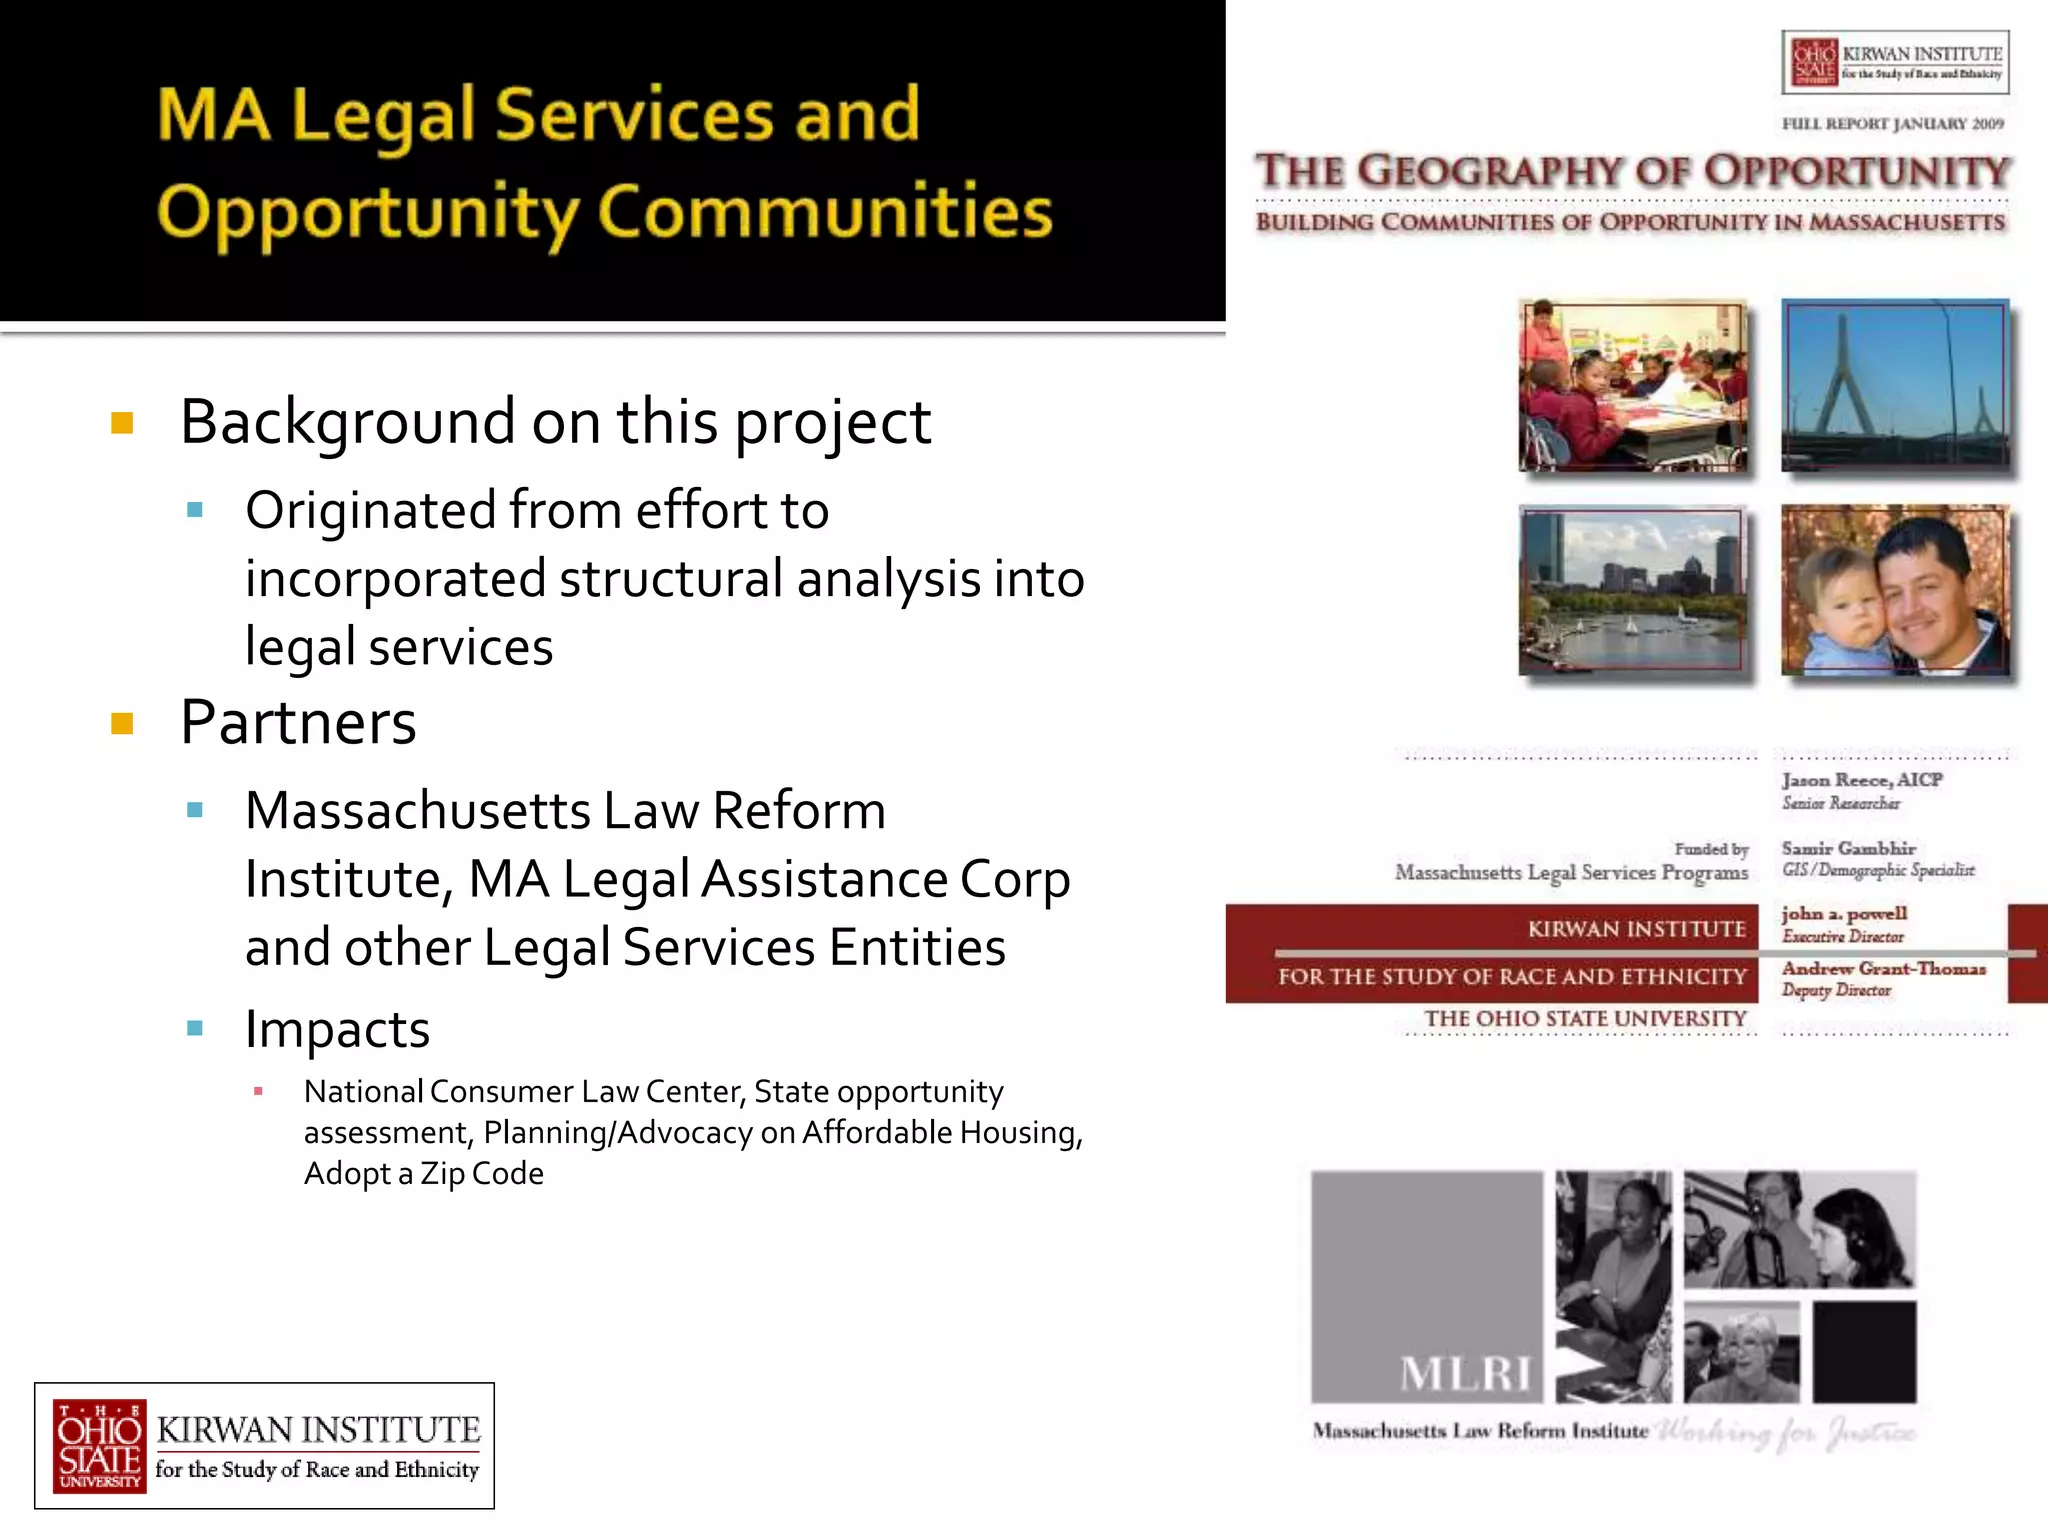
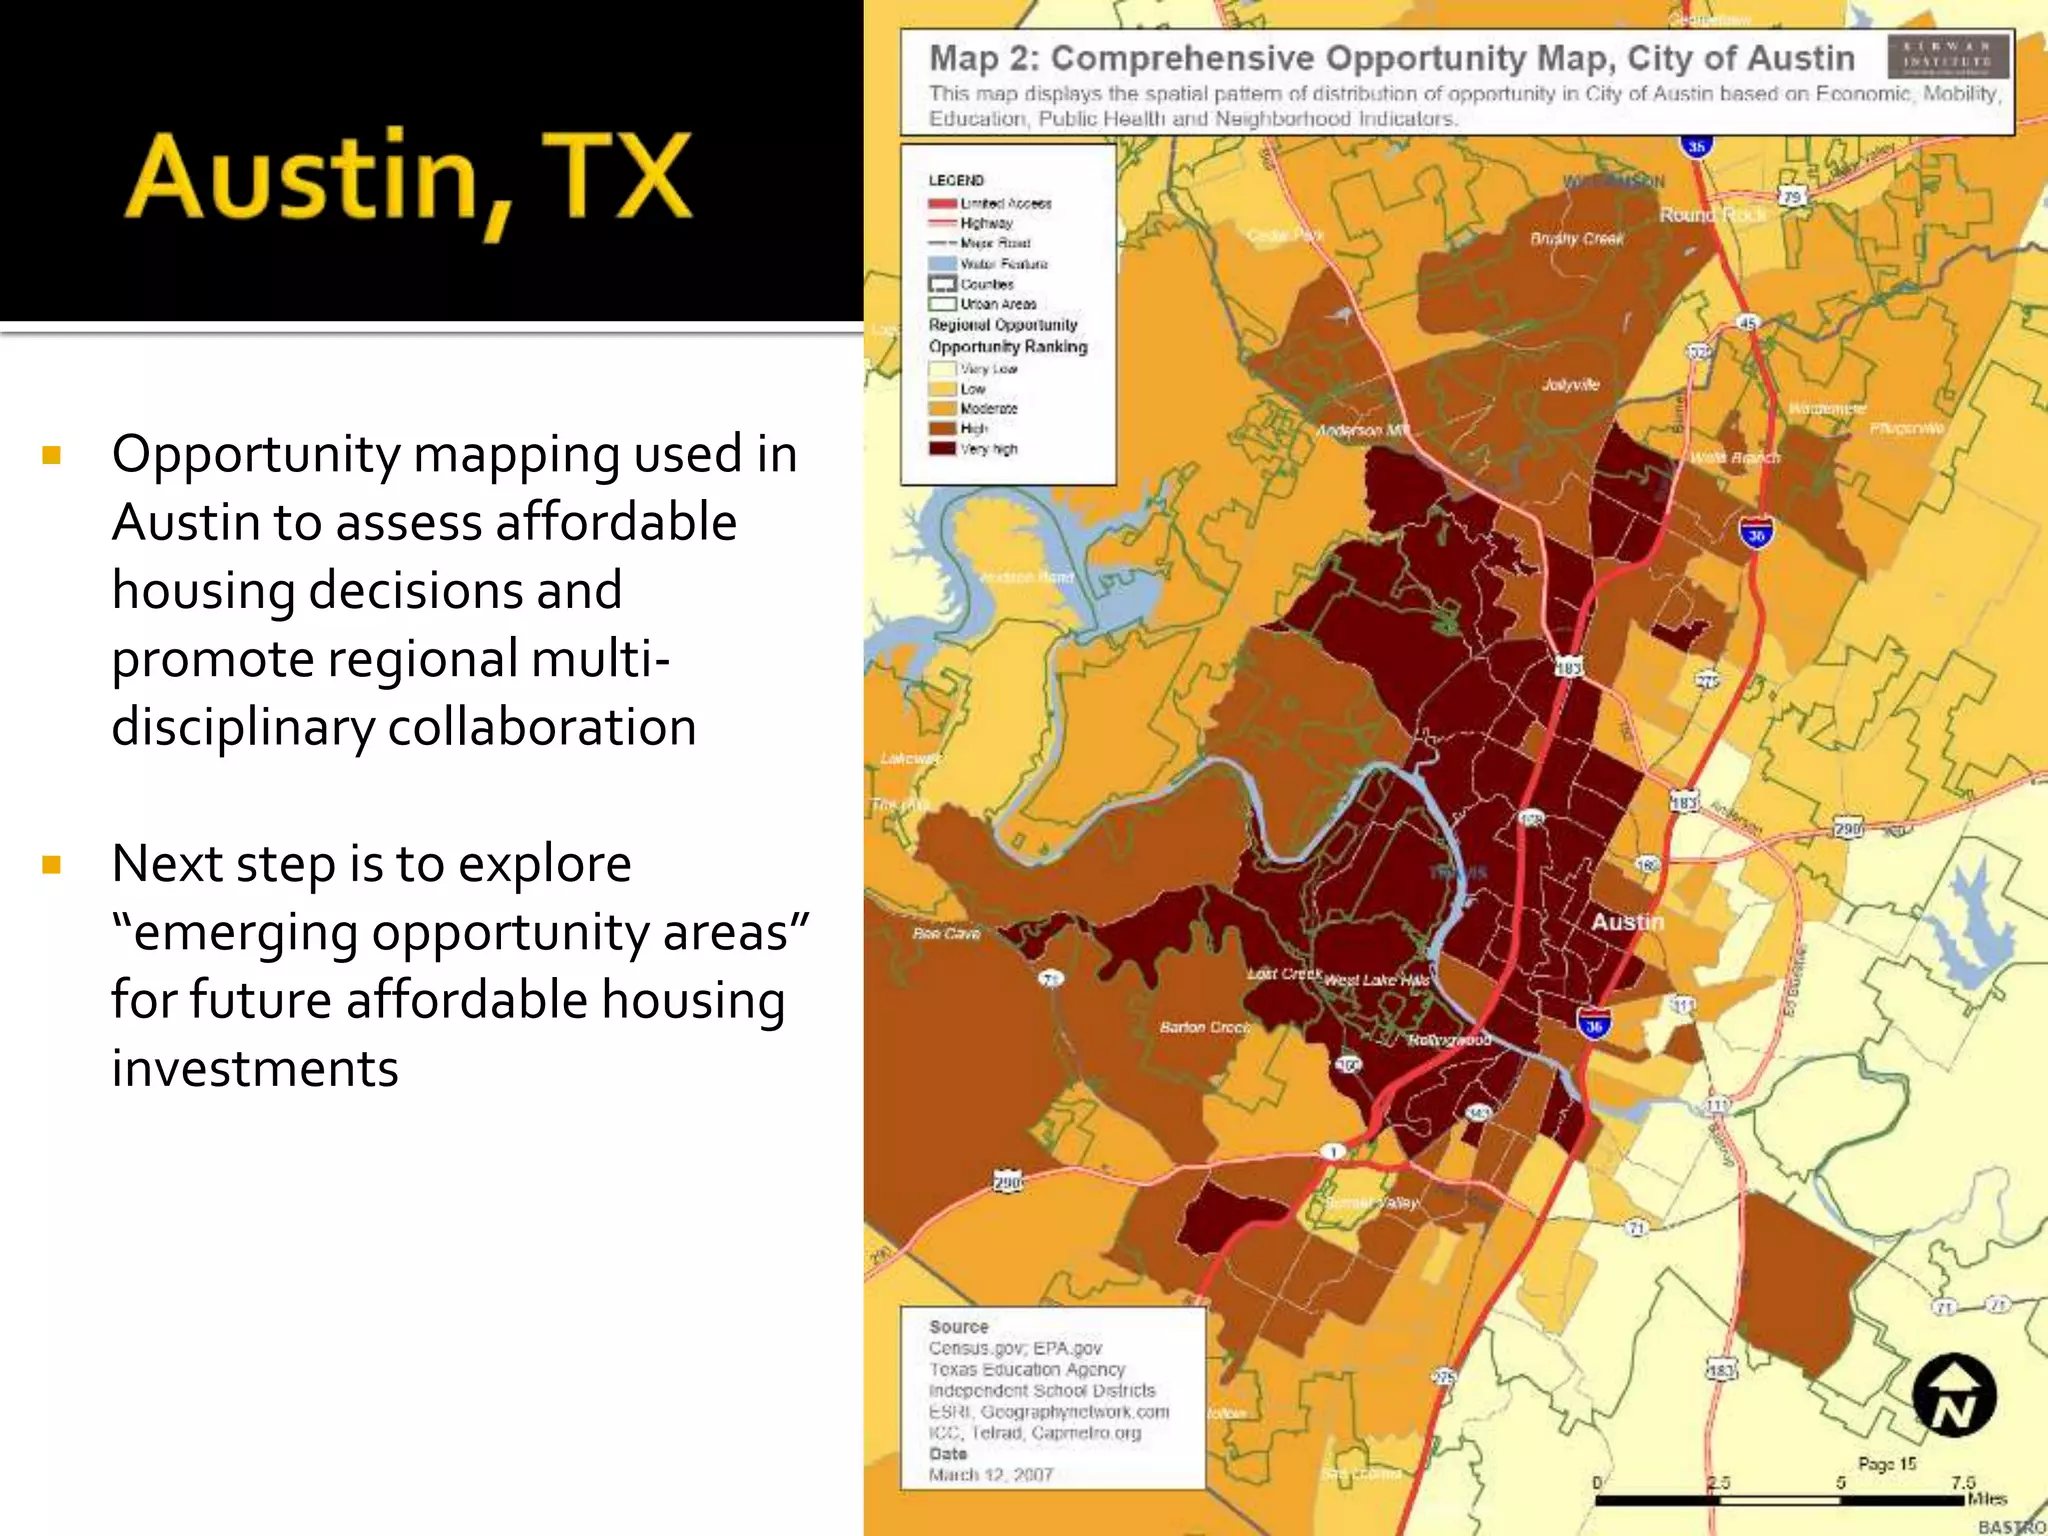
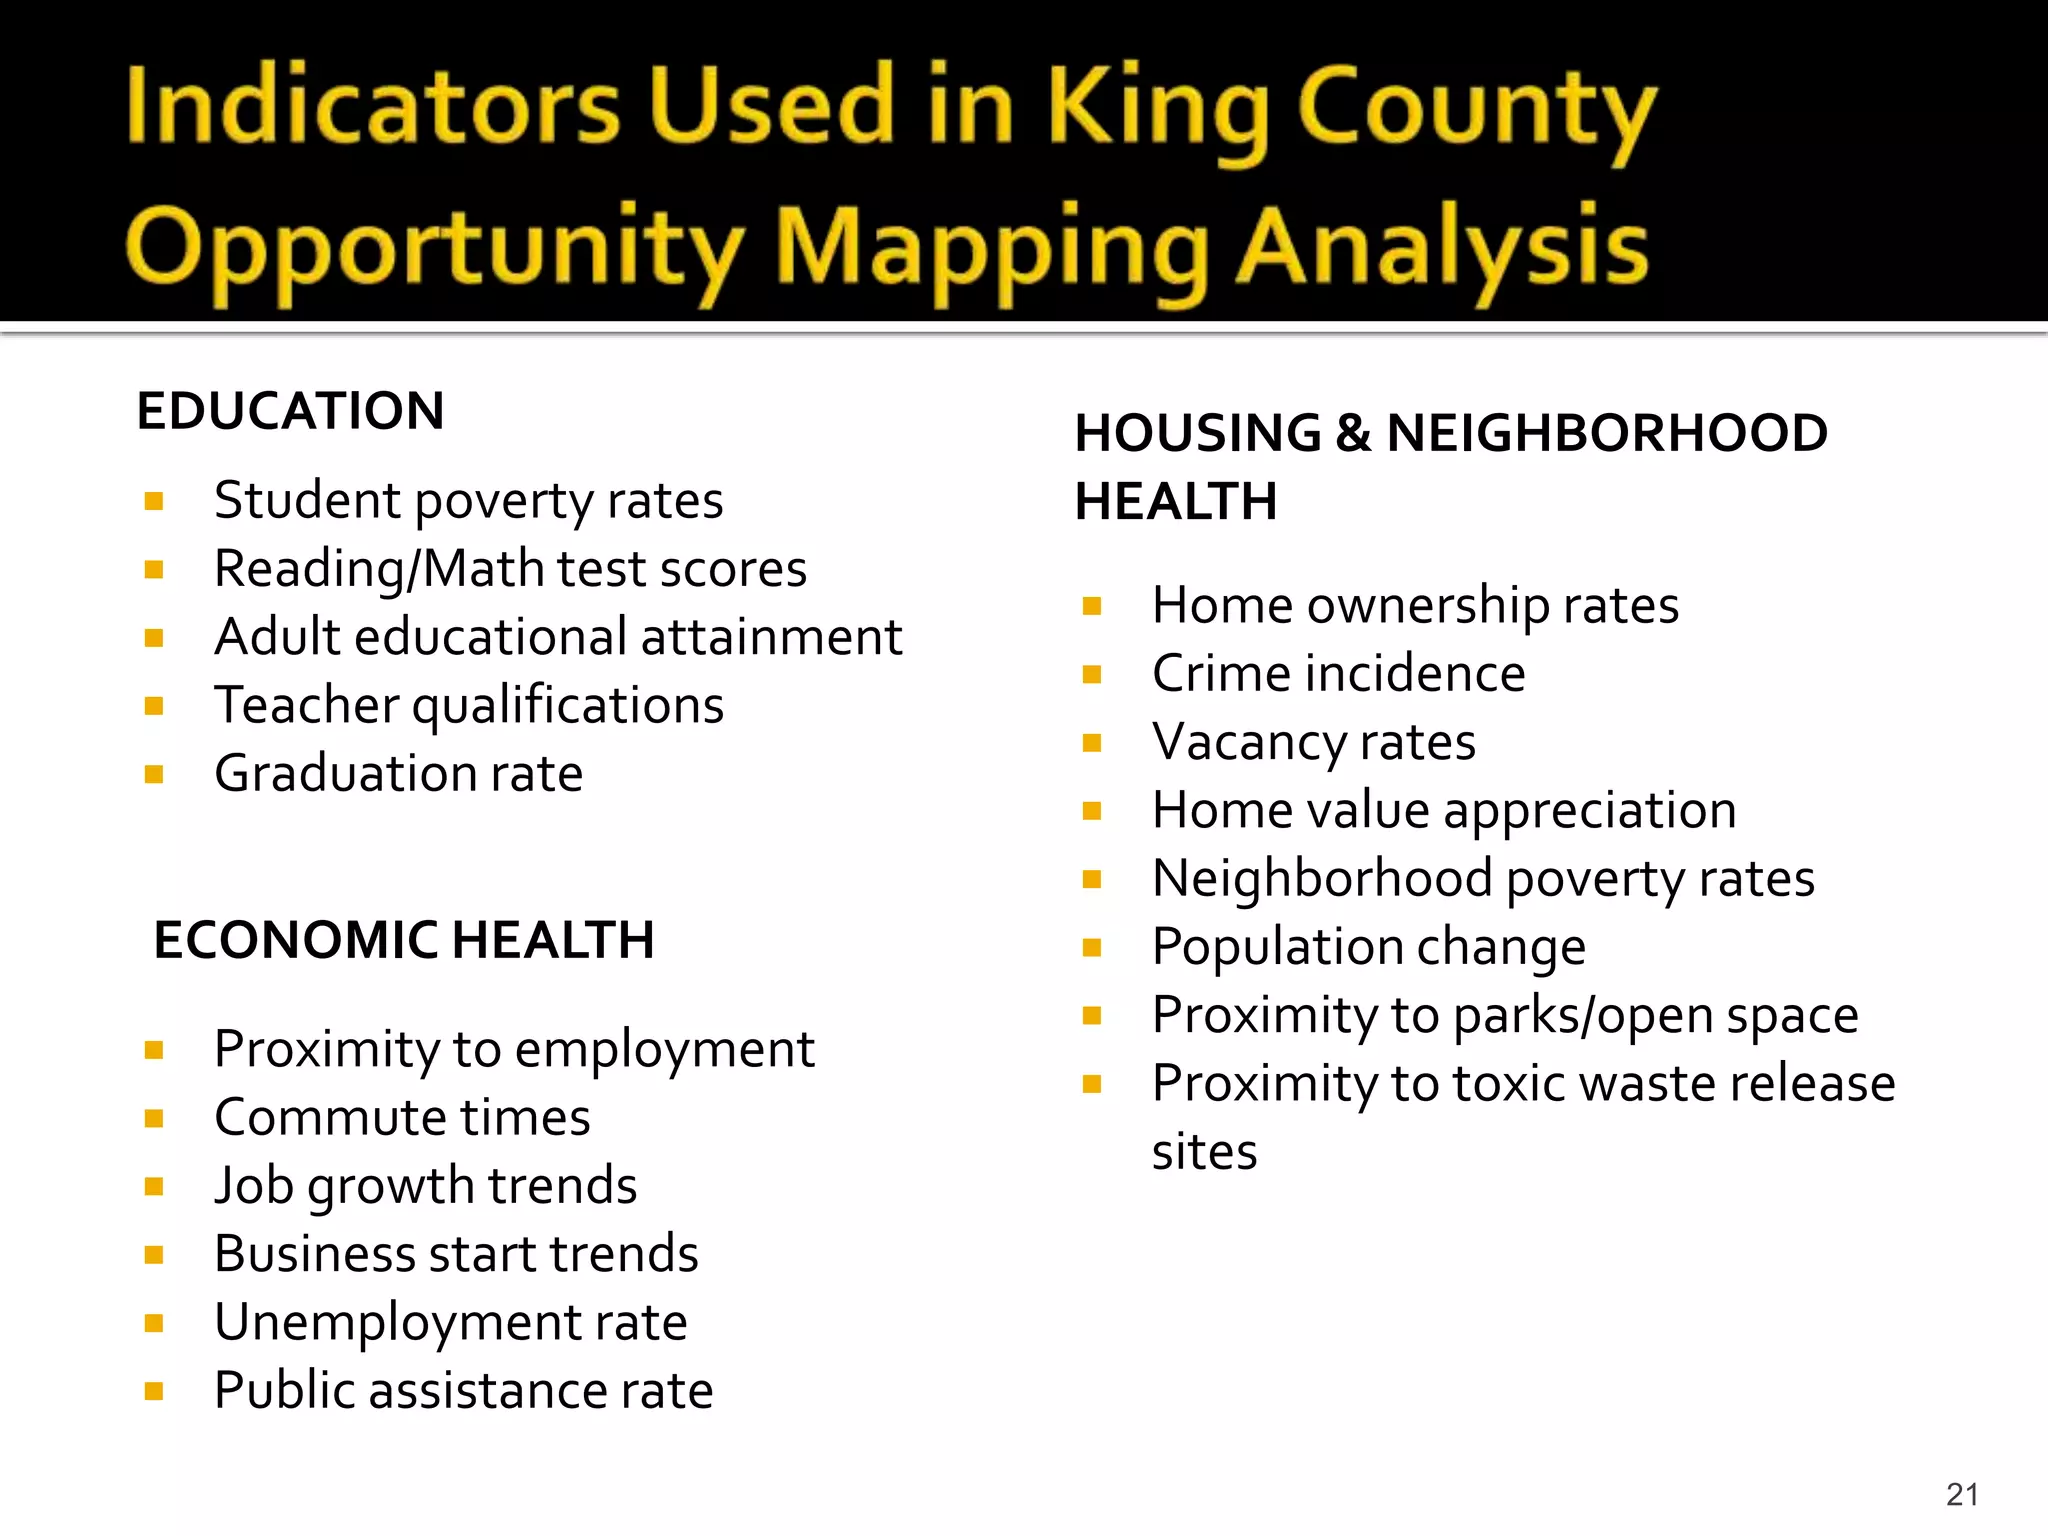
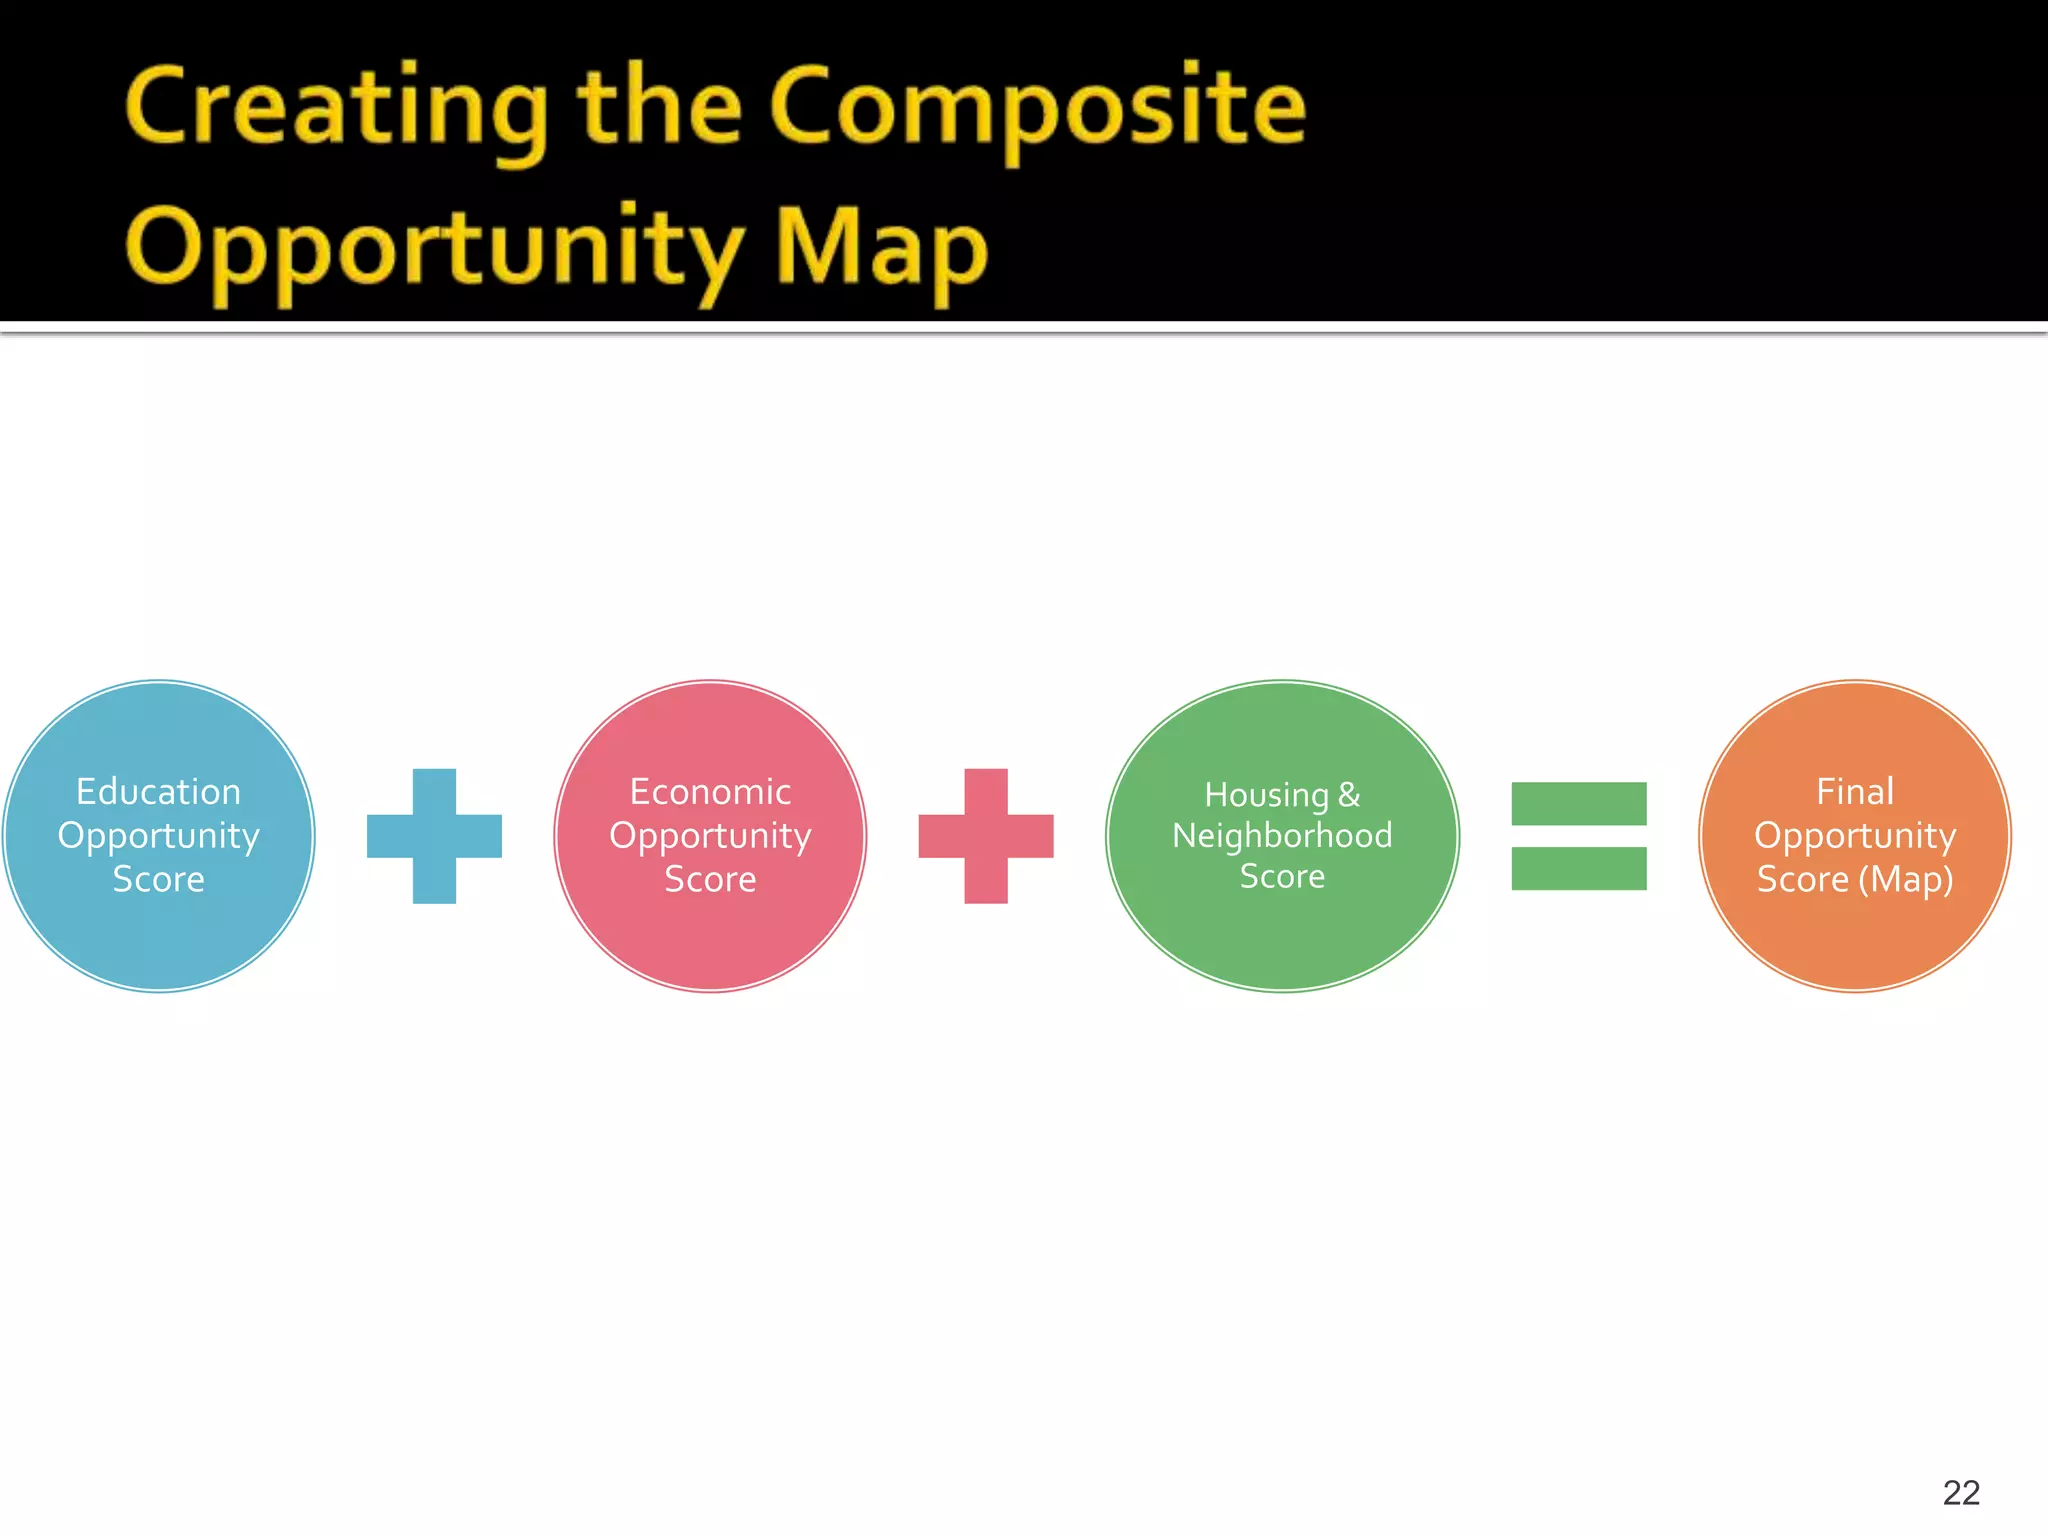
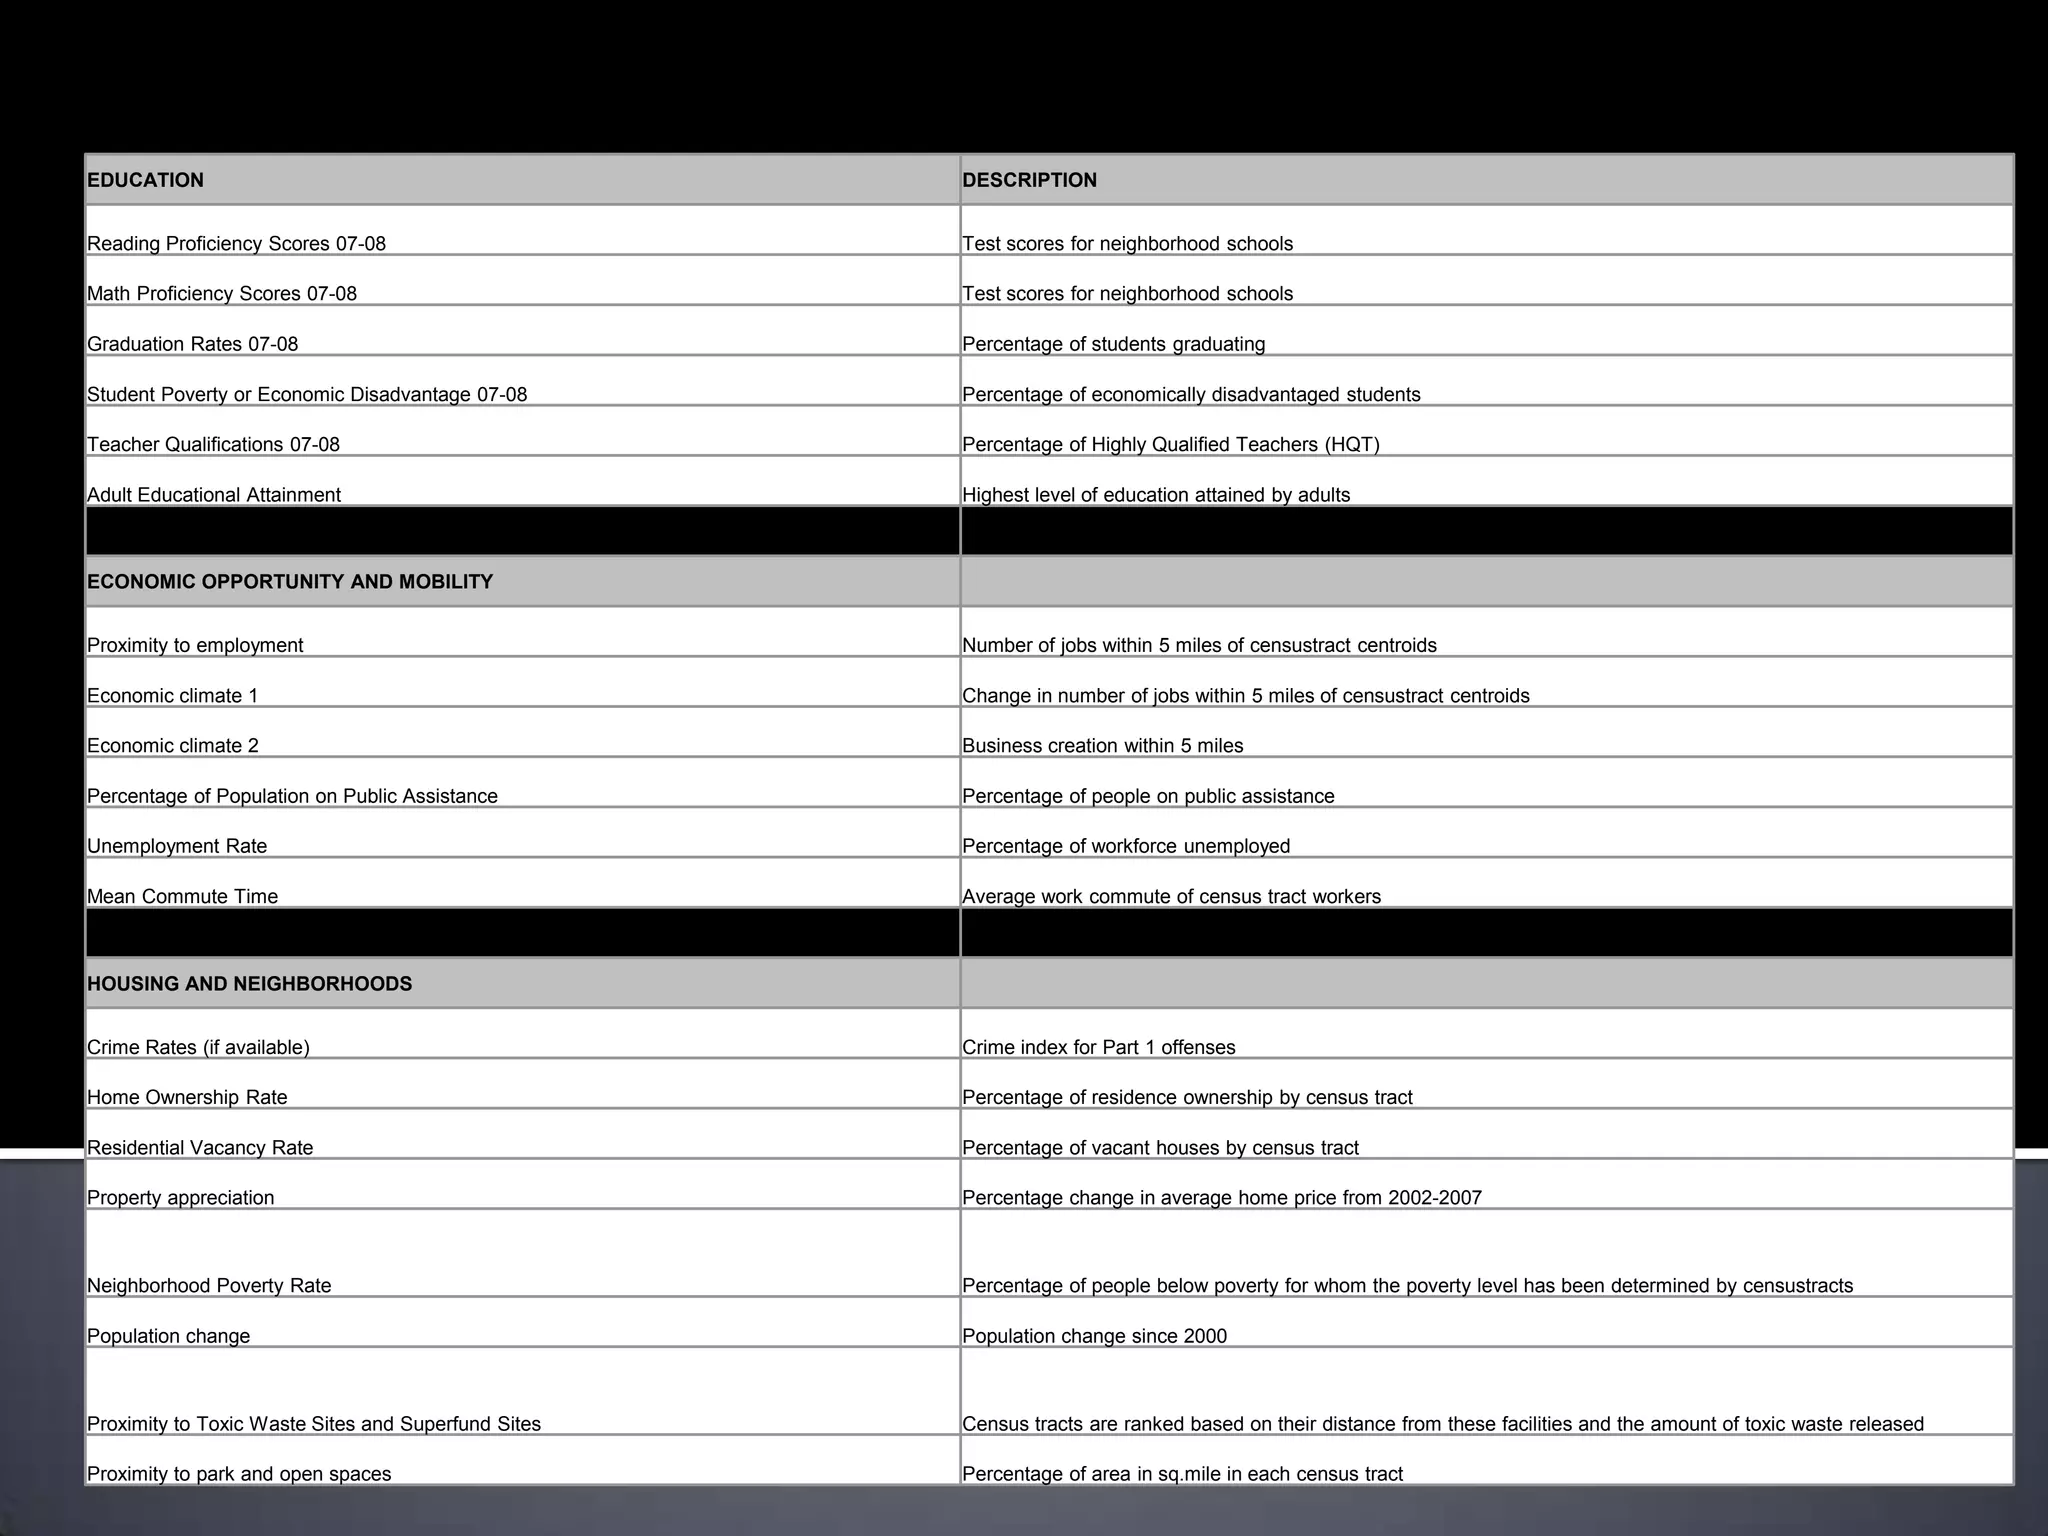
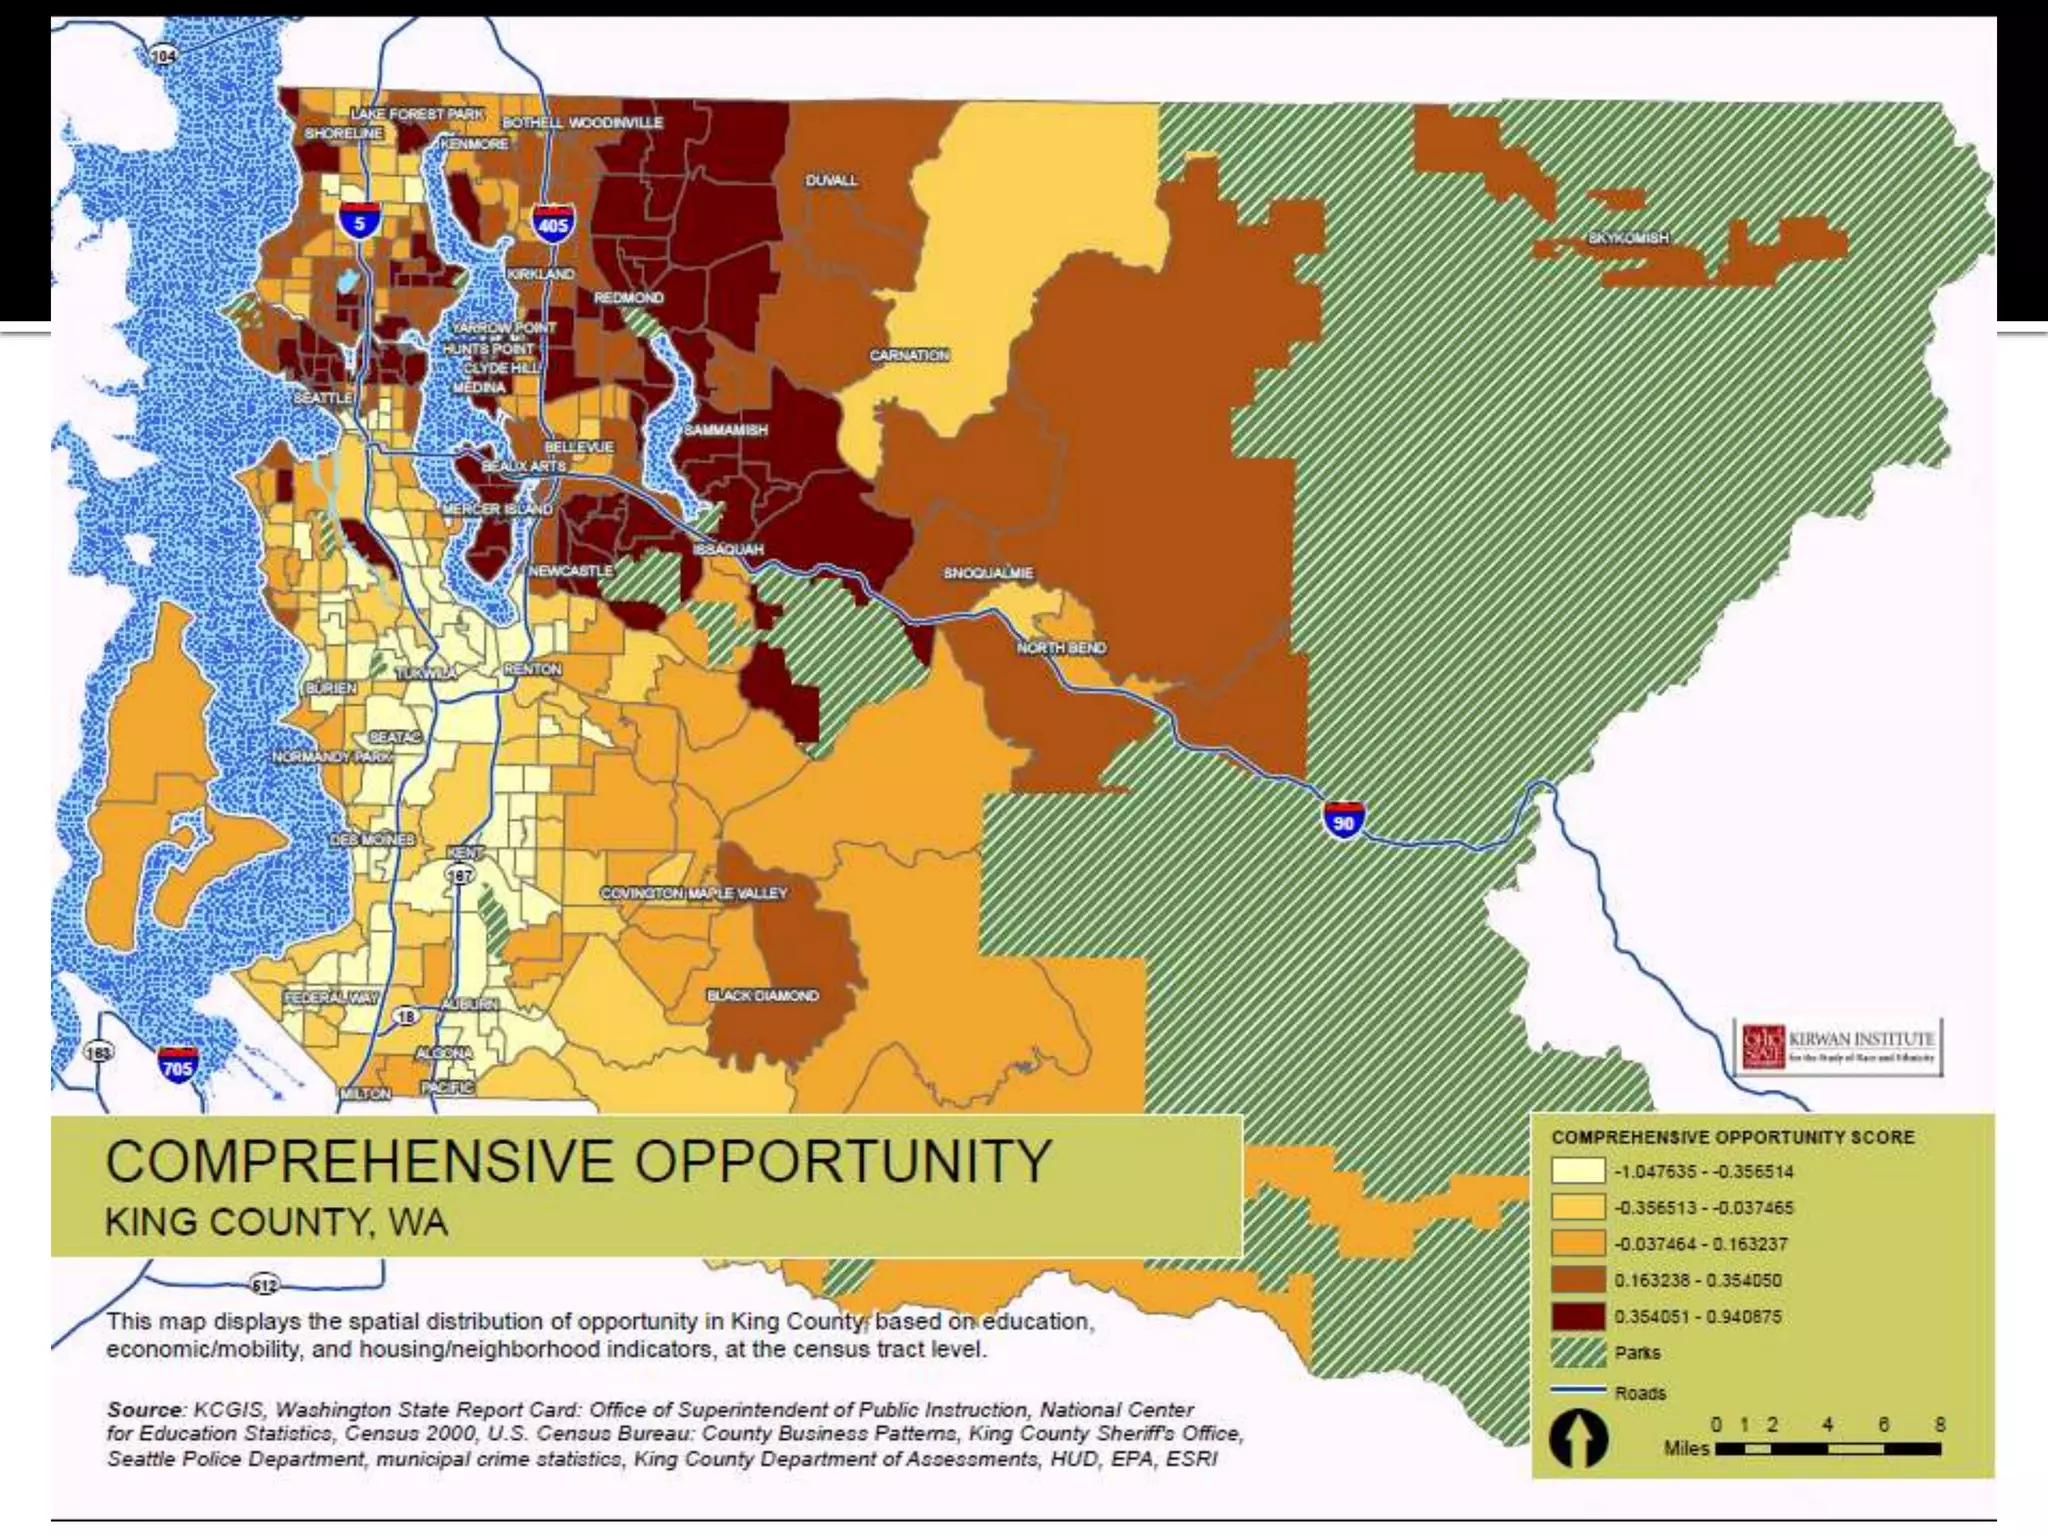
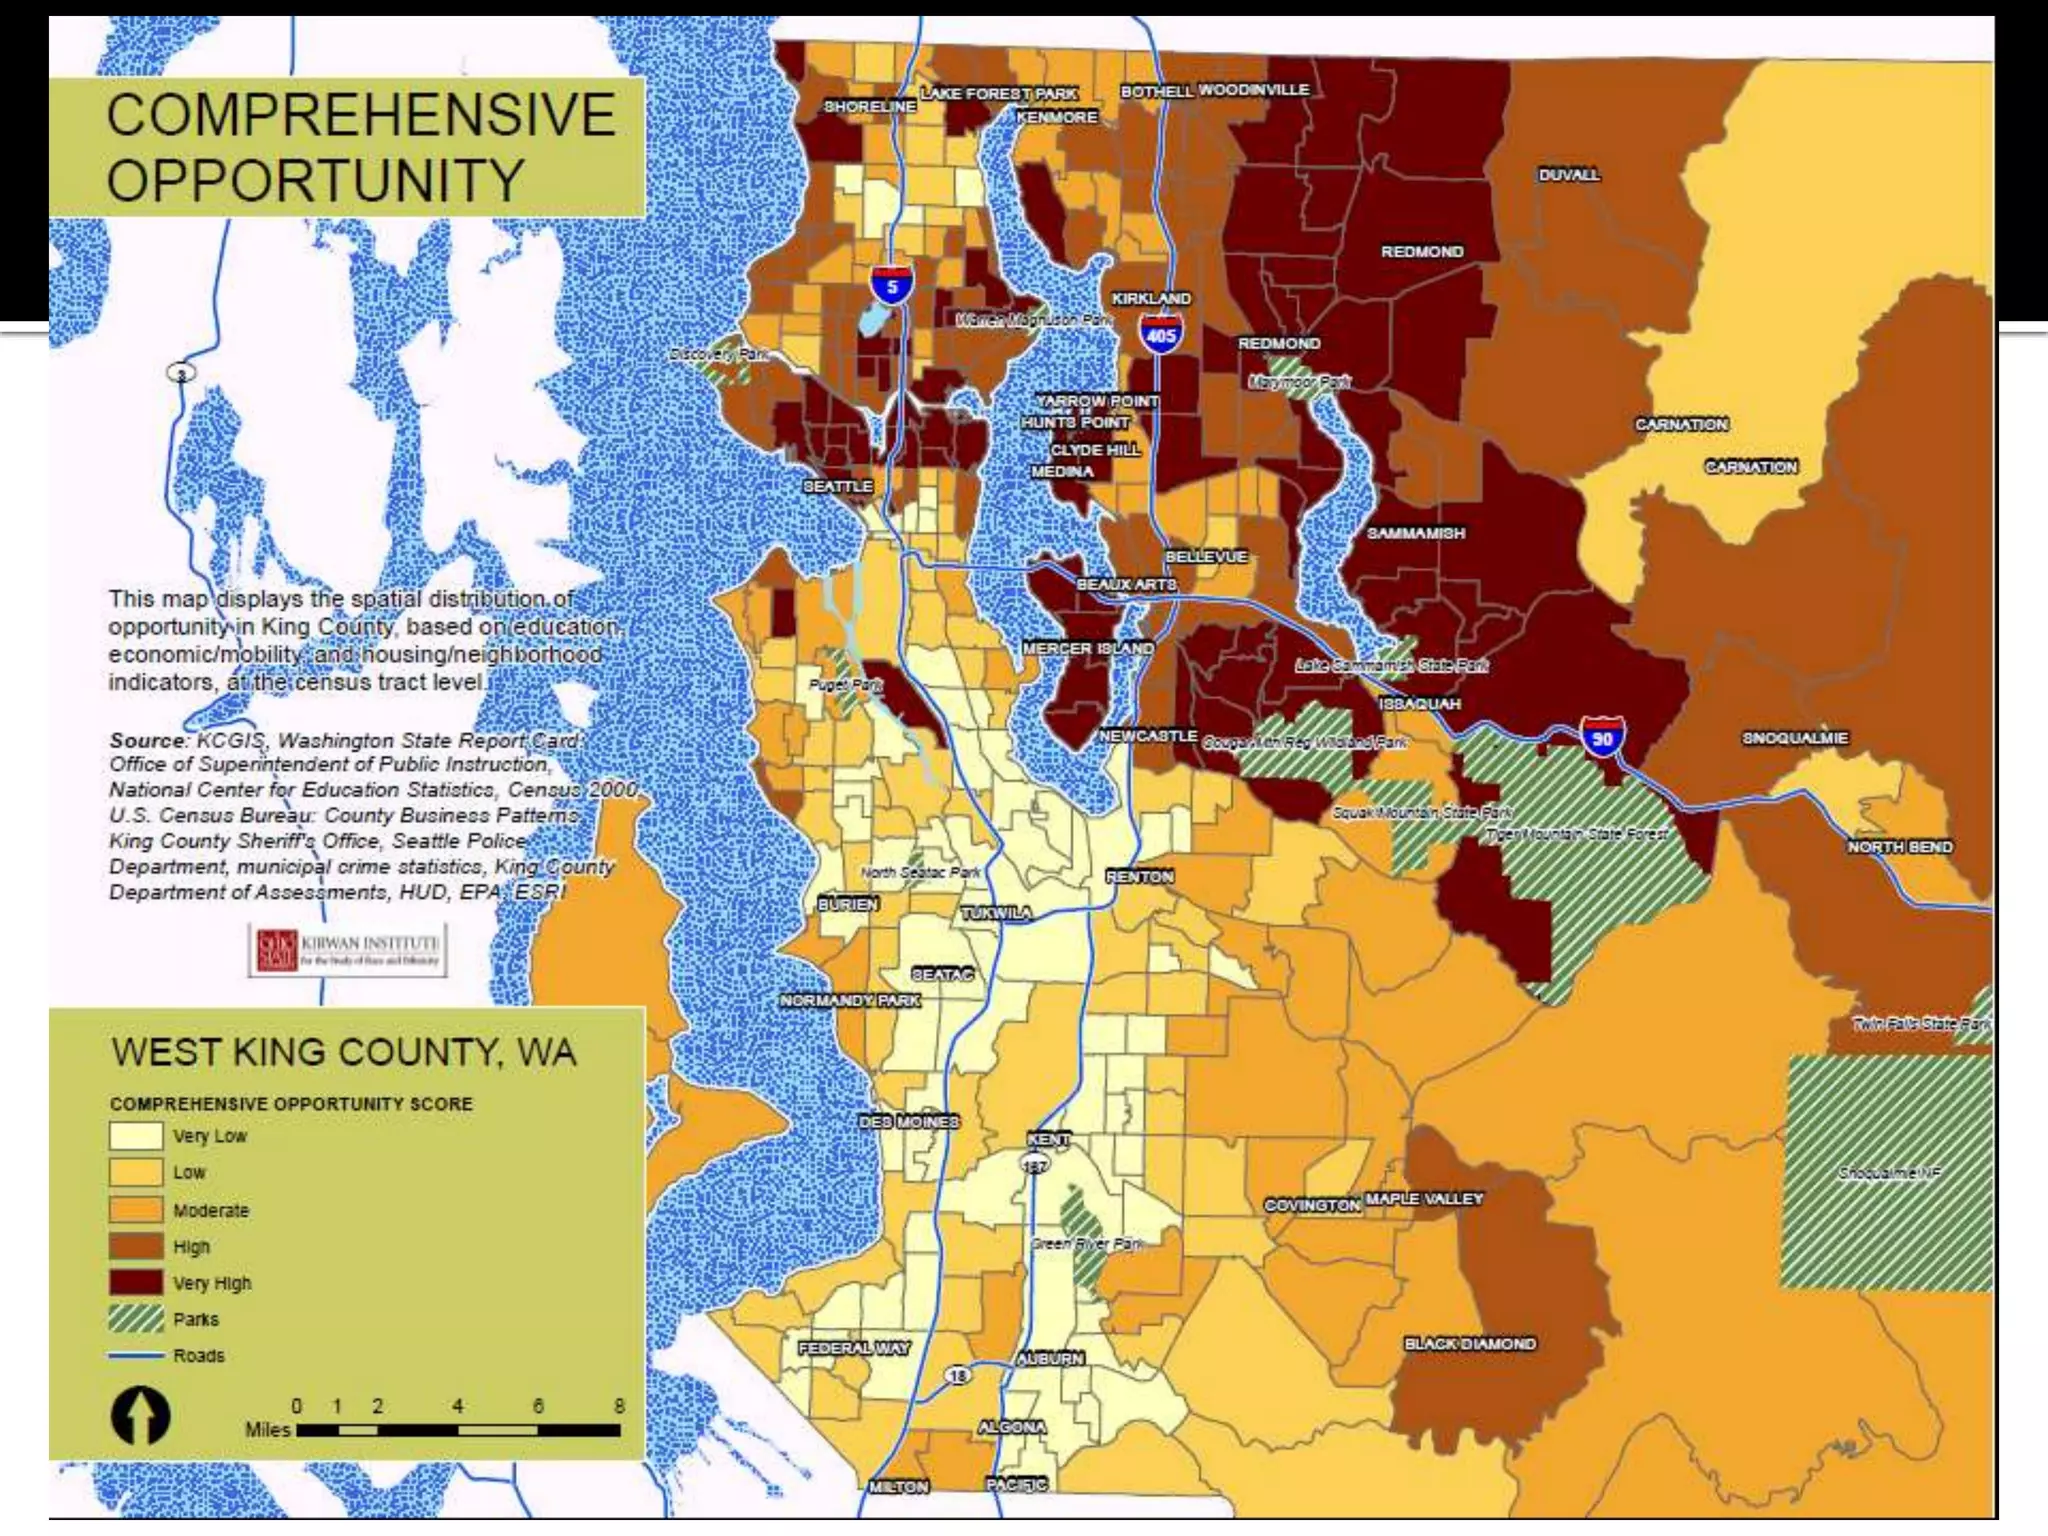
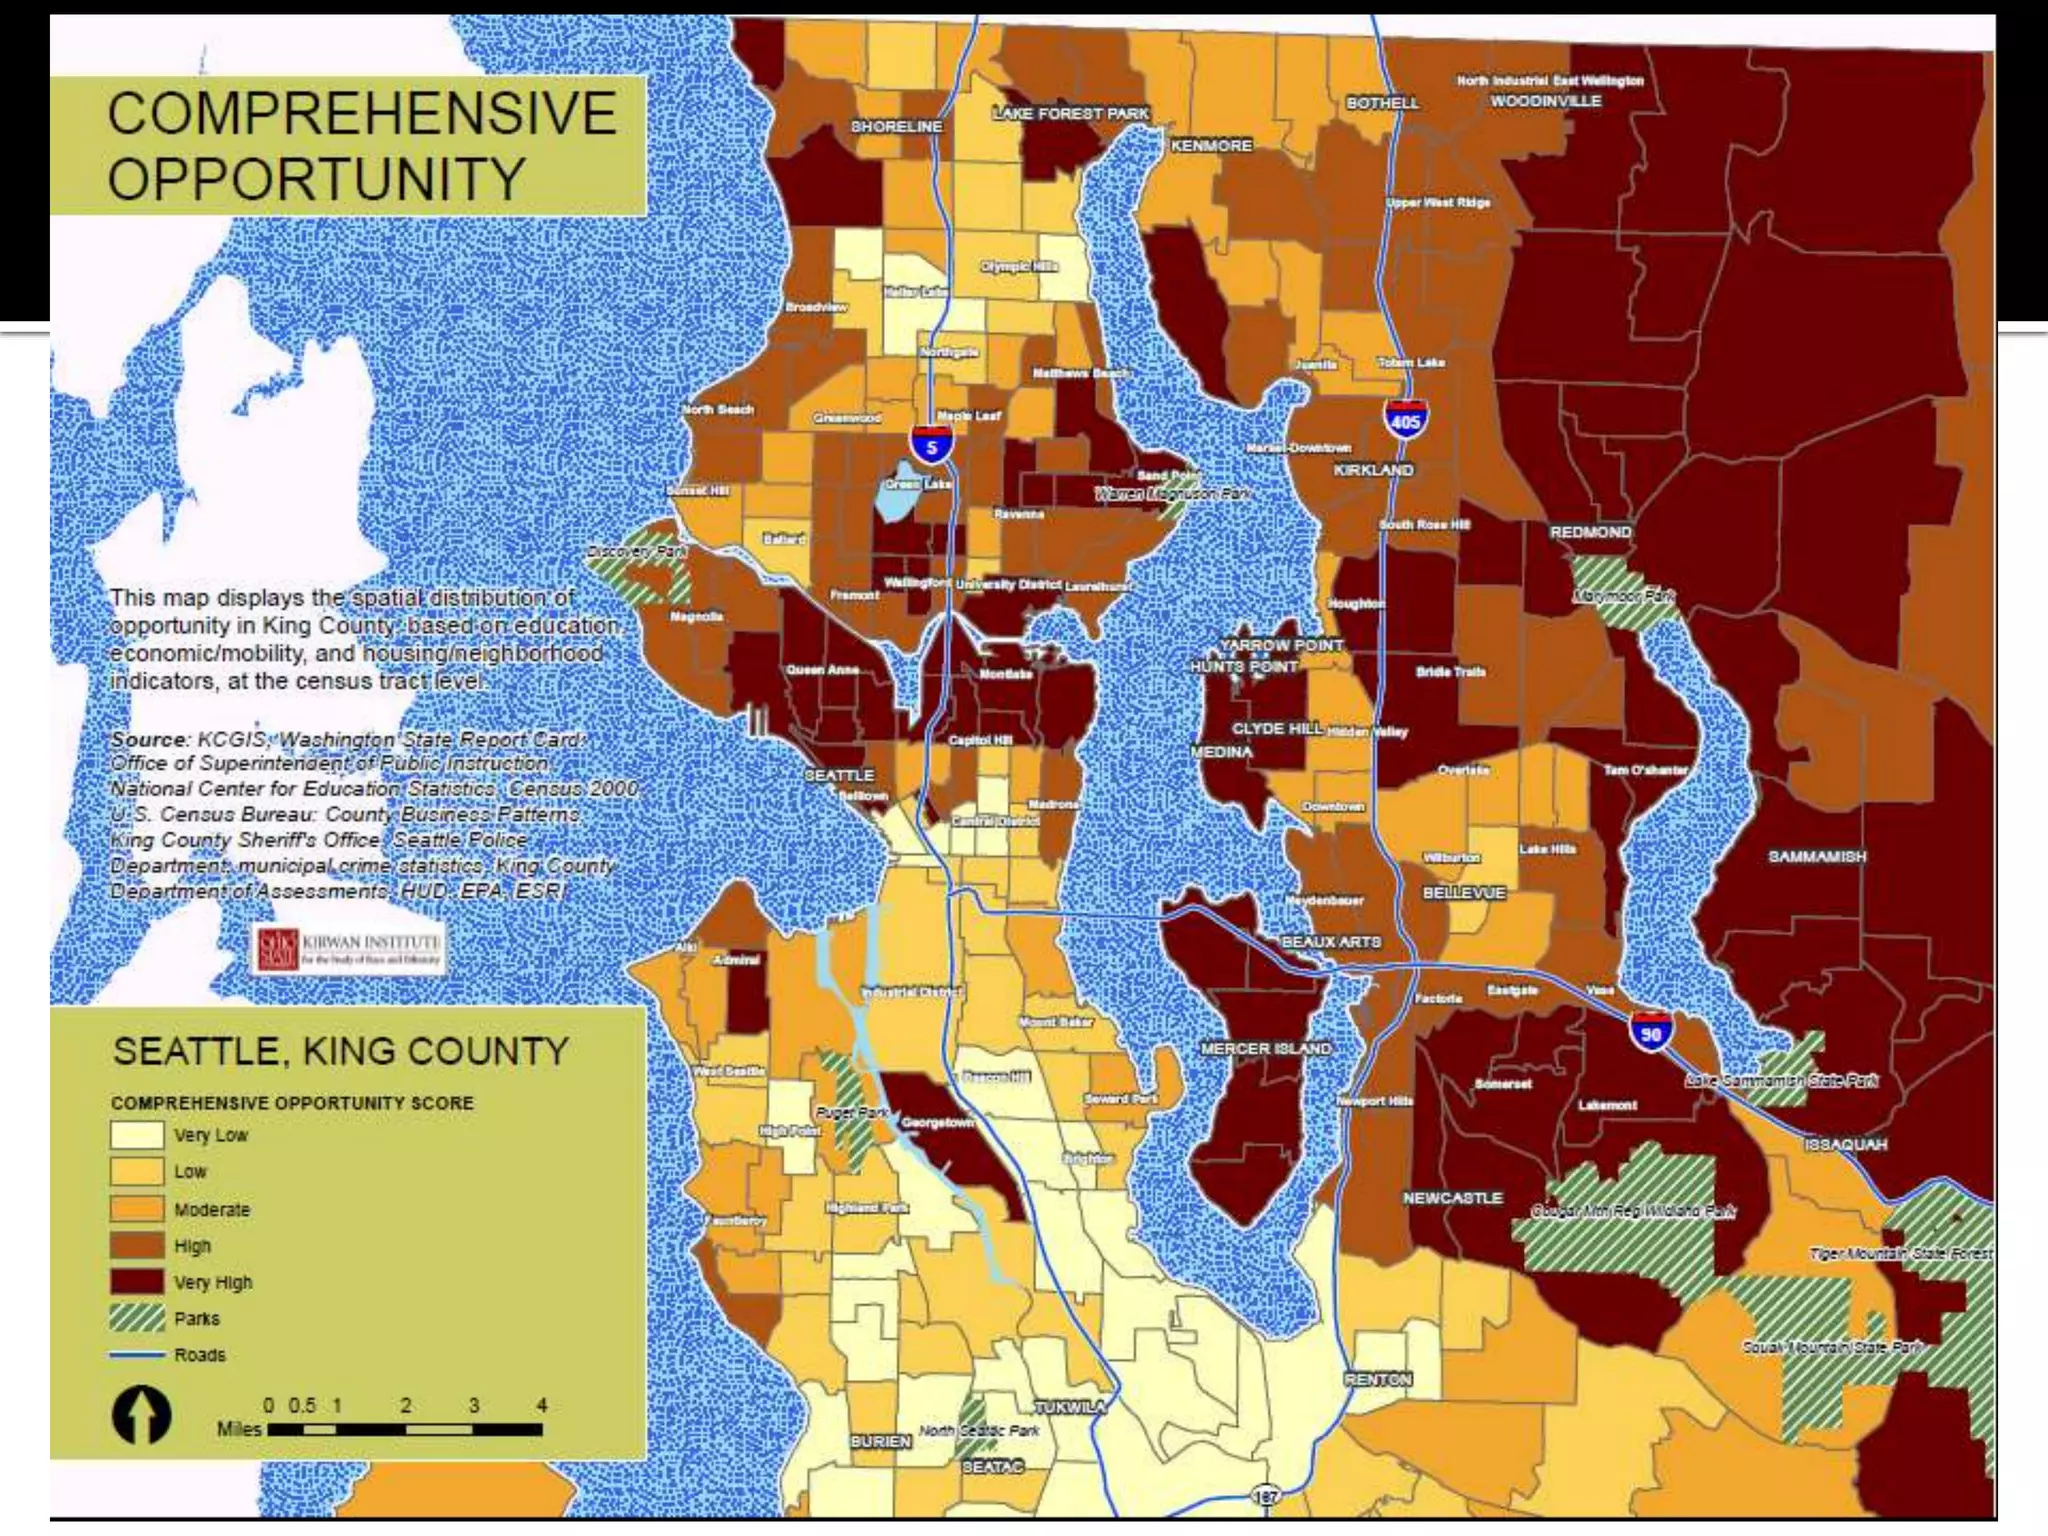
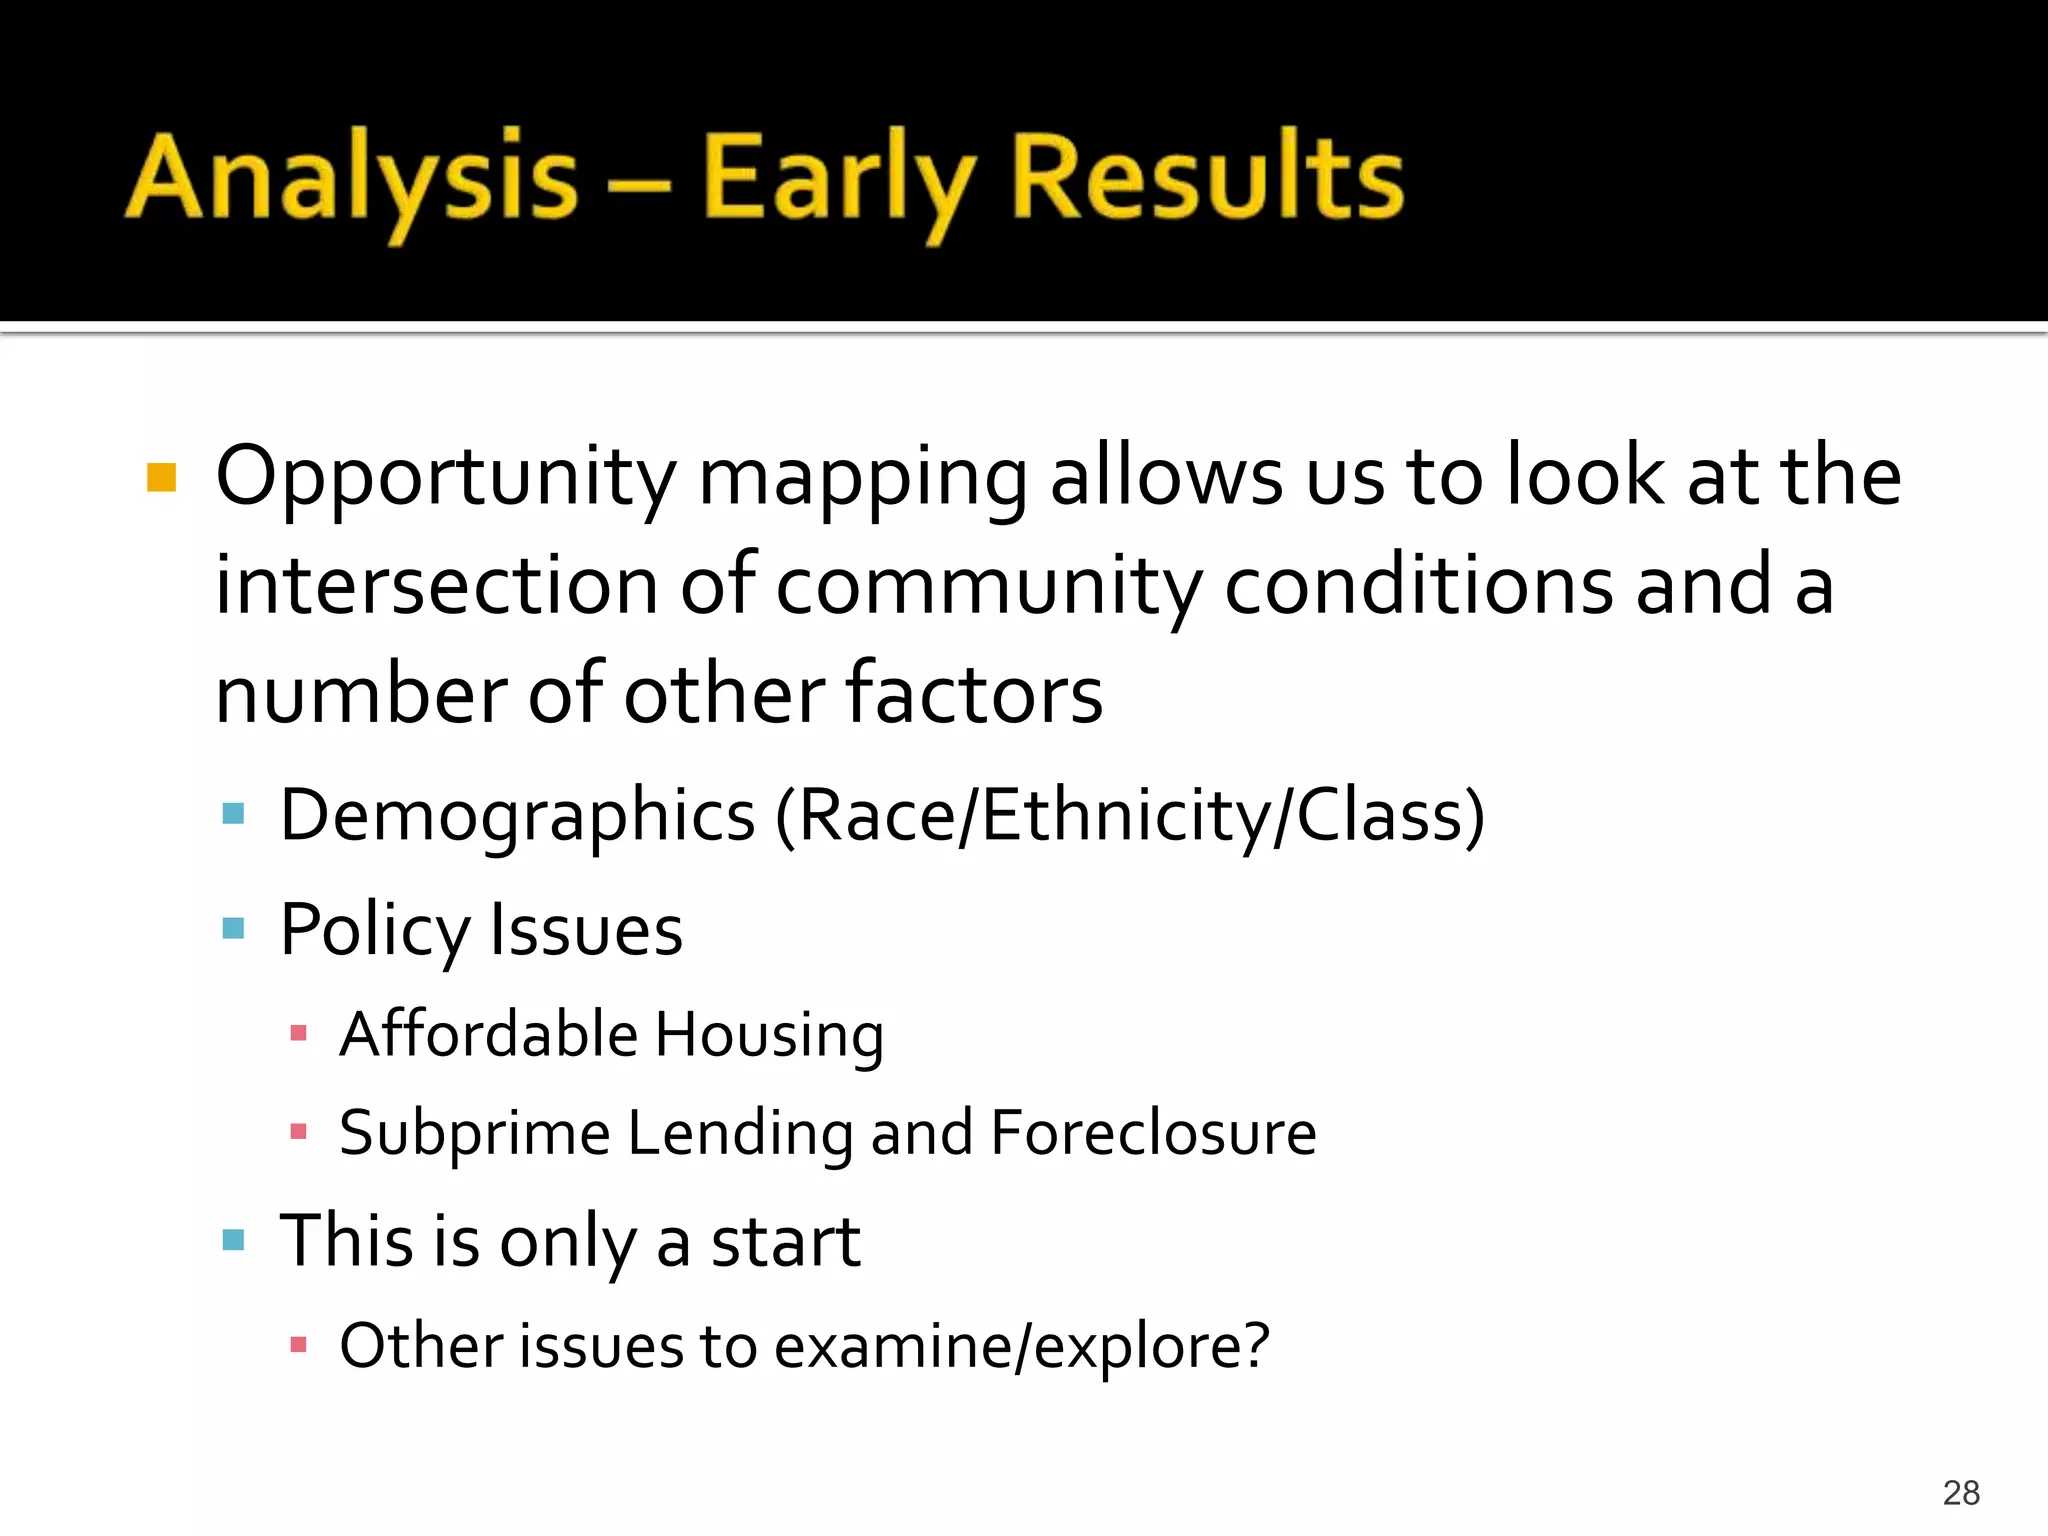
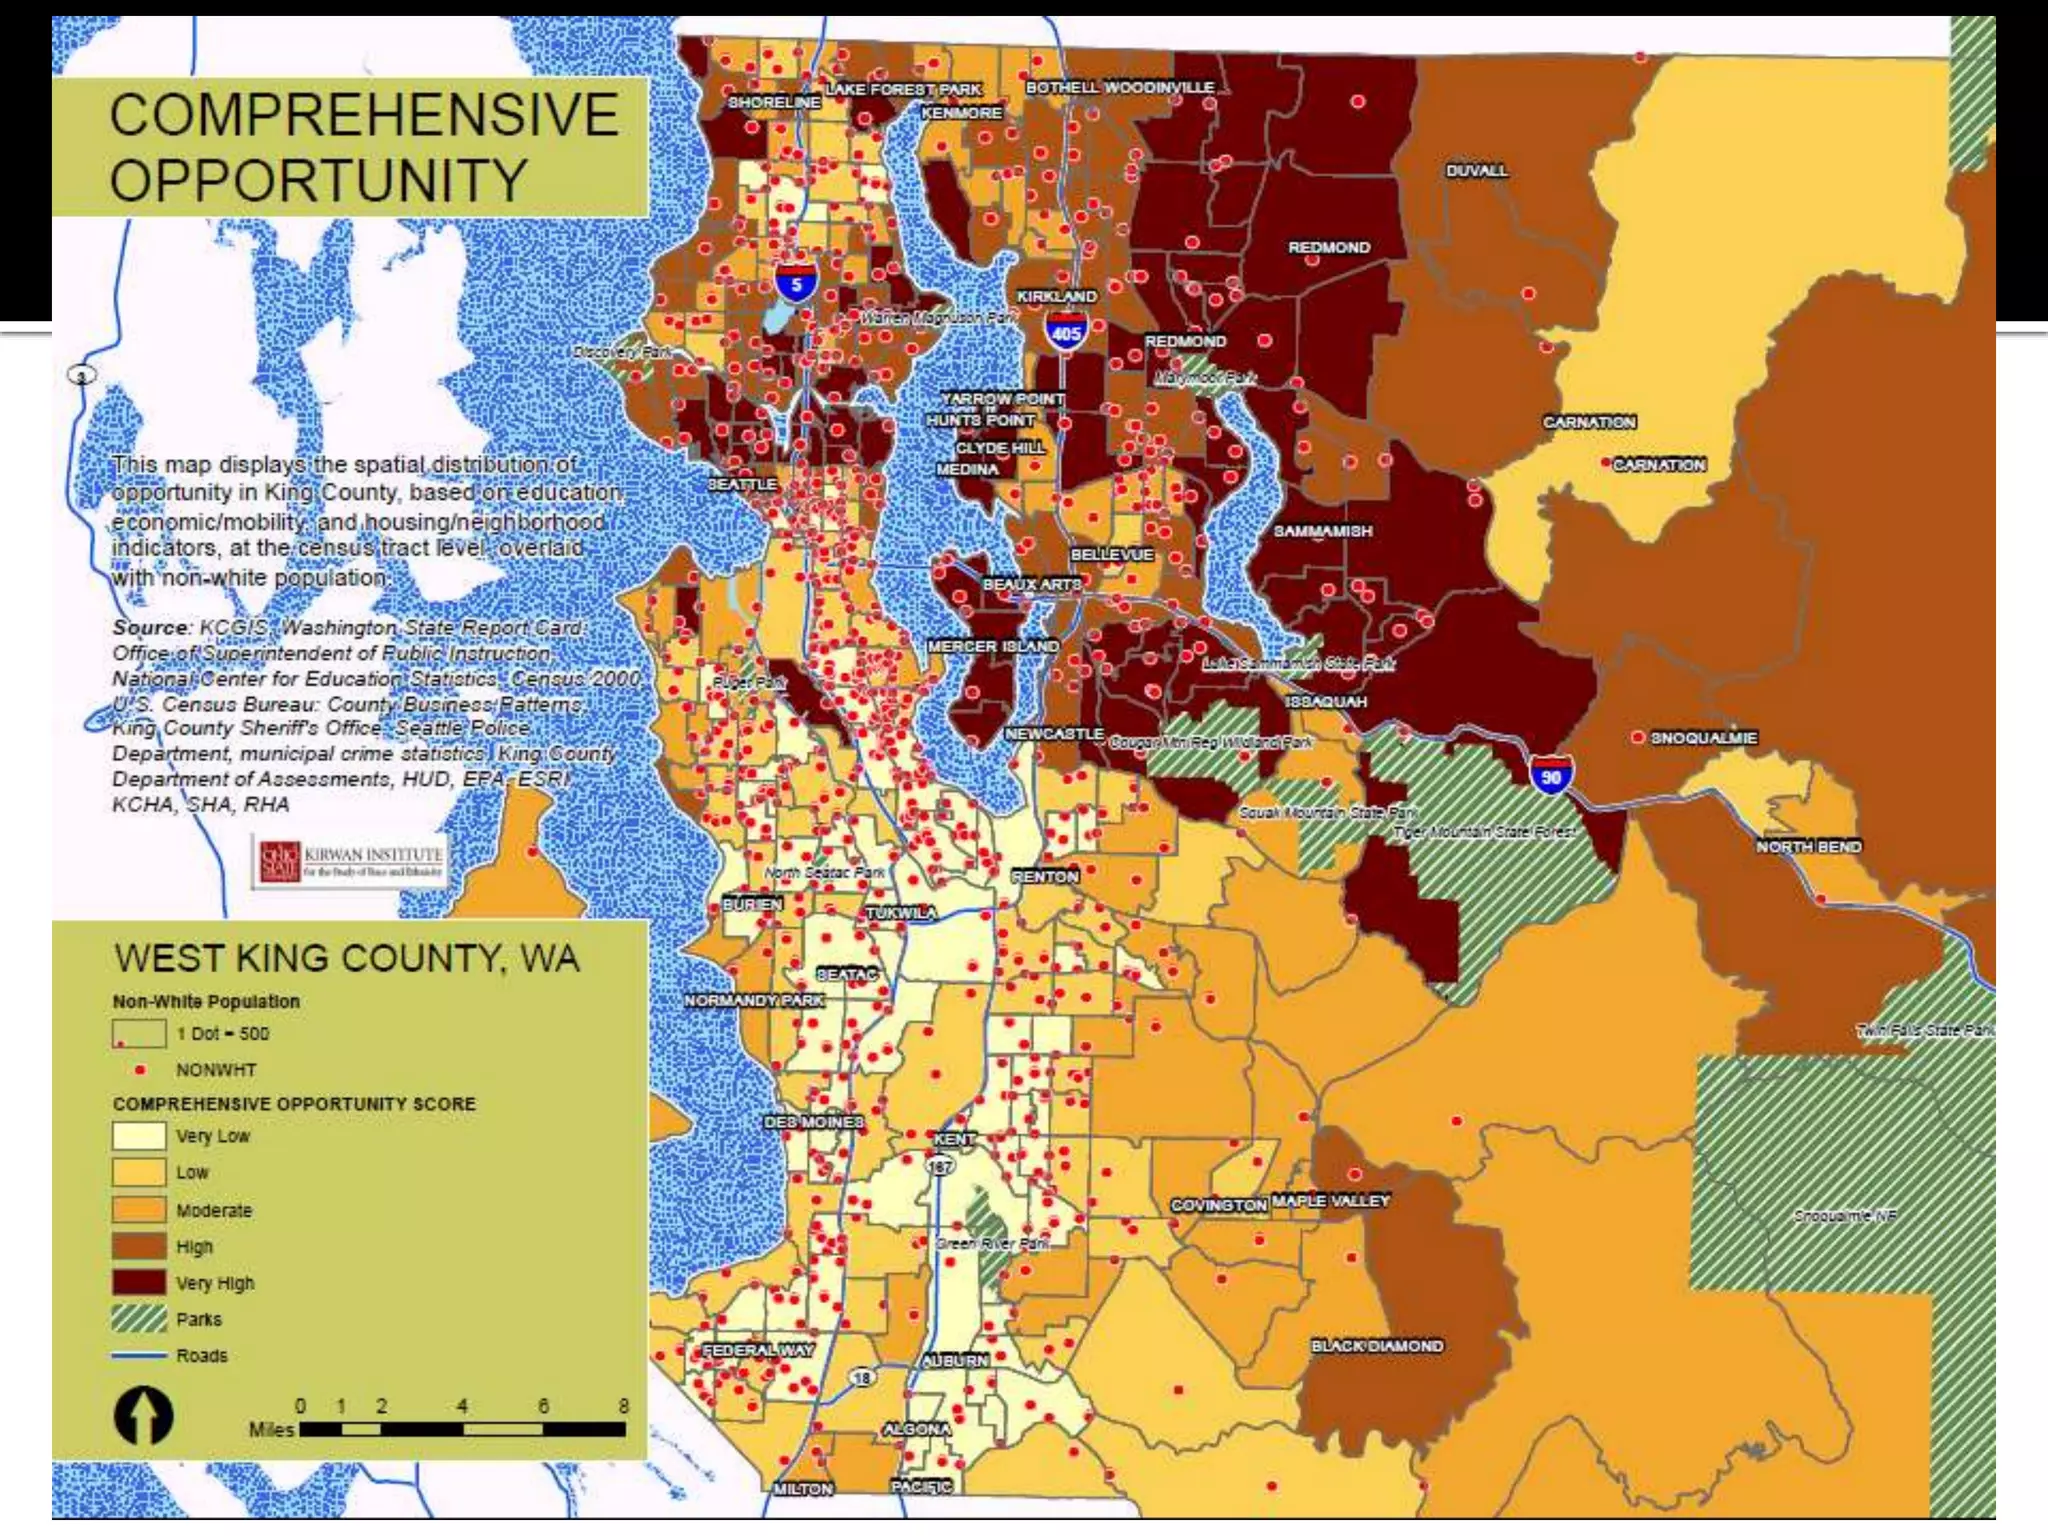
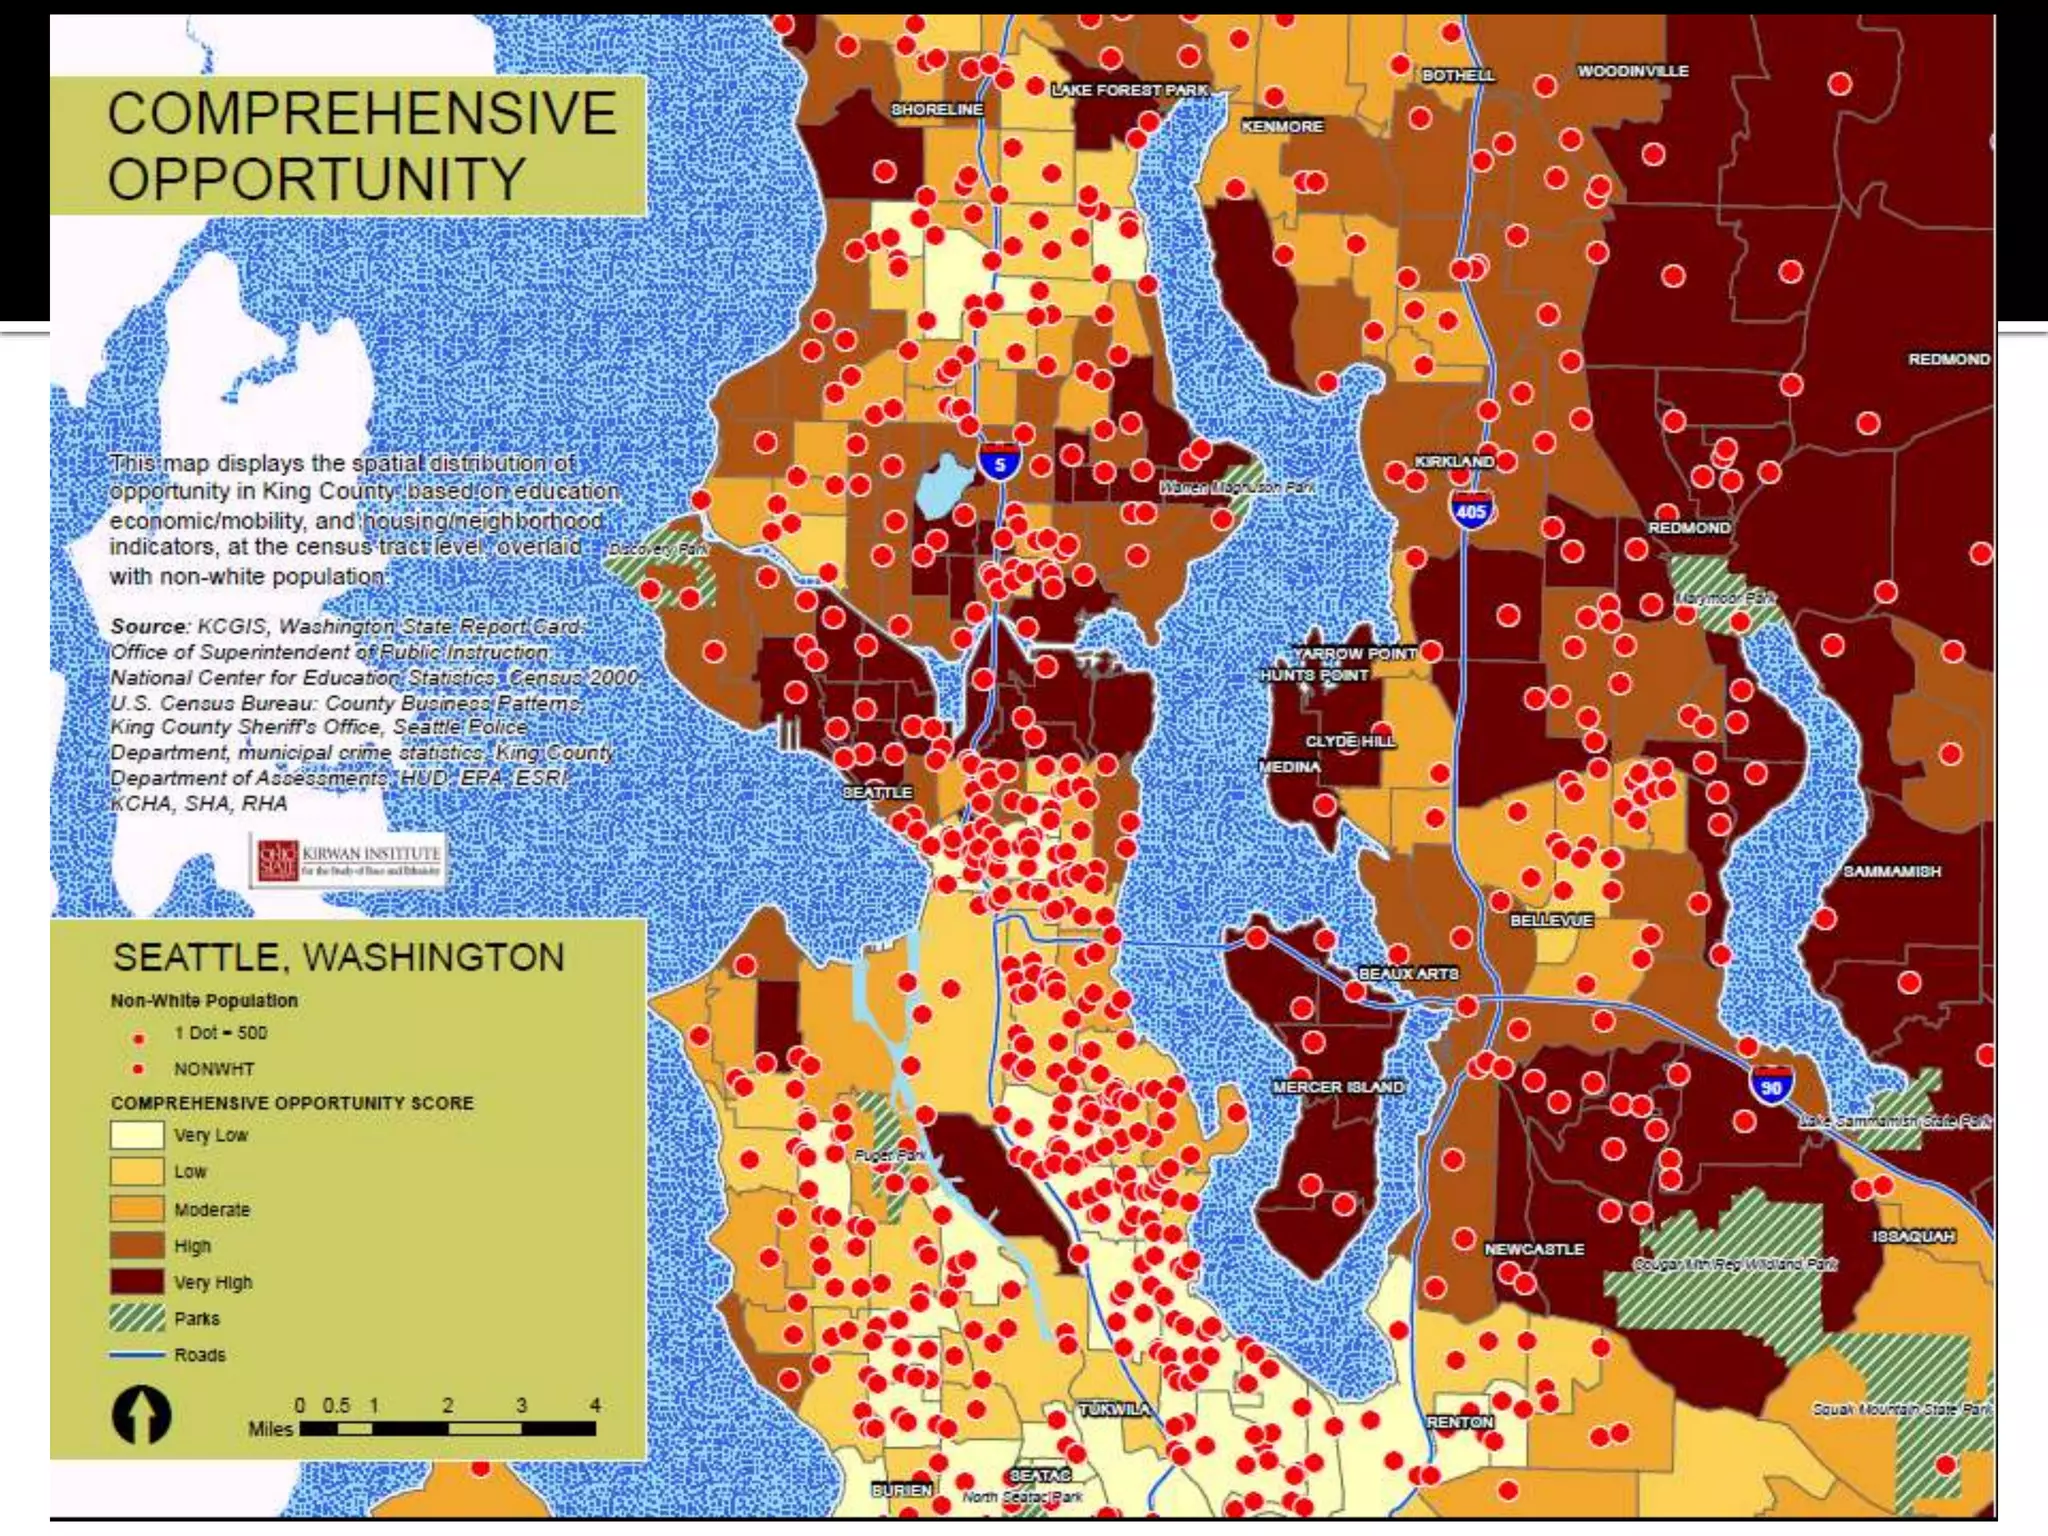
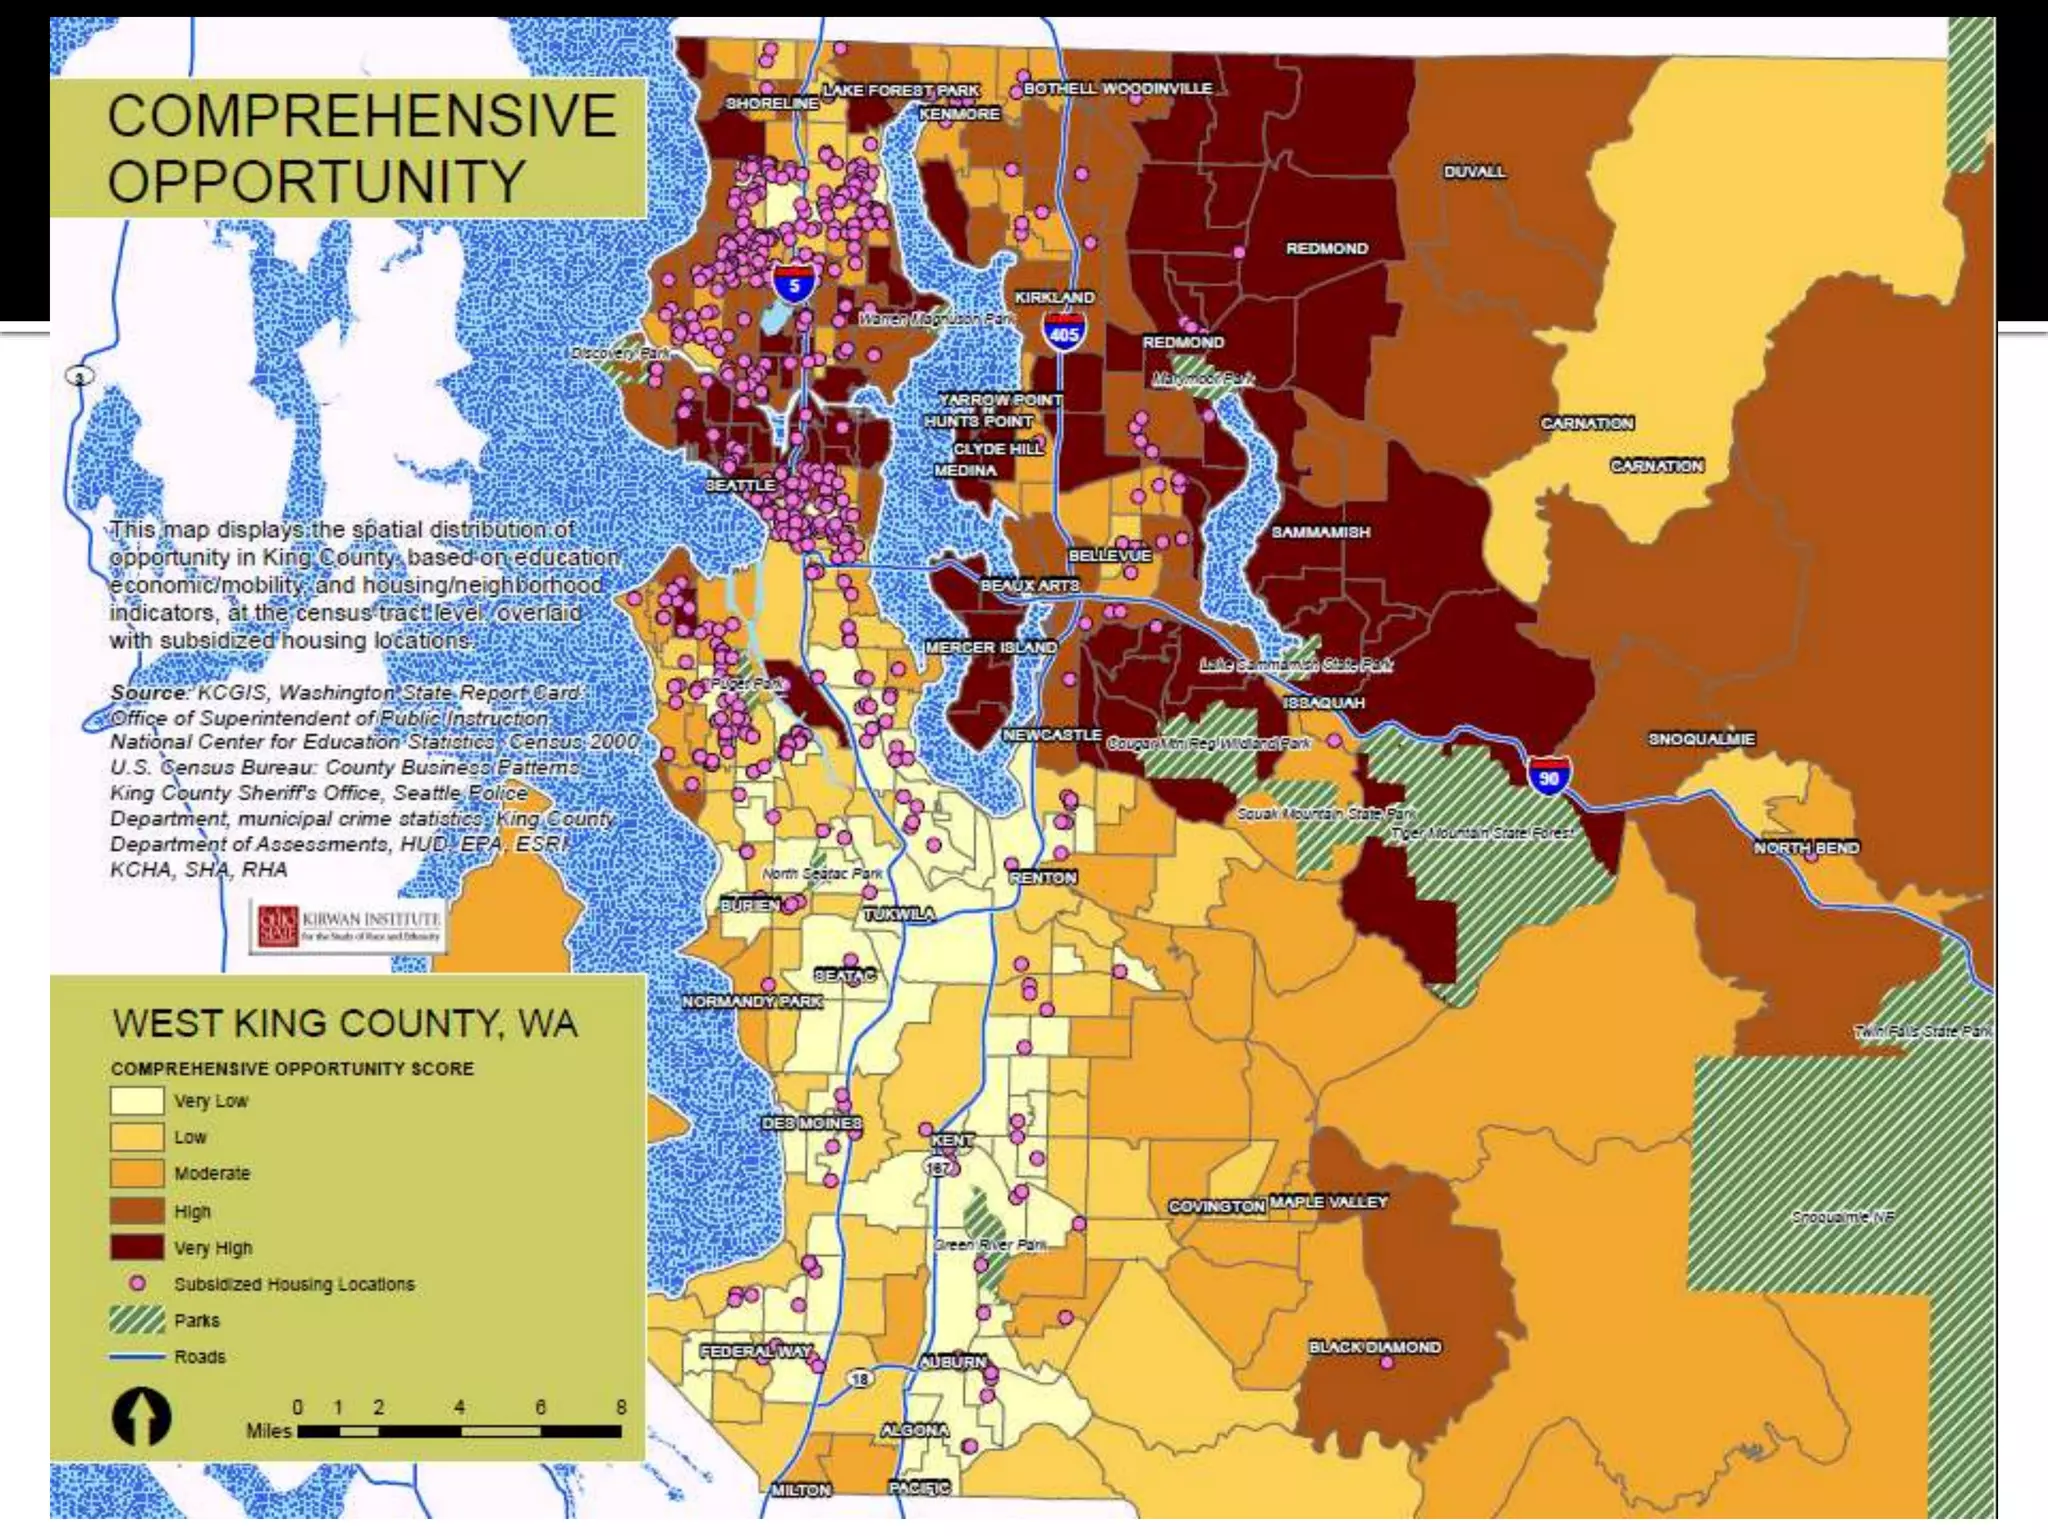
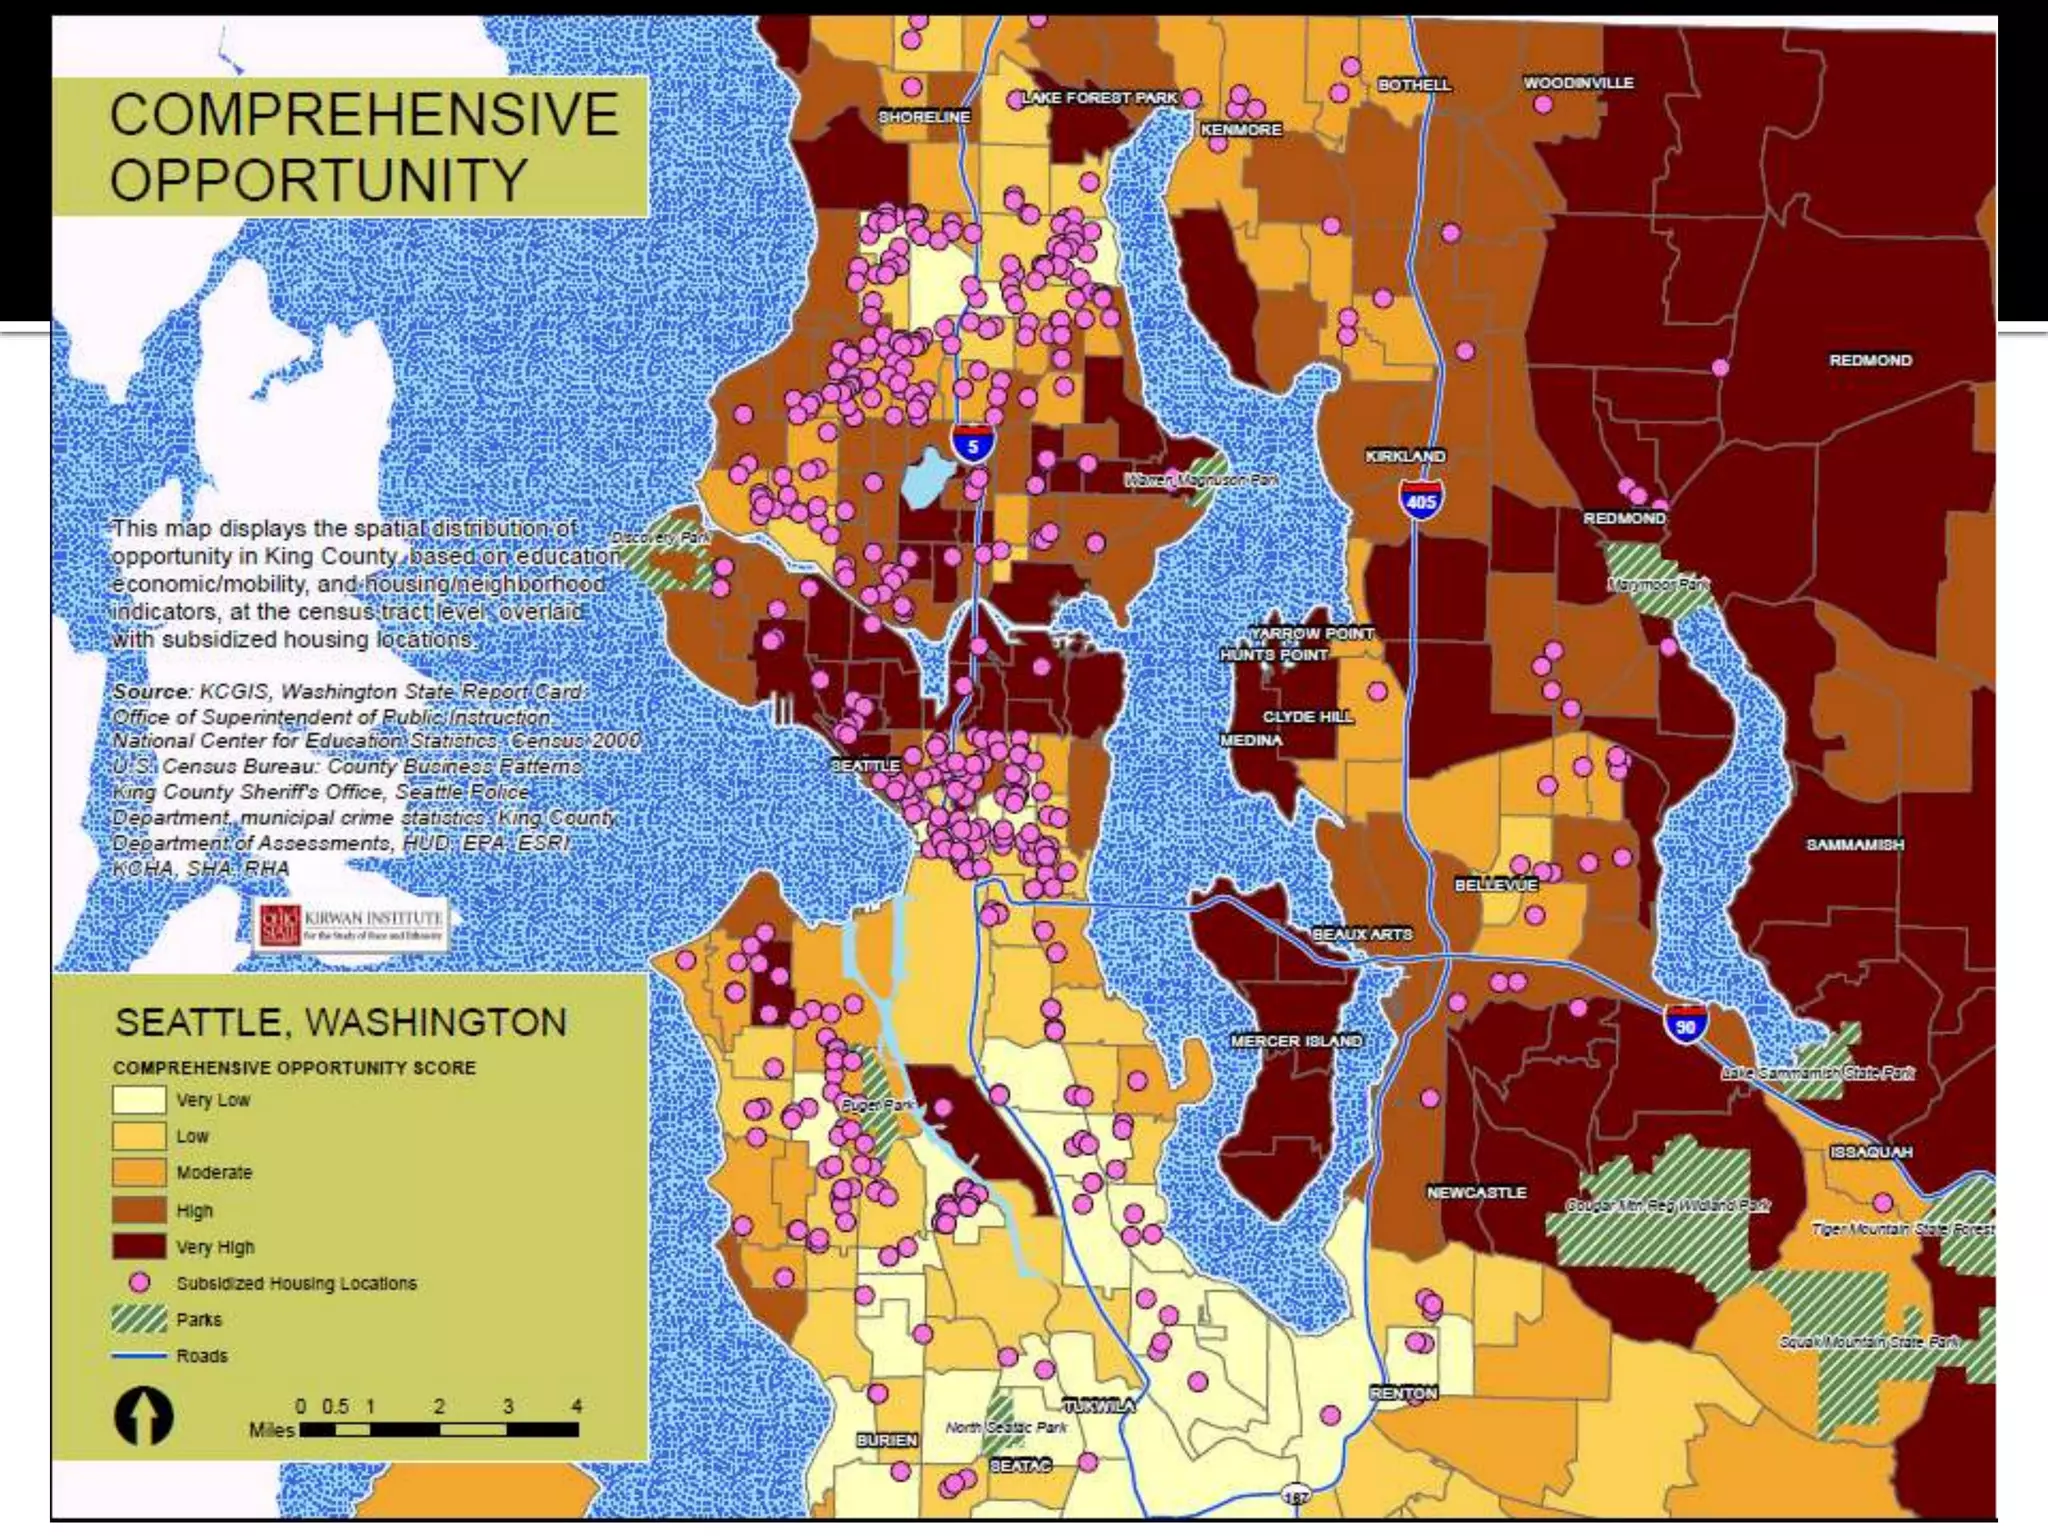
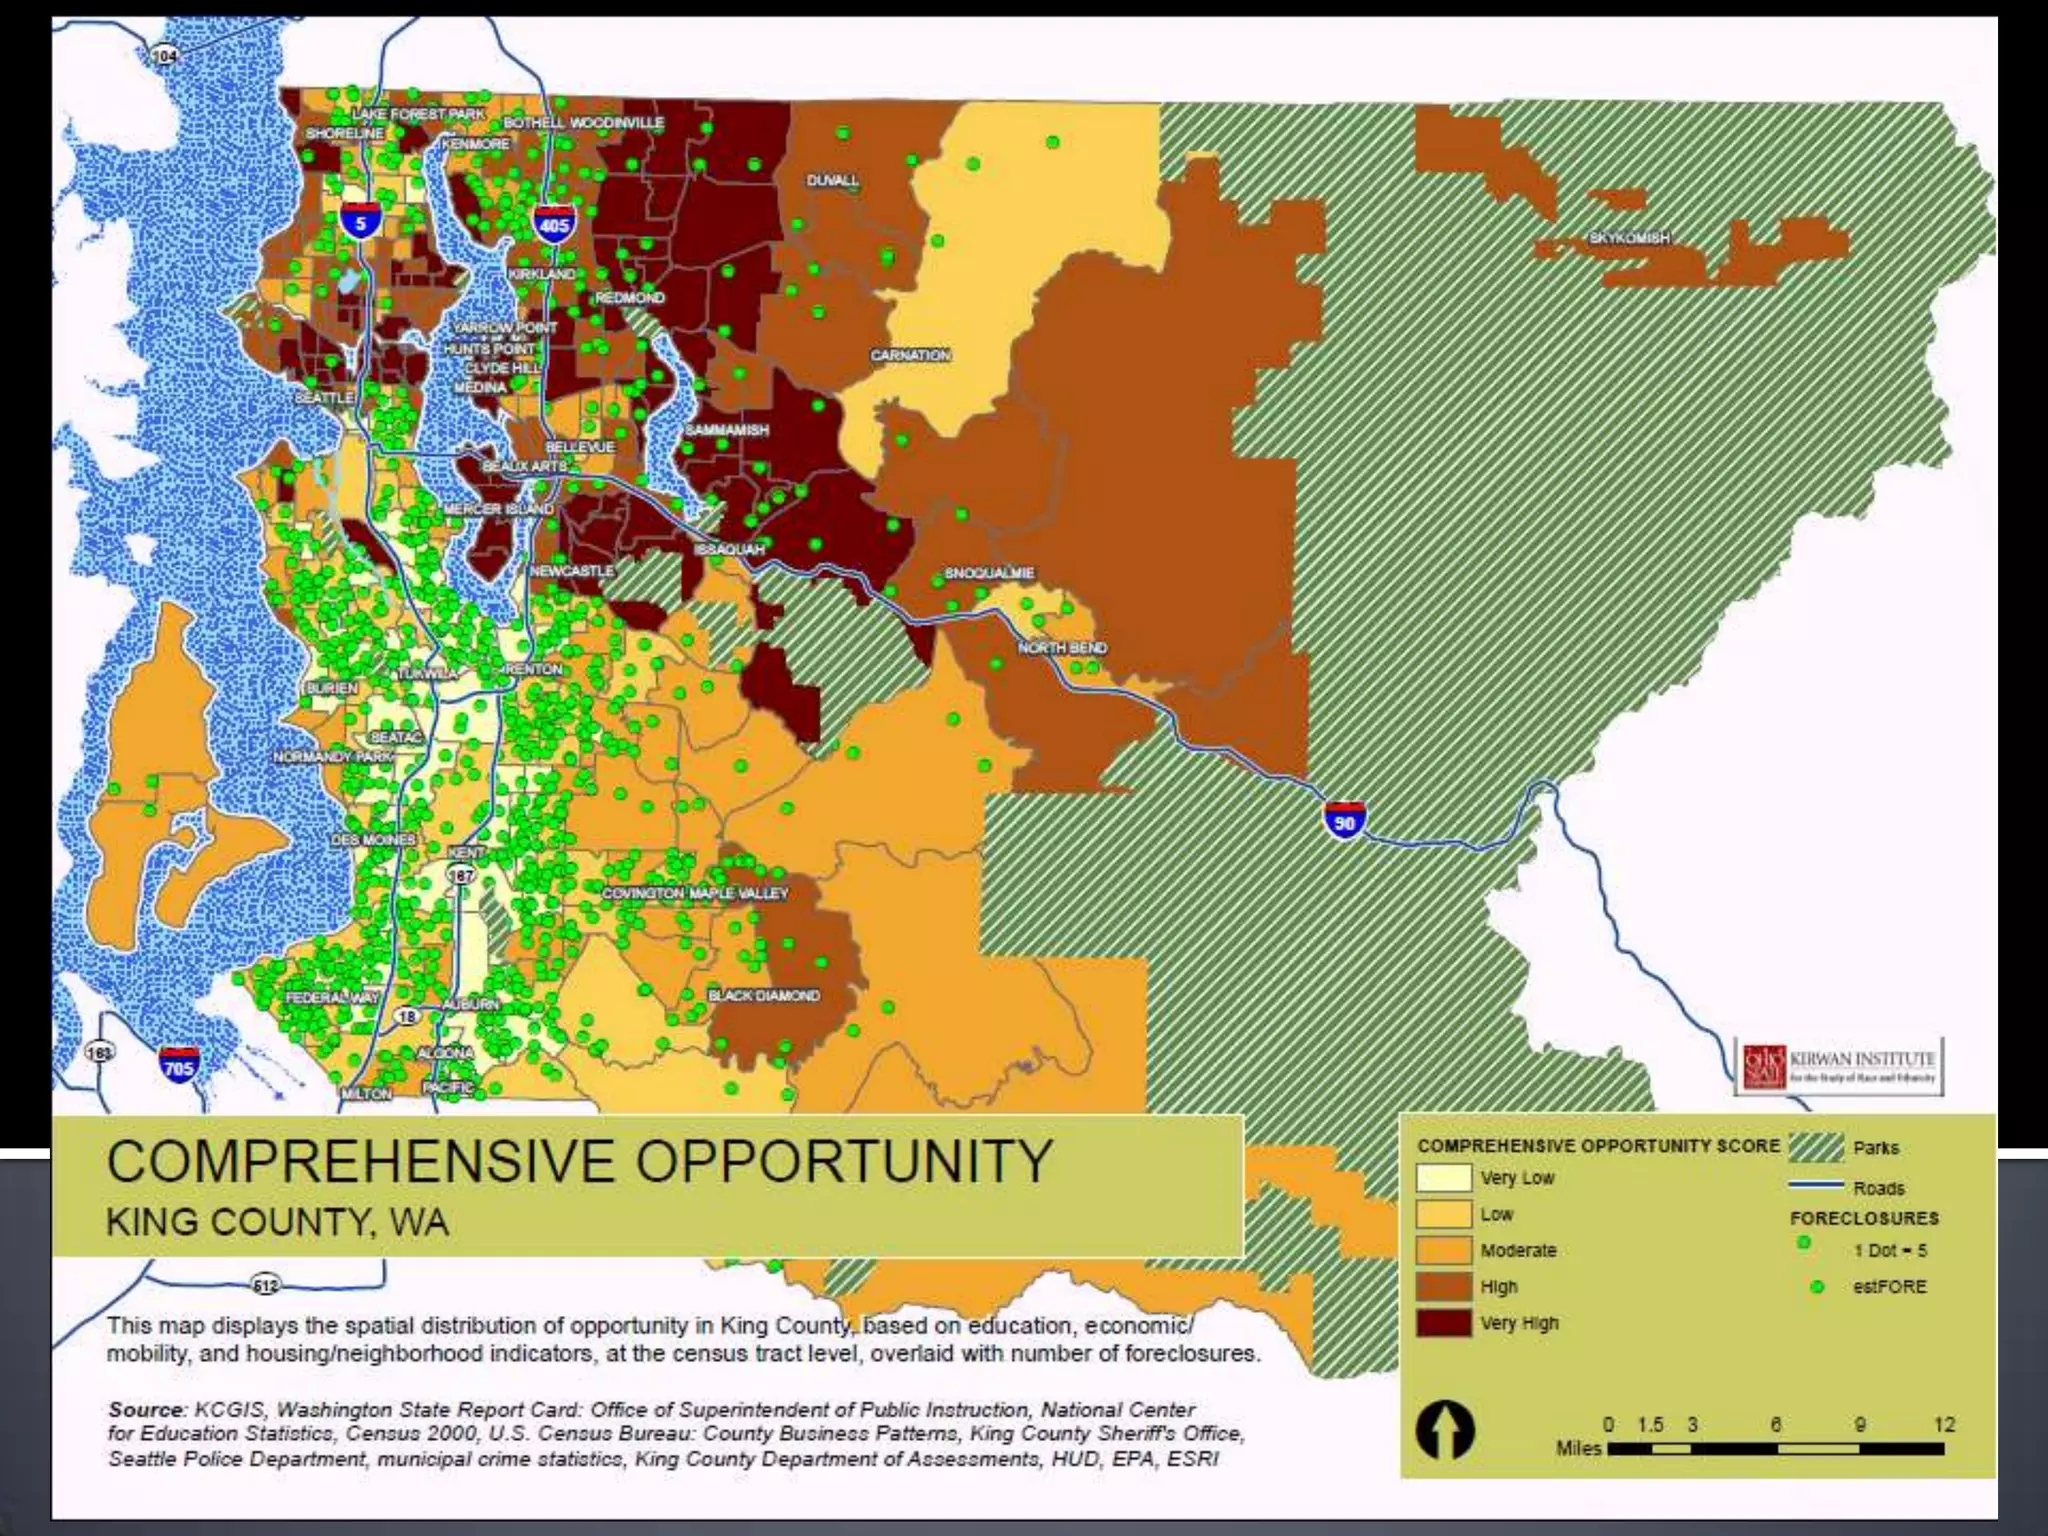
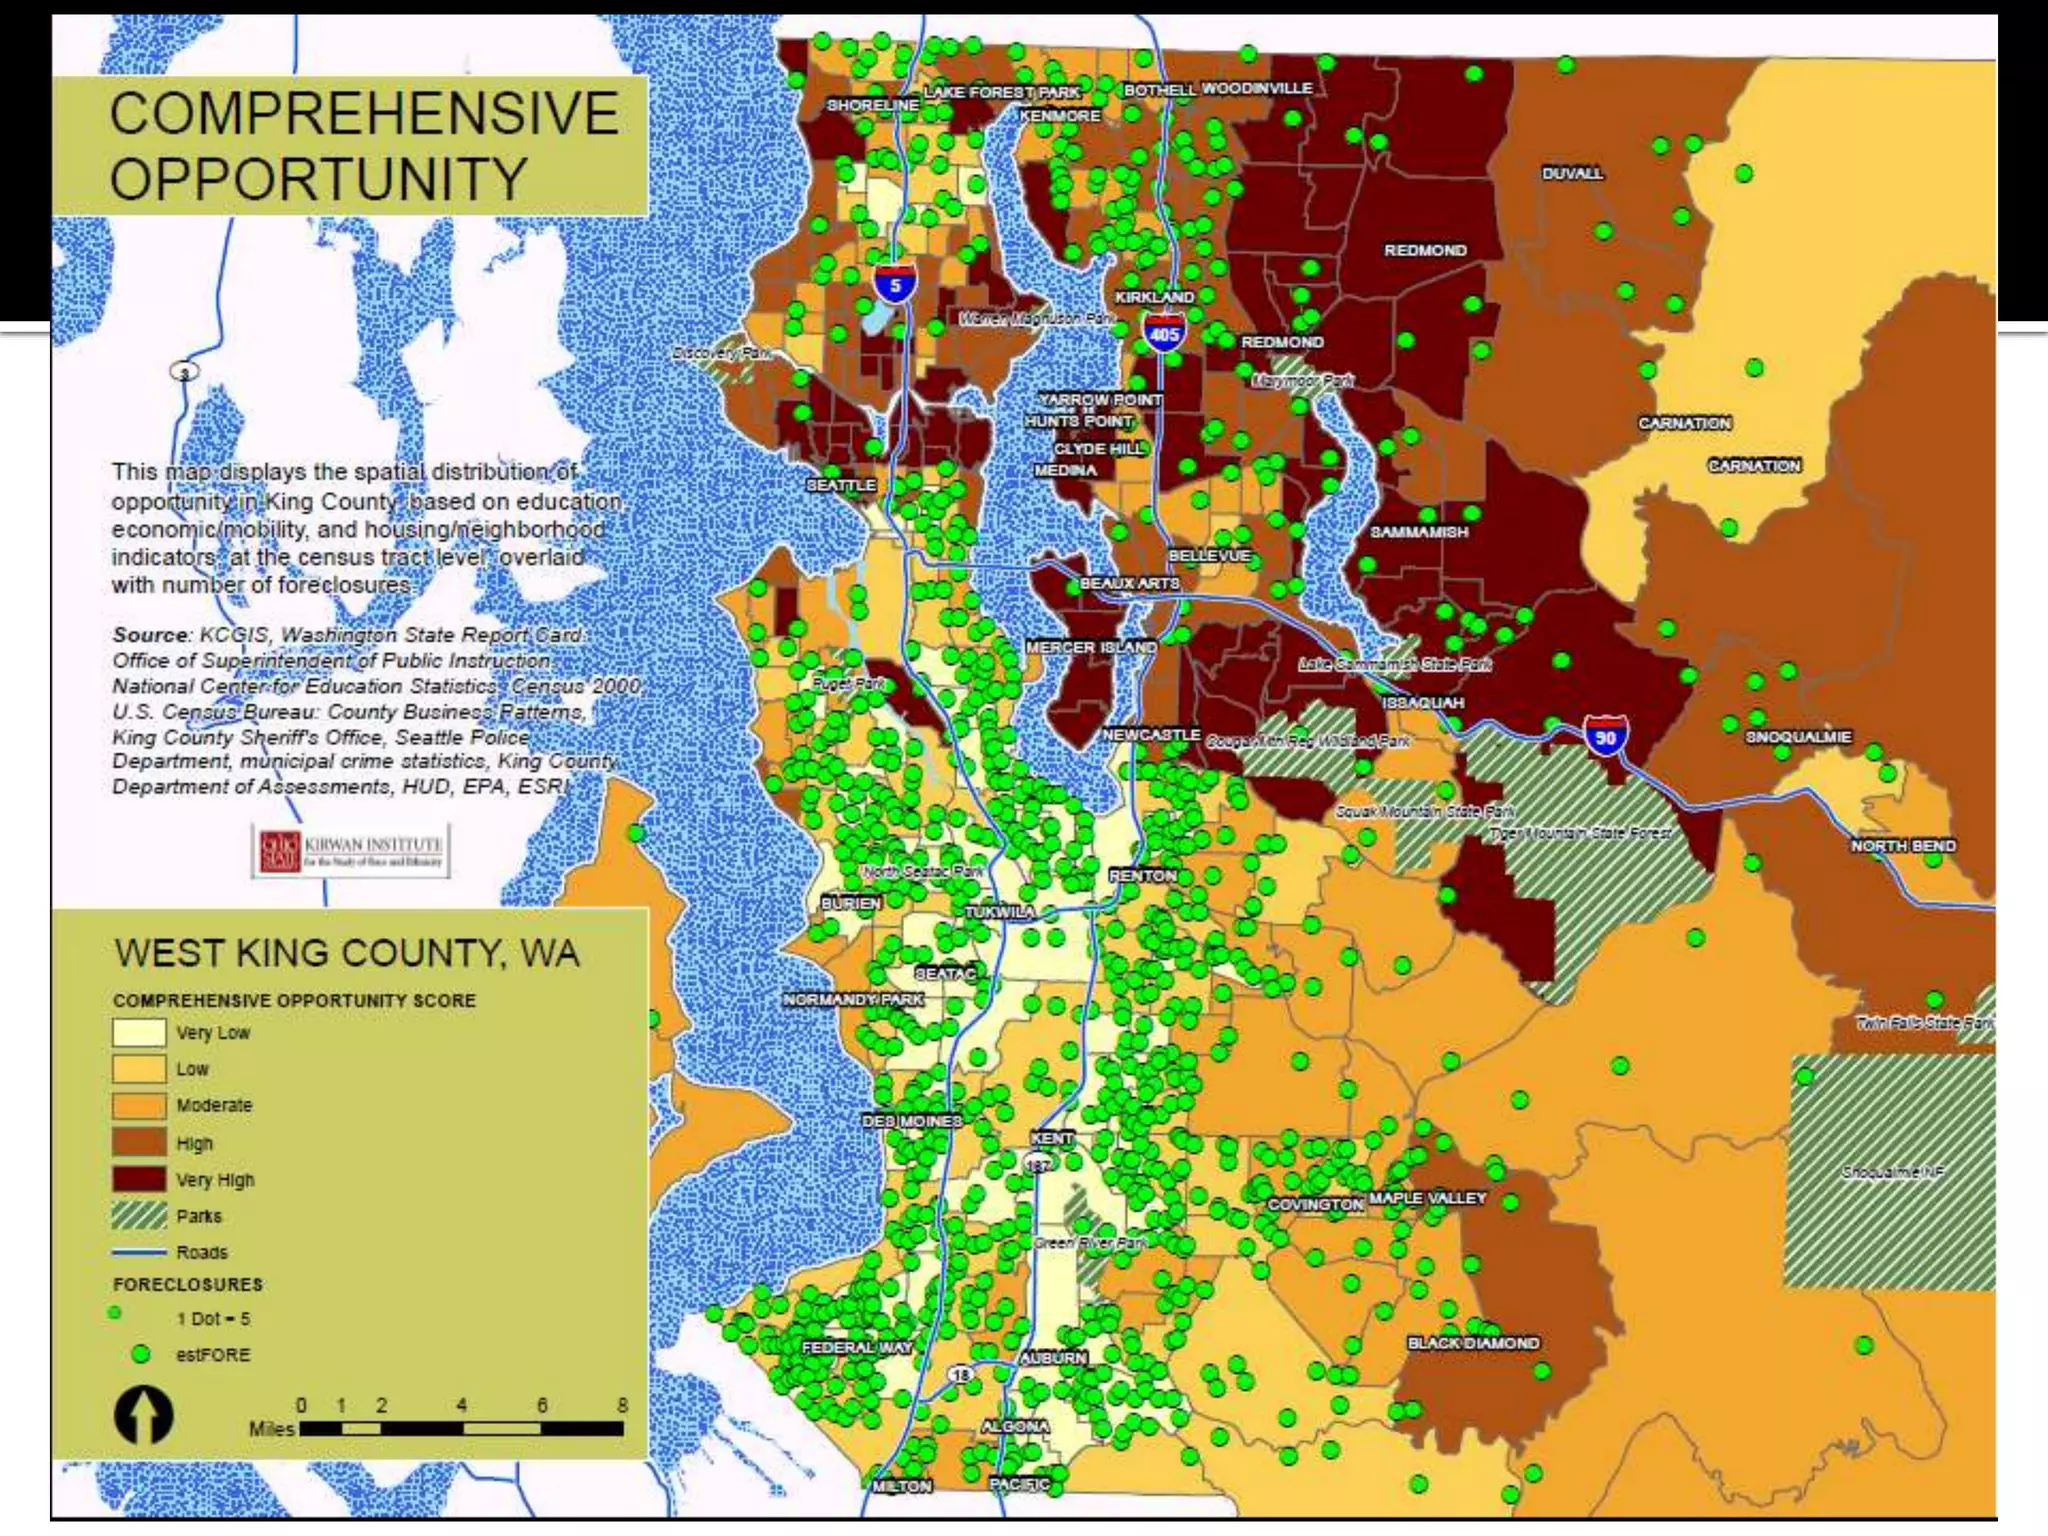
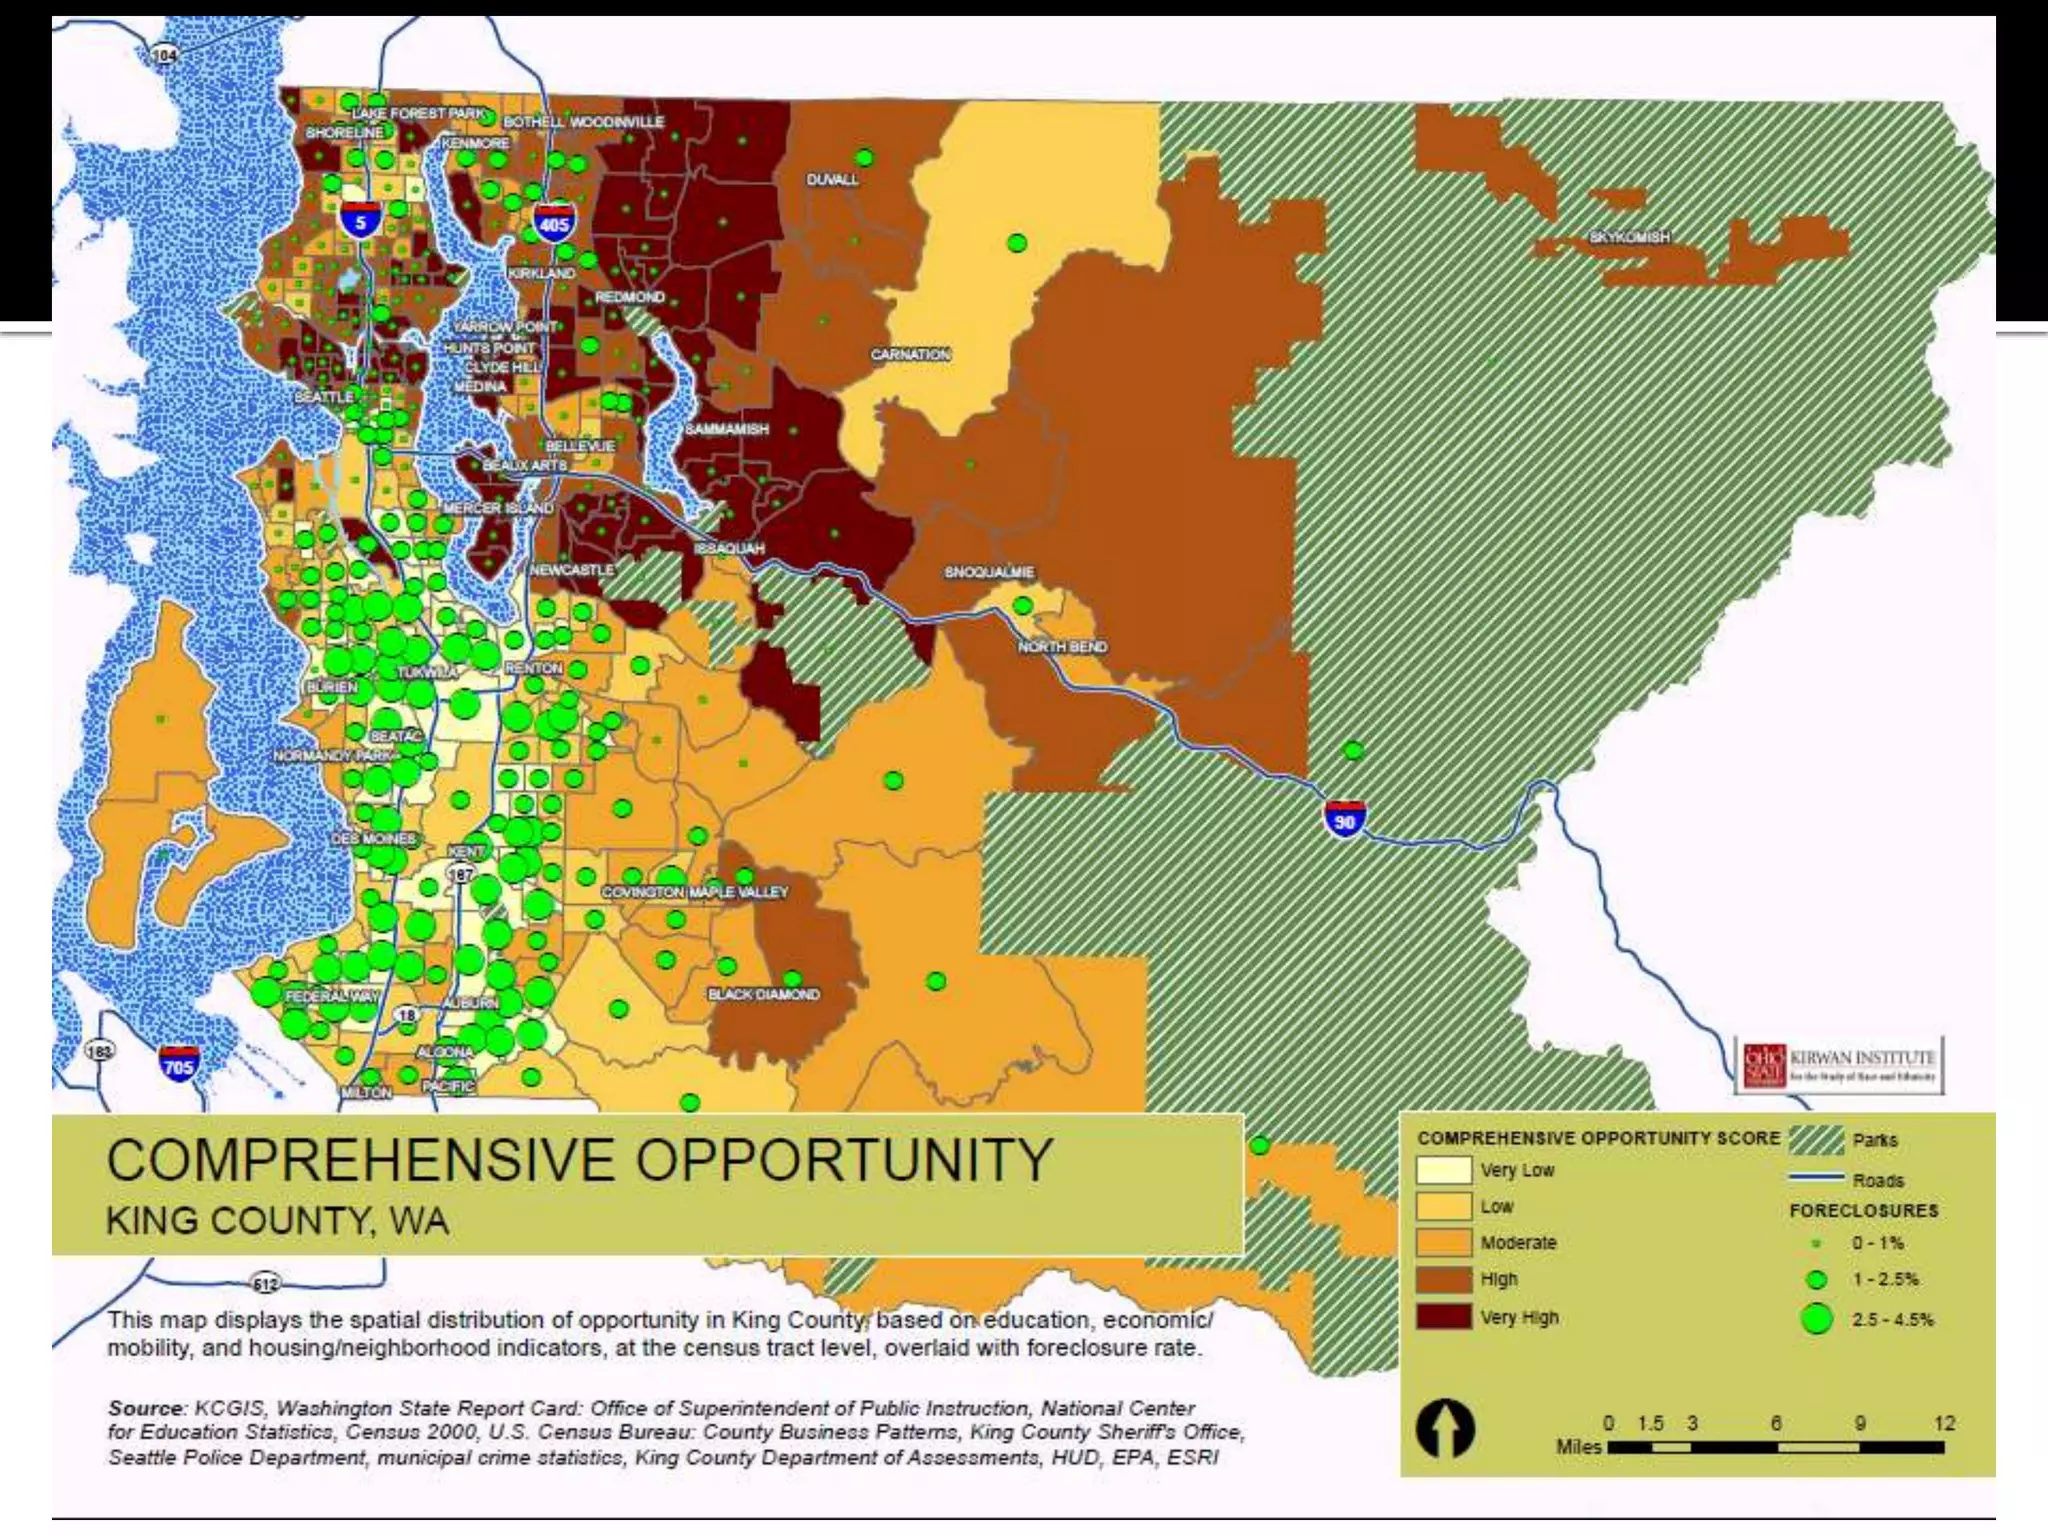
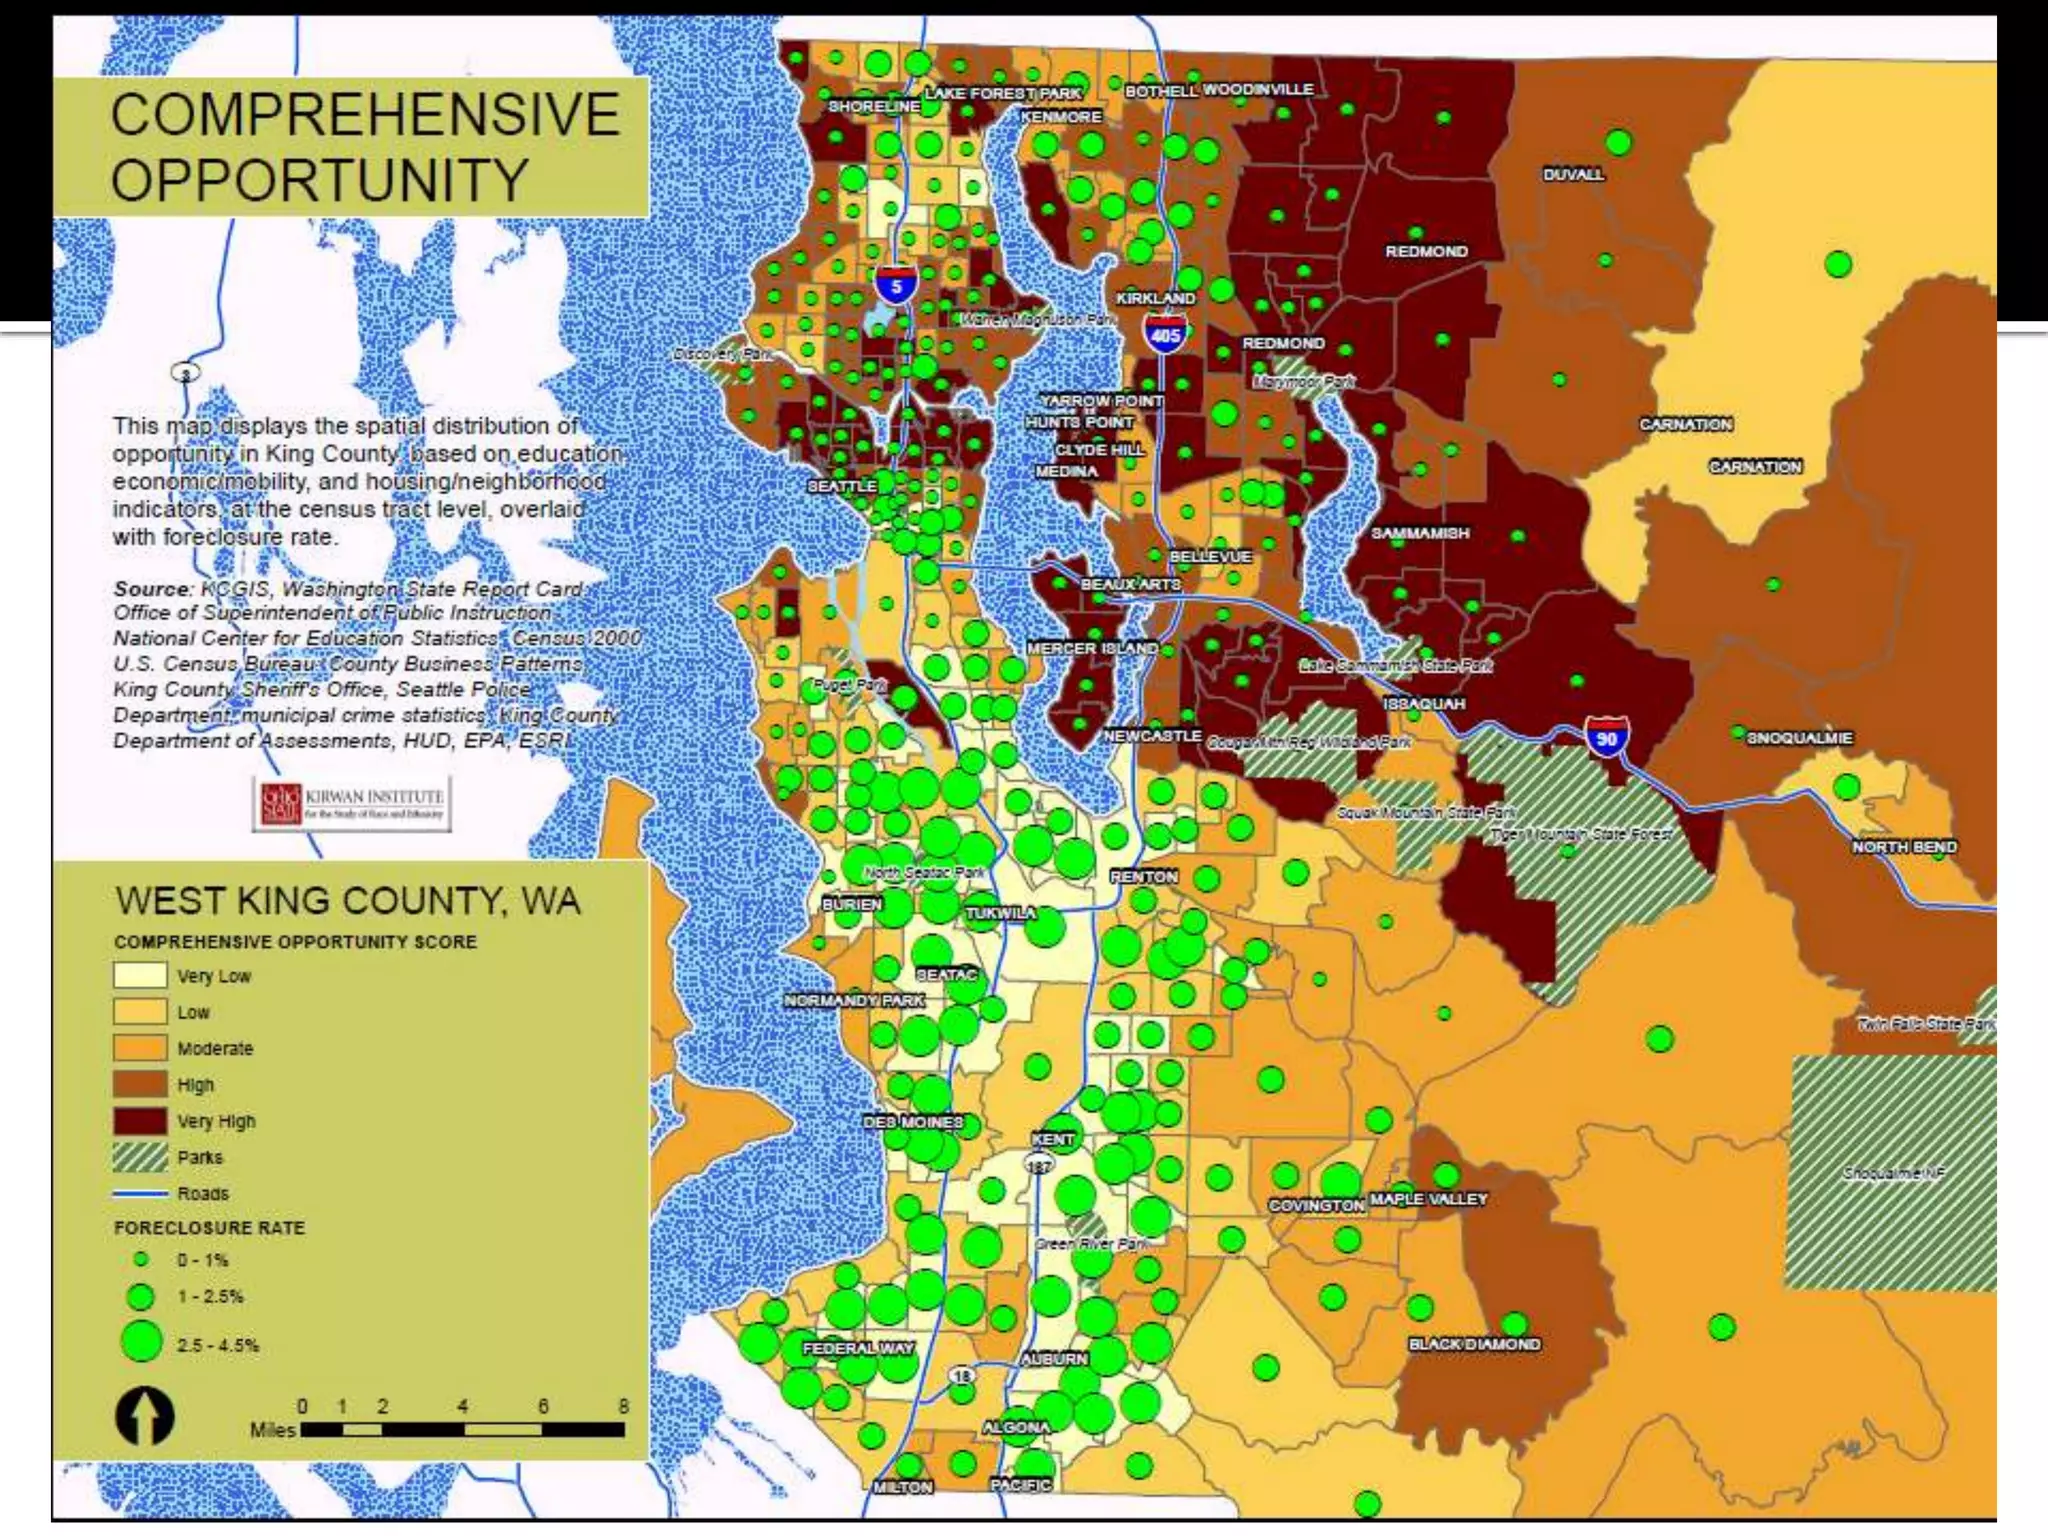
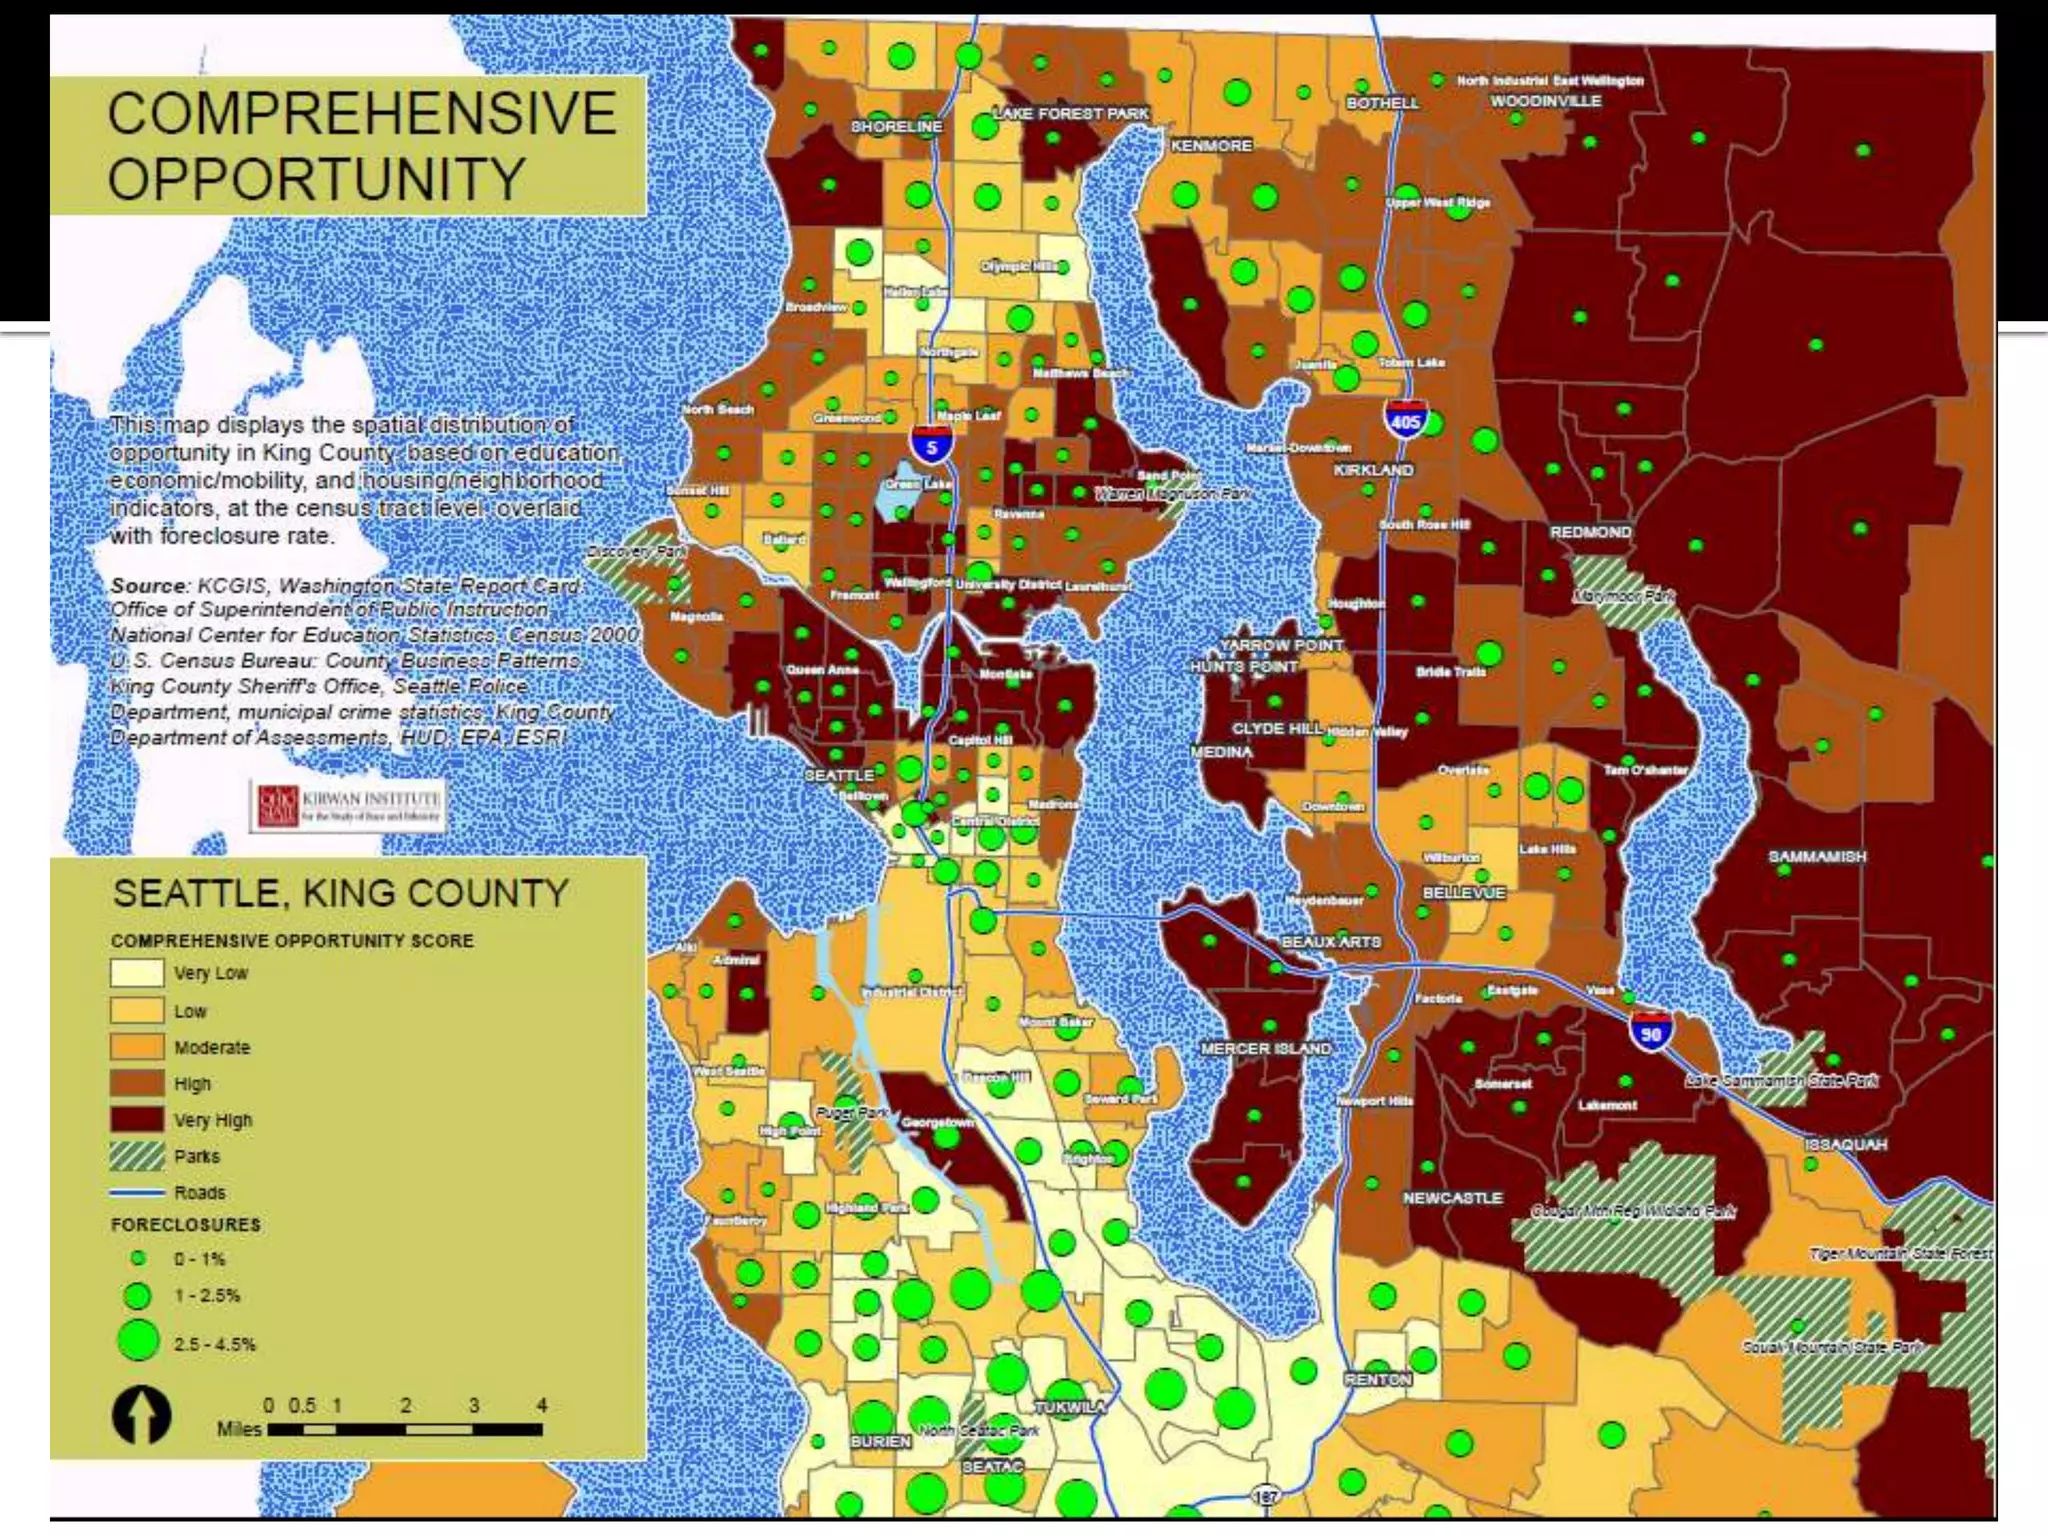
Apidays New York 2024 - The value of a flexible API Management solution for O...
King County Opportunity Mapping: Introduction and Preliminary Results
1. The Future of Fair Housing Regional Convening
Co-Sponsored by the Northwest Justice Project & the Kirwan Institute for the Study
of Race & Ethnicity
Supported by PRRAC and the Casey Foundation
Seattle, WA
October 30th 2009
Presented by:
Jason Reece, Senior Researcher (Reece.35@osu.edu)
The Kirwan Institute for the Study of Race & Ethnicity
The Ohio State University
2. Background on this work
What is Opportunity Mapping?
Why use data or GIS/mapping for advocacy?
How is it done? What is it used for?
Early Results
Preliminary results
What’s next?
2
4. Multidisciplinary applied research
institute
Our mission is to expand opportunity
for all, especially for our most
marginalized communities
Founded in 2003 by john powell
Opportunity Communities Program
(1/3 of staff)
▪ Opening pathways to opportunity for
marginalized communities through
investments in people, places and
supporting linkages
▪ Opportunity mapping
4
5. “Opportunity” is a situation or condition that places individuals in a
position to be more likely to succeed or excel.
Opportunity structures are critical to opening pathways to success:
High-quality education
Healthy and safe environment
Stable housing
Sustainable employment
Political empowerment
Outlets for wealth-building
Positive social networks
6. Five decades of research
indicate that your environment
has a profound impact on your
access to opportunity and
likelihood of success
High poverty areas with poor
employment, underperforming
schools, distressed housing and
public health/safety risks
depress life outcomes
A system of disadvantage
Many manifestations
▪ Urban, rural, suburban
People of color are far more
likely to live in opportunity
deprived neighborhoods and
communities
6
7. Emphasis on how systems work to produce inequity
How do multiple issues interact to either depress or uplift
certain populations or communities?
What can we do to “strategically intervene” and improve
outcomes for marginalized communities
Extensive use of mapping in our work
Inequity has a geographic footprint
Leverage points sometimes geographic in scope
Maps powerful for both research and communicating
research/issues to the public and other stakeholders
7
8. The power of GIS
Overlays of data/information
▪ Depth of analysis – because of its
storage and overlay capabilities, GIS
allows analysis which would be
difficult or impossible without GIS
technology
▪ Interaction of variables: GIS allows for
extensive exploration of the
interaction between various
factors, primarily the focusing on
correlation and relationships (spatial)
8
9. Why is a map an
excellent visual tool to
inform someone about
an issue/problem or
solution?
Maps are incredibly efficient,
compacting volumes of data
into single pictures that can
be understood at a glance
▪ One map may contain tens of
thousands of pieces of
information than can be
understood in seconds
A good map can enable you to
tell a story or solve a problem
▪ Research has shown that
people can solve problems
faster with map based
information, than by looking
at charts, tables or graphs
9
10. Redlining Map of Philadelphia, PA
Mapping is just
another analytical &
communications
tool
Can produce good or
bad results
How can we
effectively use
maps for advocacy?
10
11. The King County Opportunity Mapping
Initiative
Leadership
▪ The Northwest Justice Project – initiated the work
Kirwan assisting as partner to conduct mapping
and analysis
Supported with small grant funding provided by
PRRAC and the Casey Foundation
11
12. The use of mapping or neighborhood information
for policy making/advocacy or to address
poverty/equity issues is advanced
King County – national leader in using data/mapping
Other nearby activities – Portland’s equity atlas;
Opportunity mapping efforts in Washington County, OR
Much better data availability here than in other
states/metropolitan areas
12
13. What is it? How do you do it? What is it used for?
13
14. The Kirwan Institute has conducted
“opportunity mapping” for states and
metropolitan regions across the US
Projects in at least a dozen states
Why identify the “State of Opportunity”
How are low-income groups situated in the State?
How are racial and ethnic groups situated?
What can be done to improve the opportunity
landscape?
15. How do you map opportunity?
Data representing community conditions was
gathered for neighborhood (census tracts) across the
state or region
▪ Data for all indicators of community conditions was
aggregated to the Census Tract level and analyzed to create
a comprehensive opportunity index for the census tracts
(neighborhoods) throughout the state or region
The opportunity index is then mapped and census
tracts are broken into quintiles based on their
opportunity score
▪ Very Low, Low, Moderate, High, Very High
16. Example of an Opportunity Map:
Detroit MI
(Dark Areas = Most Opportunity
Rich Communities)
(Light Areas = Most Opportunity
Deprived Areas)
Analysis and Narrative:
African American men are isolated
from neighborhoods of opportunity
in Detroit
16
17. In the past five years our opportunity
mapping has been utilized in communities
across the nation to promote social justice
Expanding opportunity for marginalized
groups
Recent examples:
▪ Public housing residents and fair housing in Baltimore,
MD
▪ Legal services neighborhoods and racial isolation in
MA
▪ Austin Opportunity Initiative
18. Director powell’s involvement in
both the liability and remedy
phases of the litigation, on behalf
of NAACP Legal Defense Fund
and the Maryland ACLU
Used the opportunity community
model to identify solutions for a
fair housing for the Baltimore
region
▪ Potential impact on 7,000 public housing
families in the Baltimore region
19. Background on this project
Originated from effort to
incorporated structural analysis into
legal services
Partners
Massachusetts Law Reform
Institute, MA Legal Assistance Corp
and other Legal Services Entities
Impacts
▪ National Consumer Law Center, State opportunity
assessment, Planning/Advocacy on Affordable Housing,
Adopt a Zip Code
20. Opportunity mapping used in
Austin to assess affordable
housing decisions and
promote regional multi-
disciplinary collaboration
Next step is to explore
“emerging opportunity areas”
for future affordable housing
investments
20
21. EDUCATION HOUSING & NEIGHBORHOOD
Student poverty rates HEALTH
Reading/Math test scores
Home ownership rates
Adult educational attainment
Crime incidence
Teacher qualifications
Vacancy rates
Graduation rate
Home value appreciation
Neighborhood poverty rates
ECONOMIC HEALTH Population change
Proximity to parks/open space
Proximity to employment
Proximity to toxic waste release
Commute times
sites
Job growth trends
Business start trends
Unemployment rate
Public assistance rate
21
23. KING COUNTY OPPORTUNITY MAPPING INDICATORS DATA MATRIX
EDUCATION DESCRIPTION
Reading Proficiency Scores 07-08 Test scores for neighborhood schools
Math Proficiency Scores 07-08 Test scores for neighborhood schools
Graduation Rates 07-08 Percentage of students graduating
Student Poverty or Economic Disadvantage 07-08 Percentage of economically disadvantaged students
Teacher Qualifications 07-08 Percentage of Highly Qualified Teachers (HQT)
Adult Educational Attainment Highest level of education attained by adults
ECONOMIC OPPORTUNITY AND MOBILITY
Proximity to employment Number of jobs within 5 miles of censustract centroids
Economic climate 1 Change in number of jobs within 5 miles of censustract centroids
Economic climate 2 Business creation within 5 miles
Percentage of Population on Public Assistance Percentage of people on public assistance
Unemployment Rate Percentage of workforce unemployed
Mean Commute Time Average work commute of census tract workers
HOUSING AND NEIGHBORHOODS
Crime Rates (if available) Crime index for Part 1 offenses
Home Ownership Rate Percentage of residence ownership by census tract
Residential Vacancy Rate Percentage of vacant houses by census tract
Property appreciation Percentage change in average home price from 2002-2007
Neighborhood Poverty Rate Percentage of people below poverty for whom the poverty level has been determined by censustracts
Population change Population change since 2000
Proximity to Toxic Waste Sites and Superfund Sites Census tracts are ranked based on their distance from these facilities and the amount of toxic waste released
Proximity to park and open spaces Percentage of area in sq.mile in each census tract
28. Opportunity mapping allows us to look at the
intersection of community conditions and a
number of other factors
Demographics (Race/Ethnicity/Class)
Policy Issues
▪ Affordable Housing
▪ Subprime Lending and Foreclosure
This is only a start
▪ Other issues to examine/explore?
28
29. Race Analysis
Neighborhood Type % African American % Asian % Latino % Whites
Low and Very Low Opp. 74.26% 55.11% 59.35% 36.29%
Moderate Opportunity 13.21% 15.17% 16.91% 21.10%
High and Very High Opp. 12.53% 29.72% 23.75% 42.61%
80%
60%
40%
20%
0%
Low and Very Moderate High and Very
Low Opp. Opportunity High Opp.
% African American % Asian
% Latino % Whites 29
30.
31.
32. Subsidized Housing Analysis
Neighborhood Type # Projects # Units % Projects % Units
Low and Very Low Opp. 286 11686 51.35% 63.67%
Moderate Opportunity 137 2752 24.60% 14.99%
High and Very High Opp. 134 3917 24.06% 21.34%
Grand Total 557 18355 100.00% 100.00%
32
33.
34.
35. Foreclosure Analysis
Neighborhood Type Estimated Foreclosures Estimated foreclosure Rate
Low and Very Low Opp. 65.28% 2.15%
Moderate Opportunity 19.20% 1.10%
High and Very High Opp. 15.51% 0.46%
Grand Total 100.00% 1.23%
35
36.
37.
38.
39.
40.
41. What does our analysis find and suggest?
People of color are disproportionately concentrated in
opportunity deprived communities
▪ Which places them within a system of disadvantage that ultimately
impacts life outcomes
▪ Creating both an individual and societal tragedy
Does subsidized housing reinforces opportunity isolation?
Will foreclosures widen the “opportunity divide”?
What are the implications of this challenge and how
can we formulate a response?
Opportunity based model of social justice and community
development
▪ Investments people, places and linkages
42. Opportunity
Based Fair
Housing
Planning for
Opportunity Neighborhood
Mapping Opportunity Revitalization
Communities
Equitable
Regional Policy
44. Immediate plans
Revise maps
Prepare final analysis
Prepare report
Distribute
Long term ideas (potential possible ideas)
Look at neighborhoods compared to nation
Move away from static maps
▪ Be more dynamic – e.g. where are emerging areas of opportunity?
Explore online platform?
44
45. We need your input & feedback
Indicators & data
The maps (any anomalies?)
Overlay analysis?
▪ What else should we look at or analyze?
How could this be useful for your work?
My contact information
E-mail at: Reece.35@osu.edu
45
46. The Advancement Projects – Healthy City Mapping System
www.healthycity.org
Maryland StateStat (Recovery projects)
http://mdimap.towson.edu/statestat//
Solar Boston
http://gis.cityofboston.gov/SolarBoston/
46