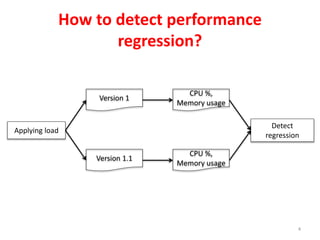
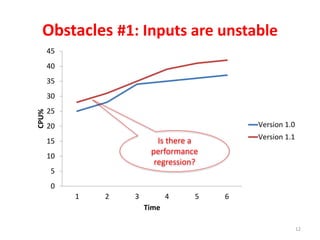
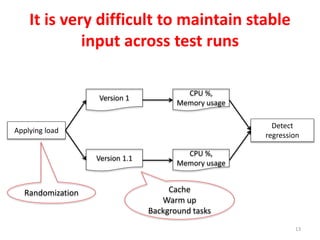
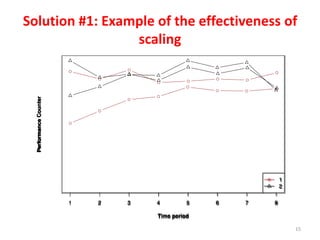
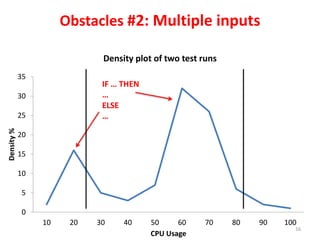
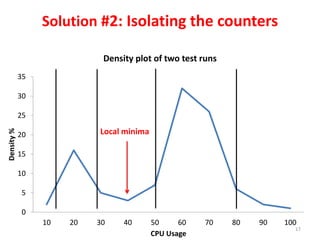
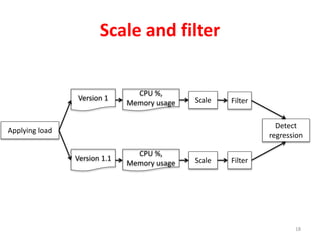
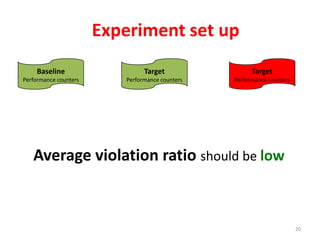
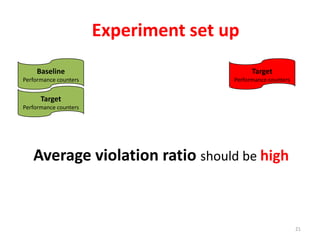
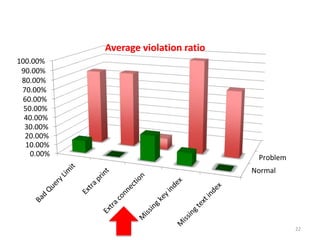
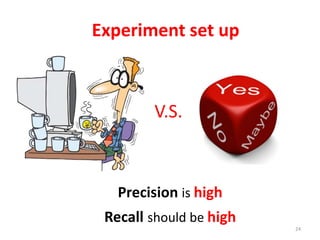
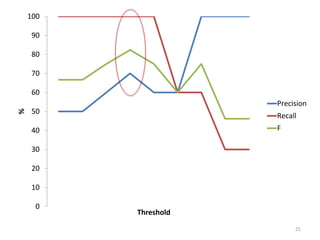
Automated Detection of Performance
Regressions Using Statistical Process Control
Techniques
Thanh Nguyen, Bram Adams, ZhenMing Jiang, Ahmed E. Hassan
Queen’s University, Kingston, Canada
Mohamed Nasser, Parminder Flora
Research in Motion, Waterloo, Canada
1
2
Performance Regression
What is a performance regression?
3
Version 1 Version 1.1

Baseline Target
How to detect performance
regression?
4
Applying load
Version 1.1
Version 1
CPU %,
Memory usage
CPU %,
Memory usage
Detect
regression
Challenge in Performance Regression
Testing
5
Layer 1 –
Agent 1
Layer 1 –
Agent 2
Layer 2 –
Agent 1
Layer 2 –
Agent 2
Layer 2 –
Agent 3
Layer 2 –
Agent 4
Layer 3 –
Agent 1
Layer 4 –
Agent 1
56 counters x 8 agents = 448 counters
56 counters x 2 agents = 112 counters
Layer 1 Layer 2
Lots of data
6
Data mining
Data mining -> Reduce and Relate
7
Reduce Relate
Proposed approach to use control charts to
find performance regression
8
Baseline
Performance counters
Target
Performance counters
Determine the
LCL, CL, UCL
730
735
740
745
750
755
760
765
770
775
0 5 10 15 20 25
Performance counter
Using control charts to verify load test
results
9
Baseline
Performance counters
Target
Performance counters
Determine the
LCL, CL, UCL
730
735
740
745
750
755
760
765
770
775
0 5 10 15 20 25
Performance counter
Violation
ratio
Reduce
10
Baseline
Performance counters
Target
Performance counters
Target
Performance counters
730
740
750
760
770
780
0 10 20 30
Performance counter
Baseline
Performance counters
720
730
740
750
760
770
780
0 10 20 30
Performance counter
Low
violation
ratio
High
violation
ratio
We can use violation ratio to detect
regression
Relate
11
Is there performance
regression?
Obstacles #1: Inputs are unstable
12
0
5
10
15
20
25
30
35
40
45
1 2 3 4 5 6
CPU%
Time
Version 1.0
Version 1.1Is there a
performance
regression?
It is very difficult to maintain stable
input across test runs
13
Applying load
Version 1.1
Version 1
CPU %,
Memory usage
CPU %,
Memory usage
Detect
regression
Randomization Cache
Warm up
Background tasks
Solution #1: Scale the counter according to
the input
• Step 1: Determine α and β
• Step 2:
14
CPU% Request/s
c = a *l + b
¢ct = ct *
a *lt + b
a *lb + b
Solution #1: Example of the effectiveness of
scaling
15
Obstacles #2: Multiple inputs
16
0
5
10
15
20
25
30
35
10 20 30 40 50 60 70 80 90 100
Density%
CPU Usage
Density plot of two test runs
IF … THEN
…
ELSE
…
0
5
10
15
20
25
30
35
10 20 30 40 50 60 70 80 90 100
Density%
CPU Usage
Density plot of two test runs
Solution #2: Isolating the counters
17
Local minima
Scale and filter
18
Applying load
Version 1.1
Version 1
CPU %,
Memory usage
CPU %,
Memory usage
Detect
regression
Scale
Scale
Filter
Filter
19
Case study 1
Experiment set up
20
Baseline
Performance counters
Target
Performance counters
Target
Performance counters
Average violation ratio should be low
21
Baseline
Performance counters
Target
Performance counters
Target
Performance counters
Average violation ratio should be high
Experiment set up
22
Normal
Problem0.00%
10.00%
20.00%
30.00%
40.00%
50.00%
60.00%
70.00%
80.00%
90.00%
100.00%
Average violation ratio
23
Case study 2
24
Experiment set up
V.S.
Precision is high
Recall should be high
25
0
10
20
30
40
50
60
70
80
90
100
%
Threshold
Precision
Recall
F
26

Automated Detection of Performance Regressions Using Statistical Process Control Techniques