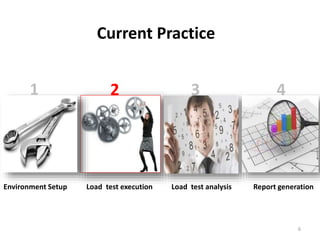
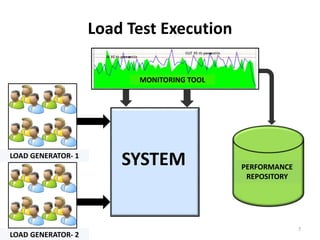
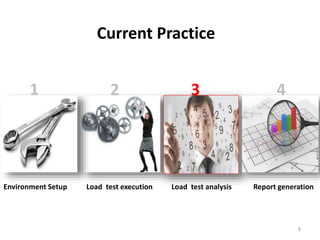
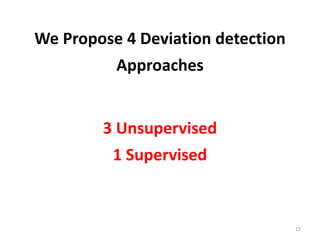
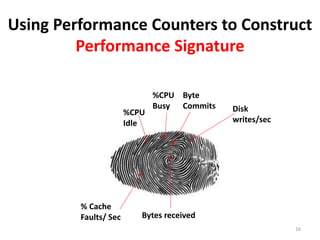
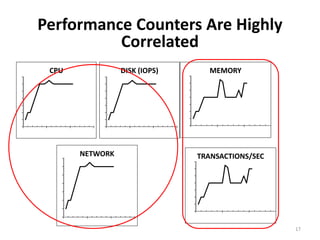
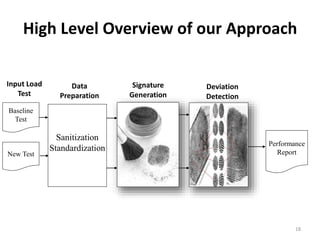
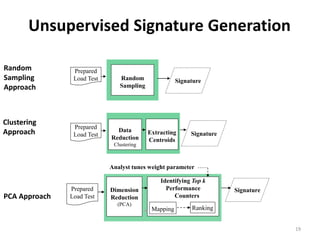
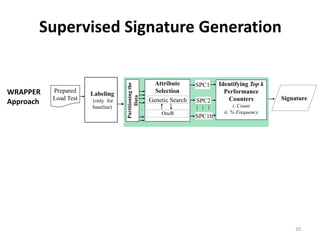
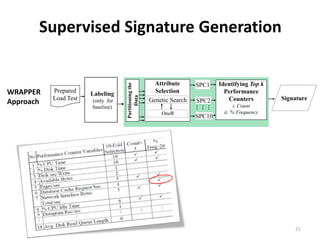
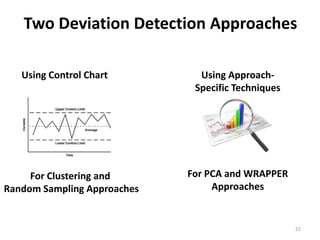
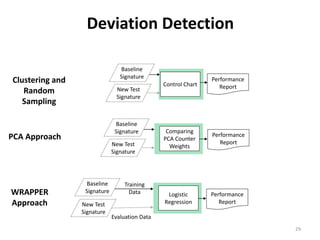
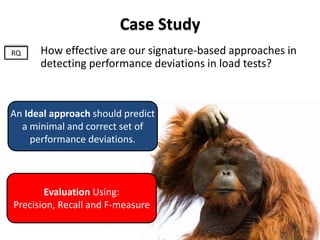
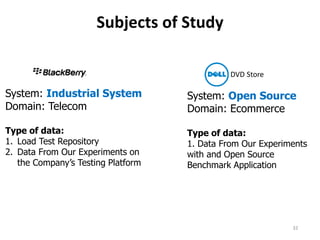
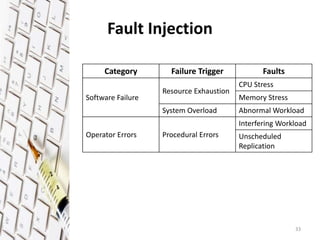
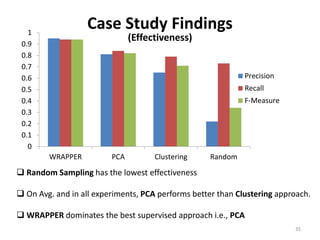
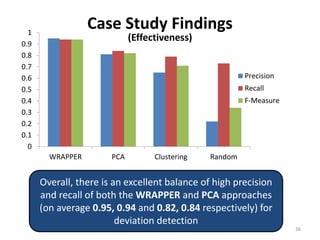
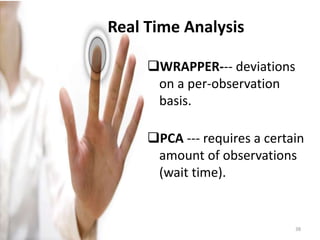
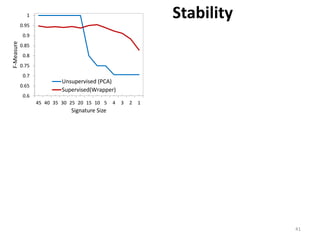
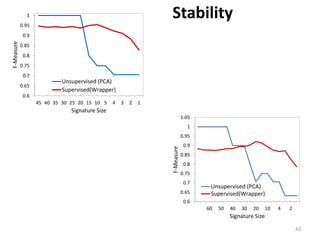
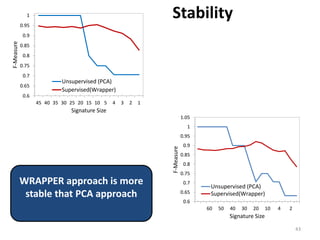
Automatic Detection of
Performance Deviations in the Load
Testing of Large Scale Systems
Haroon Malik
Software Analysis and
Intelligence Lab (SAIL)
Queen’s University, Kingston,
Canada
Hadi Hemmati
Software Architecture Group
(SWAG)
University of Waterloo,
Waterloo, Canada
Ahmed E. Hassan
Software Analysis and
Intelligence Lab (SAIL)
Queen’s University, Kingston,
Canada
Performance
Team
Canada
Large scale systems need to satisfy
performance constraints
Environment setup Load test execution Load test analysis Report generation
Current Practice
1 2 3 4
4
Environment Setup Load test execution Load test analysis Report generation
1 2 3 4
5
Current Practice
Environment Setup Load test execution Load test analysis Report generation
1 2 3 4
6
Current Practice
Load Test Execution
MONITORING TOOL
LOAD GENERATOR- 1
SYSTEM PERFORMANCE
REPOSITORY
LOAD GENERATOR- 2
7
Environment Setup Load test execution Load test analysis Report generation
1 2 3 4
8
Current Practice
Environment Setup Load test execution Load test analysis Report generation
1 2 3 4
9
Current Practice
Environment Setup Load test execution Load test analysis Report generation
1 2 3 4
10
Current Practice
Challenges with Load Test Analysis
Limited
Knowledge
Large Number of Counters
1 2 3
11
Challenges with Load Test Analysis
Limited
Knowledge
Large Number of Counters
1 2 3
12
Challenges with Load Test Analysis
Limited
Knowledge
Large Number of Counters
1 2 3
13
Challenges with Load Test Analysis
Limited
Knowledge
Large Number of Counters
1 2 3
14
We Propose 4 Deviation detection
Approaches
15
3 Unsupervised
1 Supervised
Using Performance Counters to Construct
Performance Signature
16
%CPU
Idle
%CPU
Busy
Byte
Commits Disk
writes/sec
% Cache
Faults/ Sec Bytes received
Performance Counters Are Highly
Correlated
CPU DISK (IOPS)
NETWORK
MEMORY
TRANSACTIONS/SEC
17
High Level Overview of our Approach
Data
Preparation
Signature
Generation
Deviation
Detection
Baseline
Test
New Test
Sanitization
Standardization
Performance
Report
Input Load
Test
18
Prepared
Load Test Extracting
Centroids
Signature
Data
Reduction
Clustering
Prepared
Load Test Random
Sampling
Signature
Unsupervised Signature Generation
Random
Sampling
Approach
Clustering
Approach
SignaturePrepared
Load Test
Dimension
Reduction
(PCA)
Identifying Top k
Performance
Counters
Mapping Ranking
Analyst tunes weight parameter
PCA Approach
19
Supervised Signature Generation
Identifying Top k
Performance
Counters
i. Count
ii. % Frequency
Attribute
Selection
OneR
Genetic Search
…
…
…
SPC1
SPC2
SPC10
.
.
.
Partitioningthe
Data
Prepared
Load Test
Labeling
(only for
baseline)
WRAPPER
Approach Signature
20
Supervised Signature Generation
Identifying Top k
Performance
Counters
i. Count
ii. % Frequency
Attribute
Selection
OneR
Genetic Search
…
…
…
SPC1
SPC2
SPC10
.
.
.
Partitioningthe
Data
Prepared
Load Test
Labeling
(only for
baseline)
WRAPPER
Approach Signature
21
Two Deviation Detection Approaches
Using Control Chart Using Approach-
Specific Techniques
22
For Clustering and
Random Sampling Approaches
For PCA and WRAPPER
Approaches
Control Chart
0
2
4
6
8
10
12
14
16
1 2 3 4 5 6 7 8 9 10 11
PerformanceCounterValue
Time (min)
Baseline Load Test
New Load Test
23
Control Chart
0
2
4
6
8
10
12
14
16
1 2 3 4 5 6 7 8 9 10 11
PerformanceCounterValue
Time (min)
Baseline Load Test
New Load Test
24
Control Chart
0
2
4
6
8
10
12
14
16
1 2 3 4 5 6 7 8 9 10 11
PerformanceCounterValue
Time (min)
Baseline Load Test
New Load Test
25
Control Chart
0
2
4
6
8
10
12
14
16
1 2 3 4 5 6 7 8 9 10 11
PerformanceCounterValue
Time (min)
Baseline Load Test
New Load Test
Control Chars use control limits (CL) to represent
the limits of variation that should be expected
from a process.
26
Control Chart
0
2
4
6
8
10
12
14
16
1 2 3 4 5 6 7 8 9 10 11
PerformanceCounterValue
Time (min)
Baseline Load Test
New Load Test
Baseline CL
Central Limit (CL): the median of all values of the
performance counters in a baseline load test
27
Control Chart
0
2
4
6
8
10
12
14
16
1 2 3 4 5 6 7 8 9 10 11
PerformanceCounterValue
Time (min)
Baseline Load Test
New Load Test
Baseline LCL, UCL
The Upper/Lower Control Limits (U/LCL) is the
upper/lower limit of the range of a counter
under the normal behavior of the system
Baseline CL
28
Deviation Detection
Clustering and
Random
Sampling
PCA Approach Performance
Report
Comparing
PCA Counter
Weights
Baseline
Signature
New Test
Signature
Training
Data
Evaluation Data
WRAPPER
Approach
29
Baseline
Signature
New Test
Signature
Control Chart
Performance
Report
Performance
Report
Logistic
Regression
Baseline
Signature
New Test
Signature
Case Study
How effective are our signature-based approaches in
detecting performance deviations in load tests?
RQ
30
Case Study
How effective are our signature-based approaches in
detecting performance deviations in load tests?
RQ
An Ideal approach should predict
a minimal and correct set of
performance deviations.
Evaluation Using:
Precision, Recall and F-measure
31
Subjects of Study
System: Open Source
Domain: Ecommerce
Type of data:
1. Data From Our Experiments
with and Open Source
Benchmark Application
DVD Store
32
System: Industrial System
Domain: Telecom
Type of data:
1. Load Test Repository
2. Data From Our Experiments on
the Company’s Testing Platform
Fault Injection
Category Failure Trigger Faults
Software Failure
Resource Exhaustion
CPU Stress
Memory Stress
System Overload Abnormal Workload
Operator Errors Procedural Errors
Interfering Workload
Unscheduled
Replication
33
Case Study Findings
Effectiveness
Precision/Recall/F-measure
Practical
Differences
34
Case Study Findings
(Effectiveness)
0
0.1
0.2
0.3
0.4
0.5
0.6
0.7
0.8
0.9
1
WRAPPER PCA Clustering Random
Precision
Recall
F-Measure
 Random Sampling has the lowest effectiveness
 On Avg. and in all experiments, PCA performs better than Clustering approach.
 WRAPPER dominates the best supervised approach i.e., PCA
35
Case Study Findings
(Effectiveness)
0
0.1
0.2
0.3
0.4
0.5
0.6
0.7
0.8
0.9
1
WRAPPER PCA Clustering Random
Precision
Recall
F-Measure
36
Overall, there is an excellent balance of high precision
and recall of both the WRAPPER and PCA approaches
(on average 0.95, 0.94 and 0.82, 0.84 respectively) for
deviation detection
Real Time Analysis Stability Manual Overhead
Case Study Findings
(Practical Differences)
37
Real Time Analysis
WRAPPER--- deviations
on a per-observation
basis.
PCA --- requires a certain
amount of observations
(wait time).
38
Stability
 We refer to ‘Stability’
as the ability of an
approach to remain
effective while its
signature size is
reduced.
39
0.6
0.65
0.7
0.75
0.8
0.85
0.9
0.95
1
45 40 35 30 25 20 15 10 5 4 3 2 1
F-Measure
Signature Size
Unsupervised (PCA)
Supervised(Wrapper)
Stability
40
0.6
0.65
0.7
0.75
0.8
0.85
0.9
0.95
1
45 40 35 30 25 20 15 10 5 4 3 2 1
F-Measure
Signature Size
Unsupervised (PCA)
Supervised(Wrapper)
Stability
41
0.6
0.65
0.7
0.75
0.8
0.85
0.9
0.95
1
45 40 35 30 25 20 15 10 5 4 3 2 1
F-Measure
Signature Size
Unsupervised (PCA)
Supervised(Wrapper)
Stability
0.6
0.65
0.7
0.75
0.8
0.85
0.9
0.95
1
1.05
60 50 40 30 20 10 4 2
F-Measure
Signature Size
Unsupervised (PCA)
Supervised(Wrapper)
42
0.6
0.65
0.7
0.75
0.8
0.85
0.9
0.95
1
45 40 35 30 25 20 15 10 5 4 3 2 1
F-Measure
Signature Size
Unsupervised (PCA)
Supervised(Wrapper)
Stability
0.6
0.65
0.7
0.75
0.8
0.85
0.9
0.95
1
1.05
60 50 40 30 20 10 4 2
F-Measure
Signature Size
Unsupervised (PCA)
Supervised(Wrapper)
WRAPPER approach is more
stable that PCA approach
43
Manual Overhead
WRAPPER approach requires all
observations of the baseline
performance counter data to be labeled
as Pass/Fail
44
Manual Overhead
Marking each observation is time
consuming
45
Limitations of Our Approaches
Hardware Difference Sensitivity
46
Hardware Differences
Large systems have many testing labs
to run multiple load tests
simultaneously.
 Labs may have different hardware.
Our approaches may interpret same test on
different labs as deviated tests
Recent work by K.C.Foo et al. propose several
techniques to over come this problem
Mining Performance Regression Testing Repositories for Automated Performance
Analysis ( QSIC 2010)
47
Sensitivity
We can tune the sensitivity of our
approaches.
 PCA – Analyst tunes the ‘weight’
parameter.
 WRAPPER – Analyst decides, in the
labelling phase, how big the deviation
should be in order to be flagged.
Lowering sensitivity reduces false alarms, it may overlook some
important outliers
48
49

Icse2013 malik

  • 1.
    Automatic Detection of PerformanceDeviations in the Load Testing of Large Scale Systems Haroon Malik Software Analysis and Intelligence Lab (SAIL) Queen’s University, Kingston, Canada Hadi Hemmati Software Architecture Group (SWAG) University of Waterloo, Waterloo, Canada Ahmed E. Hassan Software Analysis and Intelligence Lab (SAIL) Queen’s University, Kingston, Canada Performance Team Canada
  • 2.
    Large scale systemsneed to satisfy performance constraints
  • 4.
    Environment setup Loadtest execution Load test analysis Report generation Current Practice 1 2 3 4 4
  • 5.
    Environment Setup Loadtest execution Load test analysis Report generation 1 2 3 4 5 Current Practice
  • 6.
    Environment Setup Loadtest execution Load test analysis Report generation 1 2 3 4 6 Current Practice
  • 7.
    Load Test Execution MONITORINGTOOL LOAD GENERATOR- 1 SYSTEM PERFORMANCE REPOSITORY LOAD GENERATOR- 2 7
  • 8.
    Environment Setup Loadtest execution Load test analysis Report generation 1 2 3 4 8 Current Practice
  • 9.
    Environment Setup Loadtest execution Load test analysis Report generation 1 2 3 4 9 Current Practice
  • 10.
    Environment Setup Loadtest execution Load test analysis Report generation 1 2 3 4 10 Current Practice
  • 11.
    Challenges with LoadTest Analysis Limited Knowledge Large Number of Counters 1 2 3 11
  • 12.
    Challenges with LoadTest Analysis Limited Knowledge Large Number of Counters 1 2 3 12
  • 13.
    Challenges with LoadTest Analysis Limited Knowledge Large Number of Counters 1 2 3 13
  • 14.
    Challenges with LoadTest Analysis Limited Knowledge Large Number of Counters 1 2 3 14
  • 15.
    We Propose 4Deviation detection Approaches 15 3 Unsupervised 1 Supervised
  • 16.
    Using Performance Countersto Construct Performance Signature 16 %CPU Idle %CPU Busy Byte Commits Disk writes/sec % Cache Faults/ Sec Bytes received
  • 17.
    Performance Counters AreHighly Correlated CPU DISK (IOPS) NETWORK MEMORY TRANSACTIONS/SEC 17
  • 18.
    High Level Overviewof our Approach Data Preparation Signature Generation Deviation Detection Baseline Test New Test Sanitization Standardization Performance Report Input Load Test 18
  • 19.
    Prepared Load Test Extracting Centroids Signature Data Reduction Clustering Prepared LoadTest Random Sampling Signature Unsupervised Signature Generation Random Sampling Approach Clustering Approach SignaturePrepared Load Test Dimension Reduction (PCA) Identifying Top k Performance Counters Mapping Ranking Analyst tunes weight parameter PCA Approach 19
  • 20.
    Supervised Signature Generation IdentifyingTop k Performance Counters i. Count ii. % Frequency Attribute Selection OneR Genetic Search … … … SPC1 SPC2 SPC10 . . . Partitioningthe Data Prepared Load Test Labeling (only for baseline) WRAPPER Approach Signature 20
  • 21.
    Supervised Signature Generation IdentifyingTop k Performance Counters i. Count ii. % Frequency Attribute Selection OneR Genetic Search … … … SPC1 SPC2 SPC10 . . . Partitioningthe Data Prepared Load Test Labeling (only for baseline) WRAPPER Approach Signature 21
  • 22.
    Two Deviation DetectionApproaches Using Control Chart Using Approach- Specific Techniques 22 For Clustering and Random Sampling Approaches For PCA and WRAPPER Approaches
  • 23.
    Control Chart 0 2 4 6 8 10 12 14 16 1 23 4 5 6 7 8 9 10 11 PerformanceCounterValue Time (min) Baseline Load Test New Load Test 23
  • 24.
    Control Chart 0 2 4 6 8 10 12 14 16 1 23 4 5 6 7 8 9 10 11 PerformanceCounterValue Time (min) Baseline Load Test New Load Test 24
  • 25.
    Control Chart 0 2 4 6 8 10 12 14 16 1 23 4 5 6 7 8 9 10 11 PerformanceCounterValue Time (min) Baseline Load Test New Load Test 25
  • 26.
    Control Chart 0 2 4 6 8 10 12 14 16 1 23 4 5 6 7 8 9 10 11 PerformanceCounterValue Time (min) Baseline Load Test New Load Test Control Chars use control limits (CL) to represent the limits of variation that should be expected from a process. 26
  • 27.
    Control Chart 0 2 4 6 8 10 12 14 16 1 23 4 5 6 7 8 9 10 11 PerformanceCounterValue Time (min) Baseline Load Test New Load Test Baseline CL Central Limit (CL): the median of all values of the performance counters in a baseline load test 27
  • 28.
    Control Chart 0 2 4 6 8 10 12 14 16 1 23 4 5 6 7 8 9 10 11 PerformanceCounterValue Time (min) Baseline Load Test New Load Test Baseline LCL, UCL The Upper/Lower Control Limits (U/LCL) is the upper/lower limit of the range of a counter under the normal behavior of the system Baseline CL 28
  • 29.
    Deviation Detection Clustering and Random Sampling PCAApproach Performance Report Comparing PCA Counter Weights Baseline Signature New Test Signature Training Data Evaluation Data WRAPPER Approach 29 Baseline Signature New Test Signature Control Chart Performance Report Performance Report Logistic Regression Baseline Signature New Test Signature
  • 30.
    Case Study How effectiveare our signature-based approaches in detecting performance deviations in load tests? RQ 30
  • 31.
    Case Study How effectiveare our signature-based approaches in detecting performance deviations in load tests? RQ An Ideal approach should predict a minimal and correct set of performance deviations. Evaluation Using: Precision, Recall and F-measure 31
  • 32.
    Subjects of Study System:Open Source Domain: Ecommerce Type of data: 1. Data From Our Experiments with and Open Source Benchmark Application DVD Store 32 System: Industrial System Domain: Telecom Type of data: 1. Load Test Repository 2. Data From Our Experiments on the Company’s Testing Platform
  • 33.
    Fault Injection Category FailureTrigger Faults Software Failure Resource Exhaustion CPU Stress Memory Stress System Overload Abnormal Workload Operator Errors Procedural Errors Interfering Workload Unscheduled Replication 33
  • 34.
  • 35.
    Case Study Findings (Effectiveness) 0 0.1 0.2 0.3 0.4 0.5 0.6 0.7 0.8 0.9 1 WRAPPERPCA Clustering Random Precision Recall F-Measure  Random Sampling has the lowest effectiveness  On Avg. and in all experiments, PCA performs better than Clustering approach.  WRAPPER dominates the best supervised approach i.e., PCA 35
  • 36.
    Case Study Findings (Effectiveness) 0 0.1 0.2 0.3 0.4 0.5 0.6 0.7 0.8 0.9 1 WRAPPERPCA Clustering Random Precision Recall F-Measure 36 Overall, there is an excellent balance of high precision and recall of both the WRAPPER and PCA approaches (on average 0.95, 0.94 and 0.82, 0.84 respectively) for deviation detection
  • 37.
    Real Time AnalysisStability Manual Overhead Case Study Findings (Practical Differences) 37
  • 38.
    Real Time Analysis WRAPPER---deviations on a per-observation basis. PCA --- requires a certain amount of observations (wait time). 38
  • 39.
    Stability  We referto ‘Stability’ as the ability of an approach to remain effective while its signature size is reduced. 39
  • 40.
    0.6 0.65 0.7 0.75 0.8 0.85 0.9 0.95 1 45 40 3530 25 20 15 10 5 4 3 2 1 F-Measure Signature Size Unsupervised (PCA) Supervised(Wrapper) Stability 40
  • 41.
    0.6 0.65 0.7 0.75 0.8 0.85 0.9 0.95 1 45 40 3530 25 20 15 10 5 4 3 2 1 F-Measure Signature Size Unsupervised (PCA) Supervised(Wrapper) Stability 41
  • 42.
    0.6 0.65 0.7 0.75 0.8 0.85 0.9 0.95 1 45 40 3530 25 20 15 10 5 4 3 2 1 F-Measure Signature Size Unsupervised (PCA) Supervised(Wrapper) Stability 0.6 0.65 0.7 0.75 0.8 0.85 0.9 0.95 1 1.05 60 50 40 30 20 10 4 2 F-Measure Signature Size Unsupervised (PCA) Supervised(Wrapper) 42
  • 43.
    0.6 0.65 0.7 0.75 0.8 0.85 0.9 0.95 1 45 40 3530 25 20 15 10 5 4 3 2 1 F-Measure Signature Size Unsupervised (PCA) Supervised(Wrapper) Stability 0.6 0.65 0.7 0.75 0.8 0.85 0.9 0.95 1 1.05 60 50 40 30 20 10 4 2 F-Measure Signature Size Unsupervised (PCA) Supervised(Wrapper) WRAPPER approach is more stable that PCA approach 43
  • 44.
    Manual Overhead WRAPPER approachrequires all observations of the baseline performance counter data to be labeled as Pass/Fail 44
  • 45.
    Manual Overhead Marking eachobservation is time consuming 45
  • 46.
    Limitations of OurApproaches Hardware Difference Sensitivity 46
  • 47.
    Hardware Differences Large systemshave many testing labs to run multiple load tests simultaneously.  Labs may have different hardware. Our approaches may interpret same test on different labs as deviated tests Recent work by K.C.Foo et al. propose several techniques to over come this problem Mining Performance Regression Testing Repositories for Automated Performance Analysis ( QSIC 2010) 47
  • 48.
    Sensitivity We can tunethe sensitivity of our approaches.  PCA – Analyst tunes the ‘weight’ parameter.  WRAPPER – Analyst decides, in the labelling phase, how big the deviation should be in order to be flagged. Lowering sensitivity reduces false alarms, it may overlook some important outliers 48
  • 49.

Editor's Notes

  • #3 Today's LSS such as Google, eBay , Facebook and Amazon are composed of many underlying components and subsystems. These LSS are tremendously growing in size to handle growing traffic, complex services and business critical functionality. It is very important to periodically measure the performance of such LLS to satisfy the stakeholders and customers high demands on system quality, availability and responsiveness.
  • #4  -Load testing is an important weapon in LSS development to uncover functional and performance problems of a system under load Performance of the LSS is calibrated using Load test before it becomes a field or post-deployment problem. -Performance problems include an application not responding fast enough, crashing or hanging under heavy load or not meeting the desired service level agreements (SLA).
  • #5 Environment-Setup: First but the most important phase of the load testing. As the most common load test failures occurs due to improper environment setup for load tests. The environment setup includes installing the applications and load testing tools on different machines and possibly on different operating systems Load generators, which emulates the users interaction with the systems, need to carefully configured to match the real workload in field. Load Test Execution: It involves starting the components of the system under test, i.e., starting required services, hardware resources and tools ( load generators and performance monitors). Performance counter are recorded in this step too. Load Test Analysis: This step involves comparing the results of a load test against an other load tests results or against predefined thresh holds as baselines. Unlike functional and unit testing, which results in pass of failure classification for each test; load testing requires additional quantitative metrics like response time, throughput and hardware resources utilization to summarize results. The performance analysts selects few of the important performance counters among thousands collected. Based on his experience and domain knowledge performance analyst manually compare the selected performance counters with those of past runs to look for evidence of performance deviations, for example using plots and performing correlations tests. Report Generation: Includes filing the performance deviations, if found, based on the personal judgment of an analysts. Mostly the results produced are verified by an experience analysts. Based on the extent of performance deviation and its relevance to team responsible for handling the subsystems i.e., (database, application, web system etc.)
  • #11 Unfortunately, the current practice to analyze load test is costly, time consuming and error prone. This is due to the fact that the load test analysis practices have not kept pace with the rapid growth in size and complexity of the large enterprise systems. In practice, the dominant tools and techniques to analyze large distributed systems have remained unchanged for over twenty years Most of the research had focus on the automatic generation of load testing suits rather then load test analysis - There are many challenges and limitation associated with the current practices of load test analysis that remains unsolved
  • #16 Due to these challenges, we believe the current practice to perform load test analysis is neither effective nor sufficient to uncover performance deviations accurately and in limited time. -
  • #45 Such Labelling is required for the training of this supervised approach In practice however, this is an overhead for analyst that rarely have time to manually mark each observation of the performance counter data. Tool support is needed to help analyst paratially automate the labeling, whereas, the PCA approach does not require any such human intervention.
  • #46 Such Labelling is required for the training of this supervised approach In practice however, this is an overhead for analyst that rarely have time to manually mark each observation of the performance counter data. Tool support is needed to help analyst paratially automate the labeling, whereas, the PCA approach does not require any such human intervention.