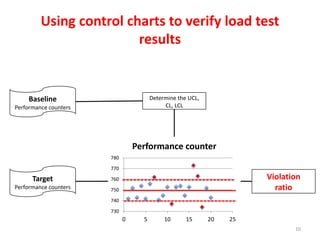
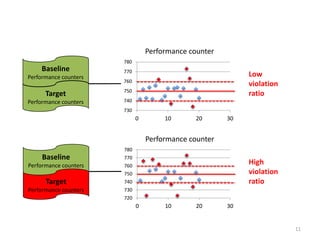
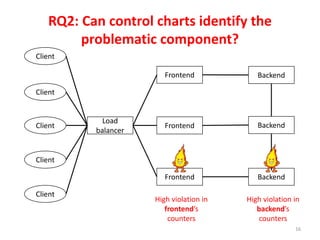
Automatic Load Test Verification
Using Control Charts
Thanh Nguyen, Bram Adams, ZhenMing Jiang, Ahmed E. Hassan
Queen’s University, Kingston, Canada
Mohamed Nasser, Parminder Flora
Research in Motion, Waterloo, Canada
1
2
Load testing: Ensure the software
performance
With 2000 concurrent users, a GET request
should be responded within 2 seconds
3
Development
Functional
Testing
Load
Testing
Importance of software performance:
More users
4
Load testing is regression based
5
Apply operational
load e.g. 2000
requests/min
Existing version
e.g. version 1.2
New release
e.g. version 1.3
Baseline
Performance counters
Target
Performance counters
Compare the counters
to detect
performance
regression
Code changes
Automated
e.g. HP LoadRunner,
MS Visual Studio, …
Still a manual
process
Challenge in load testing: Lots of data
6
There are thousands of counters with millions
of samples
Frontend BackendClient
Client
Client
Frontend
Client
Frontend
Client
Backend
Backend
Load
balancer
CPU%
User CPU%
Privileged CPU%
IO data bytes/sec
IO read bytes/sec
IO write bytes/sec
Page faults/sec
Pool paged bytes
Private bytes
Virtual bytes
Manufacturing process also requires
automatic verification
7
Control charts example
8
730
735
740
745
750
755
760
765
770
775
0 5 10 15 20 25
Milk Filled (ml)
CL
LCL
UCL
Violation ratio: 0% 20% 20% 60%
Using control charts to verify load test
results
9
Baseline
Performance counters
Target
Performance counters
Determine the UCL,
CL, LCL
730
740
750
760
770
780
0 5 10 15 20 25
Performance counter
Using control charts to verify load test
results
10
Baseline
Performance counters
Target
Performance counters
Determine the UCL,
CL, LCL
730
740
750
760
770
780
0 5 10 15 20 25
Performance counter
Violation
ratio
11
Baseline
Performance counters
Target
Performance counters
Target
Performance counters
730
740
750
760
770
780
0 10 20 30
Performance counter
Baseline
Performance counters
720
730
740
750
760
770
780
0 10 20 30
Performance counter
Low
violation
ratio
High
violation
ratio
We conduct two case studies
• Enterprise system:
– Large and complex
– Multi-tiers
• Dell DVD store
– Small and simple
– 3-tiers
12
13
Type Description
Front end
problems
CPU hog a) 50% and b) 75% of CPU on
the front end server
Back end
problems
CPU hog a) 50% and b) 75% of CPU on
one of the back end servers
Busy waiting Busy waiting in the front end server
code
Query Extra query to the database back end
Normal
Performance counters
Problems
Performance counters
Type Description
Normal Runs of existing version without
performance problems
RQ1: Can control charts detect a
problematic run?
14
Enterprise’s Response Time
0
10
20
30
40
50
60
70
80
90
100
Normal Front 50% Front 75% Back 50% Back 75%
Violation ratio
15
DVD Store’s Response Time
0
10
20
30
40
50
60
70
80
90
100
Normal Front 50% Front 75% Back 50% Back 75% Busy Query
Violation Ratio
RQ2: Can control charts identify the
problematic component?
16
Frontend BackendClient
Client
Client
Frontend
Client
Frontend
Client
Backend
Backend
Load
balancer
High violation in
frontend’s
counters
High violation in
backend’s
counters
Backend 50% stress
17
0%
10%
20%
30%
40%
50%
60%
70%
80%
90%
100%
F B B B B F O B F O
Violation ratioBaseline
Target
Filter out unstable counters
18
Baseline
Target
0%
10%
20%
30%
40%
50%
60%
70%
80%
90%
100%
F F F F B B B B B B
Violation ratio
These counters are always out-of-control  We filter then
out
Backend 50% stress
19
0%
10%
20%
30%
40%
50%
60%
70%
80%
90%
100%
B B B B B O
Violation ratioBaseline
Target
Frontend 50% stress
20
0%
10%
20%
30%
40%
50%
60%
70%
80%
90%
100%
F F F F F F O
Violation ratioBaseline
Target
21

Automatic Load Test Verification Using Control Charts

Editor's Notes

  • #3 More user User requirement also change
  • #4 More user User requirement also change
  • #5 More user User requirement also change
  • #9 -Limits -Violation ratio