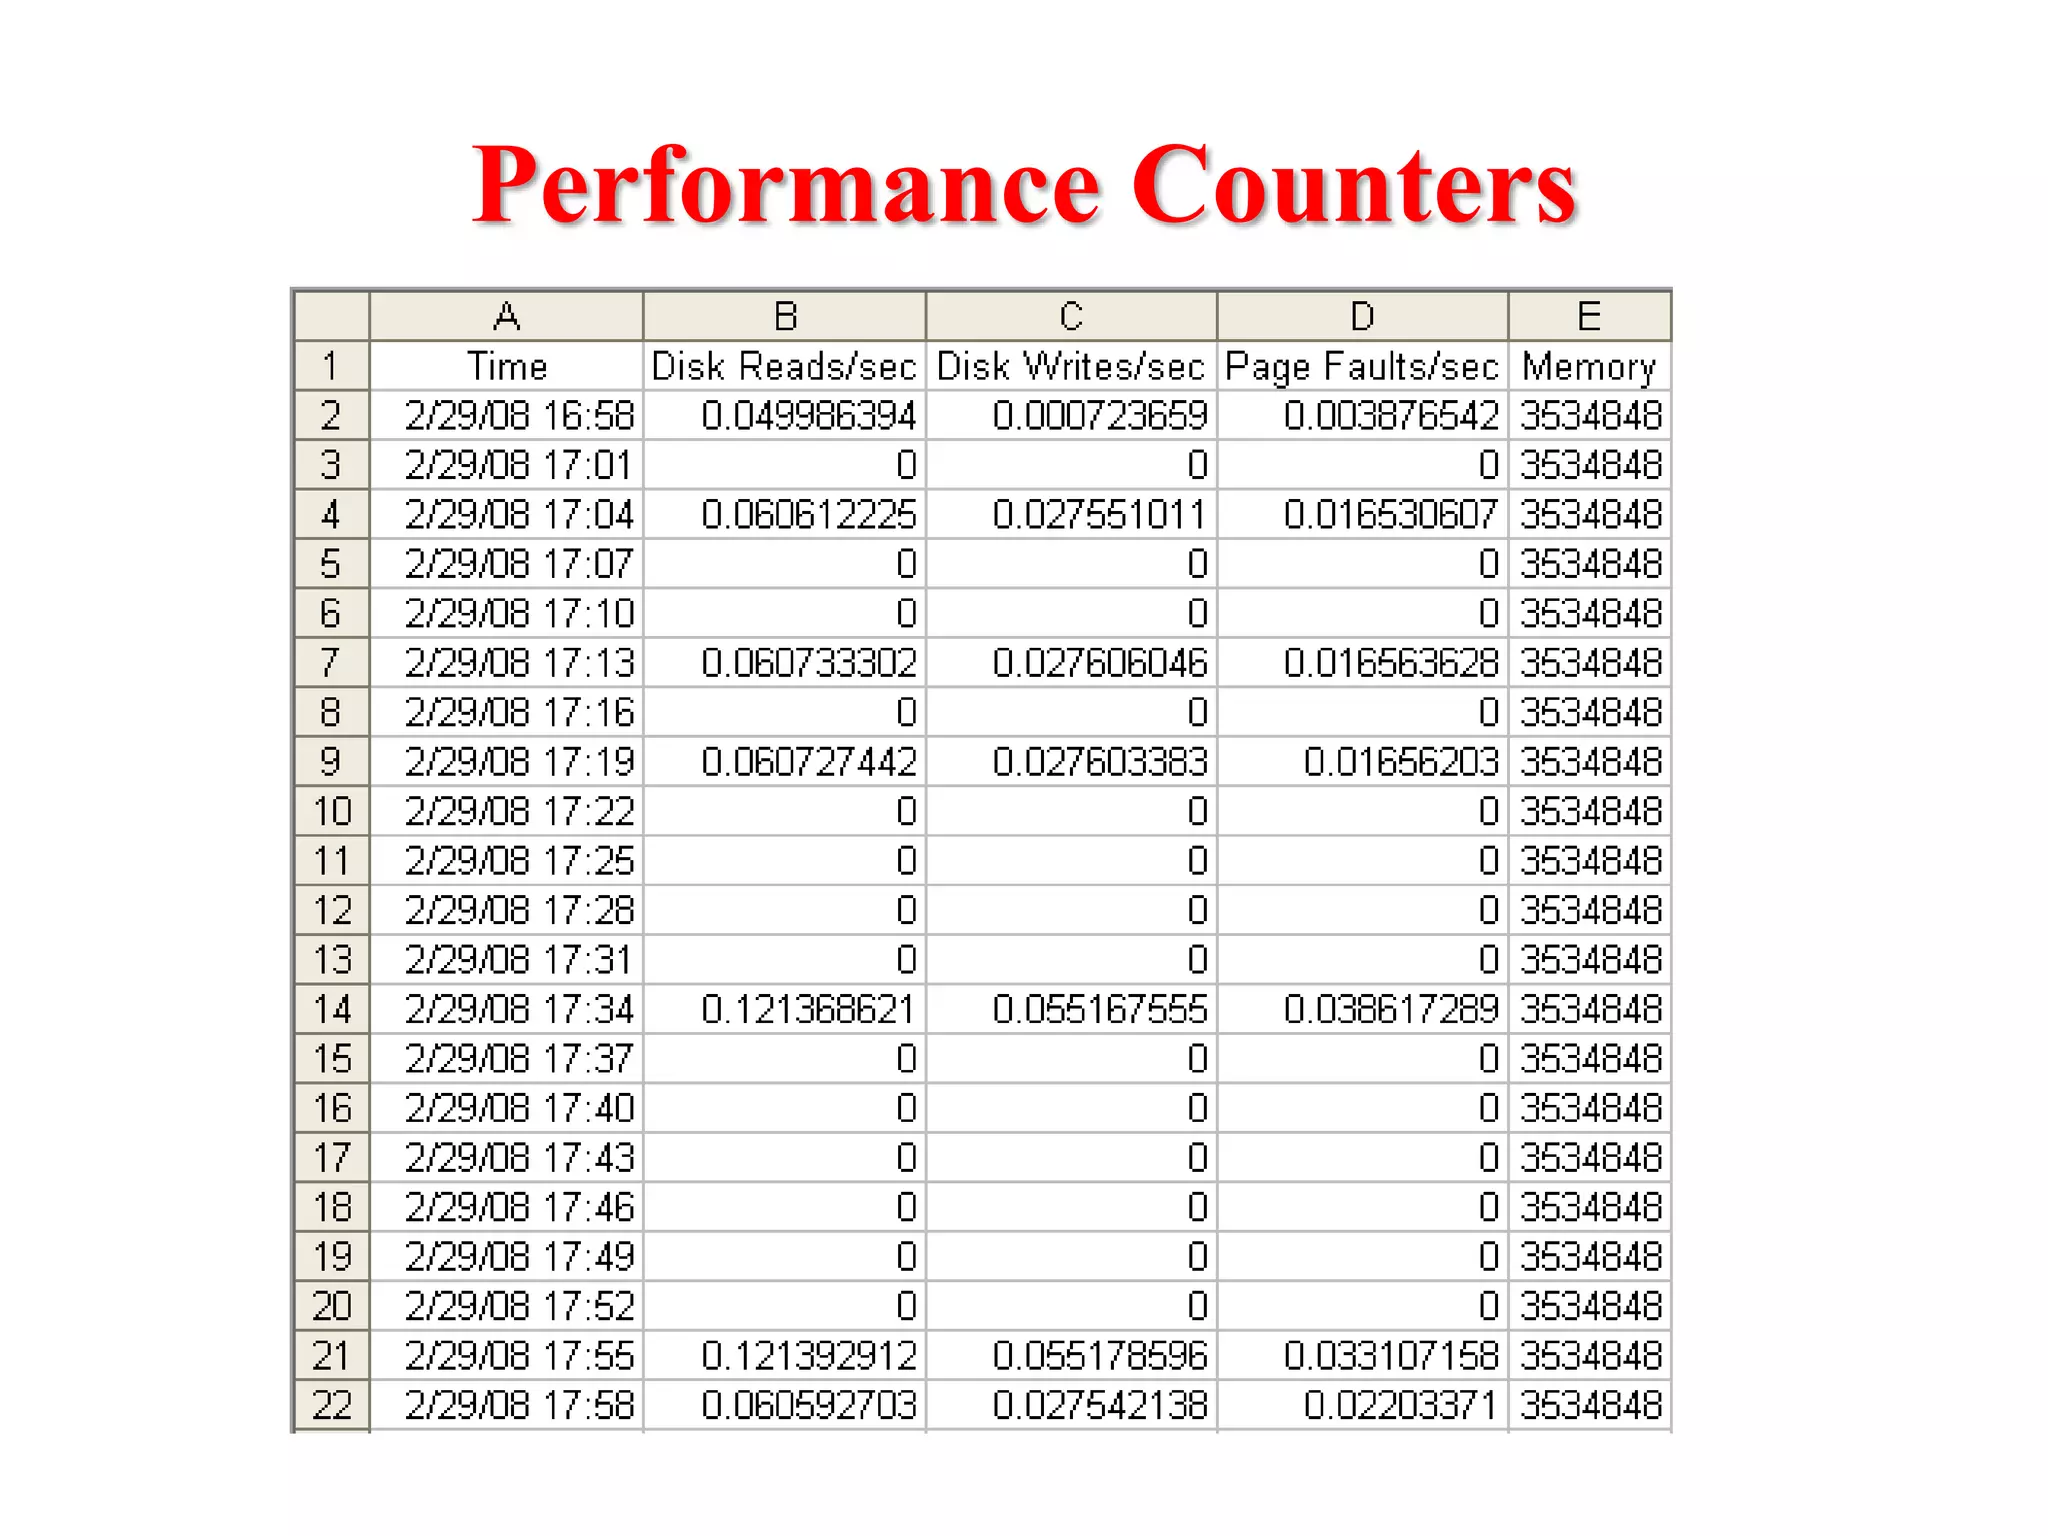
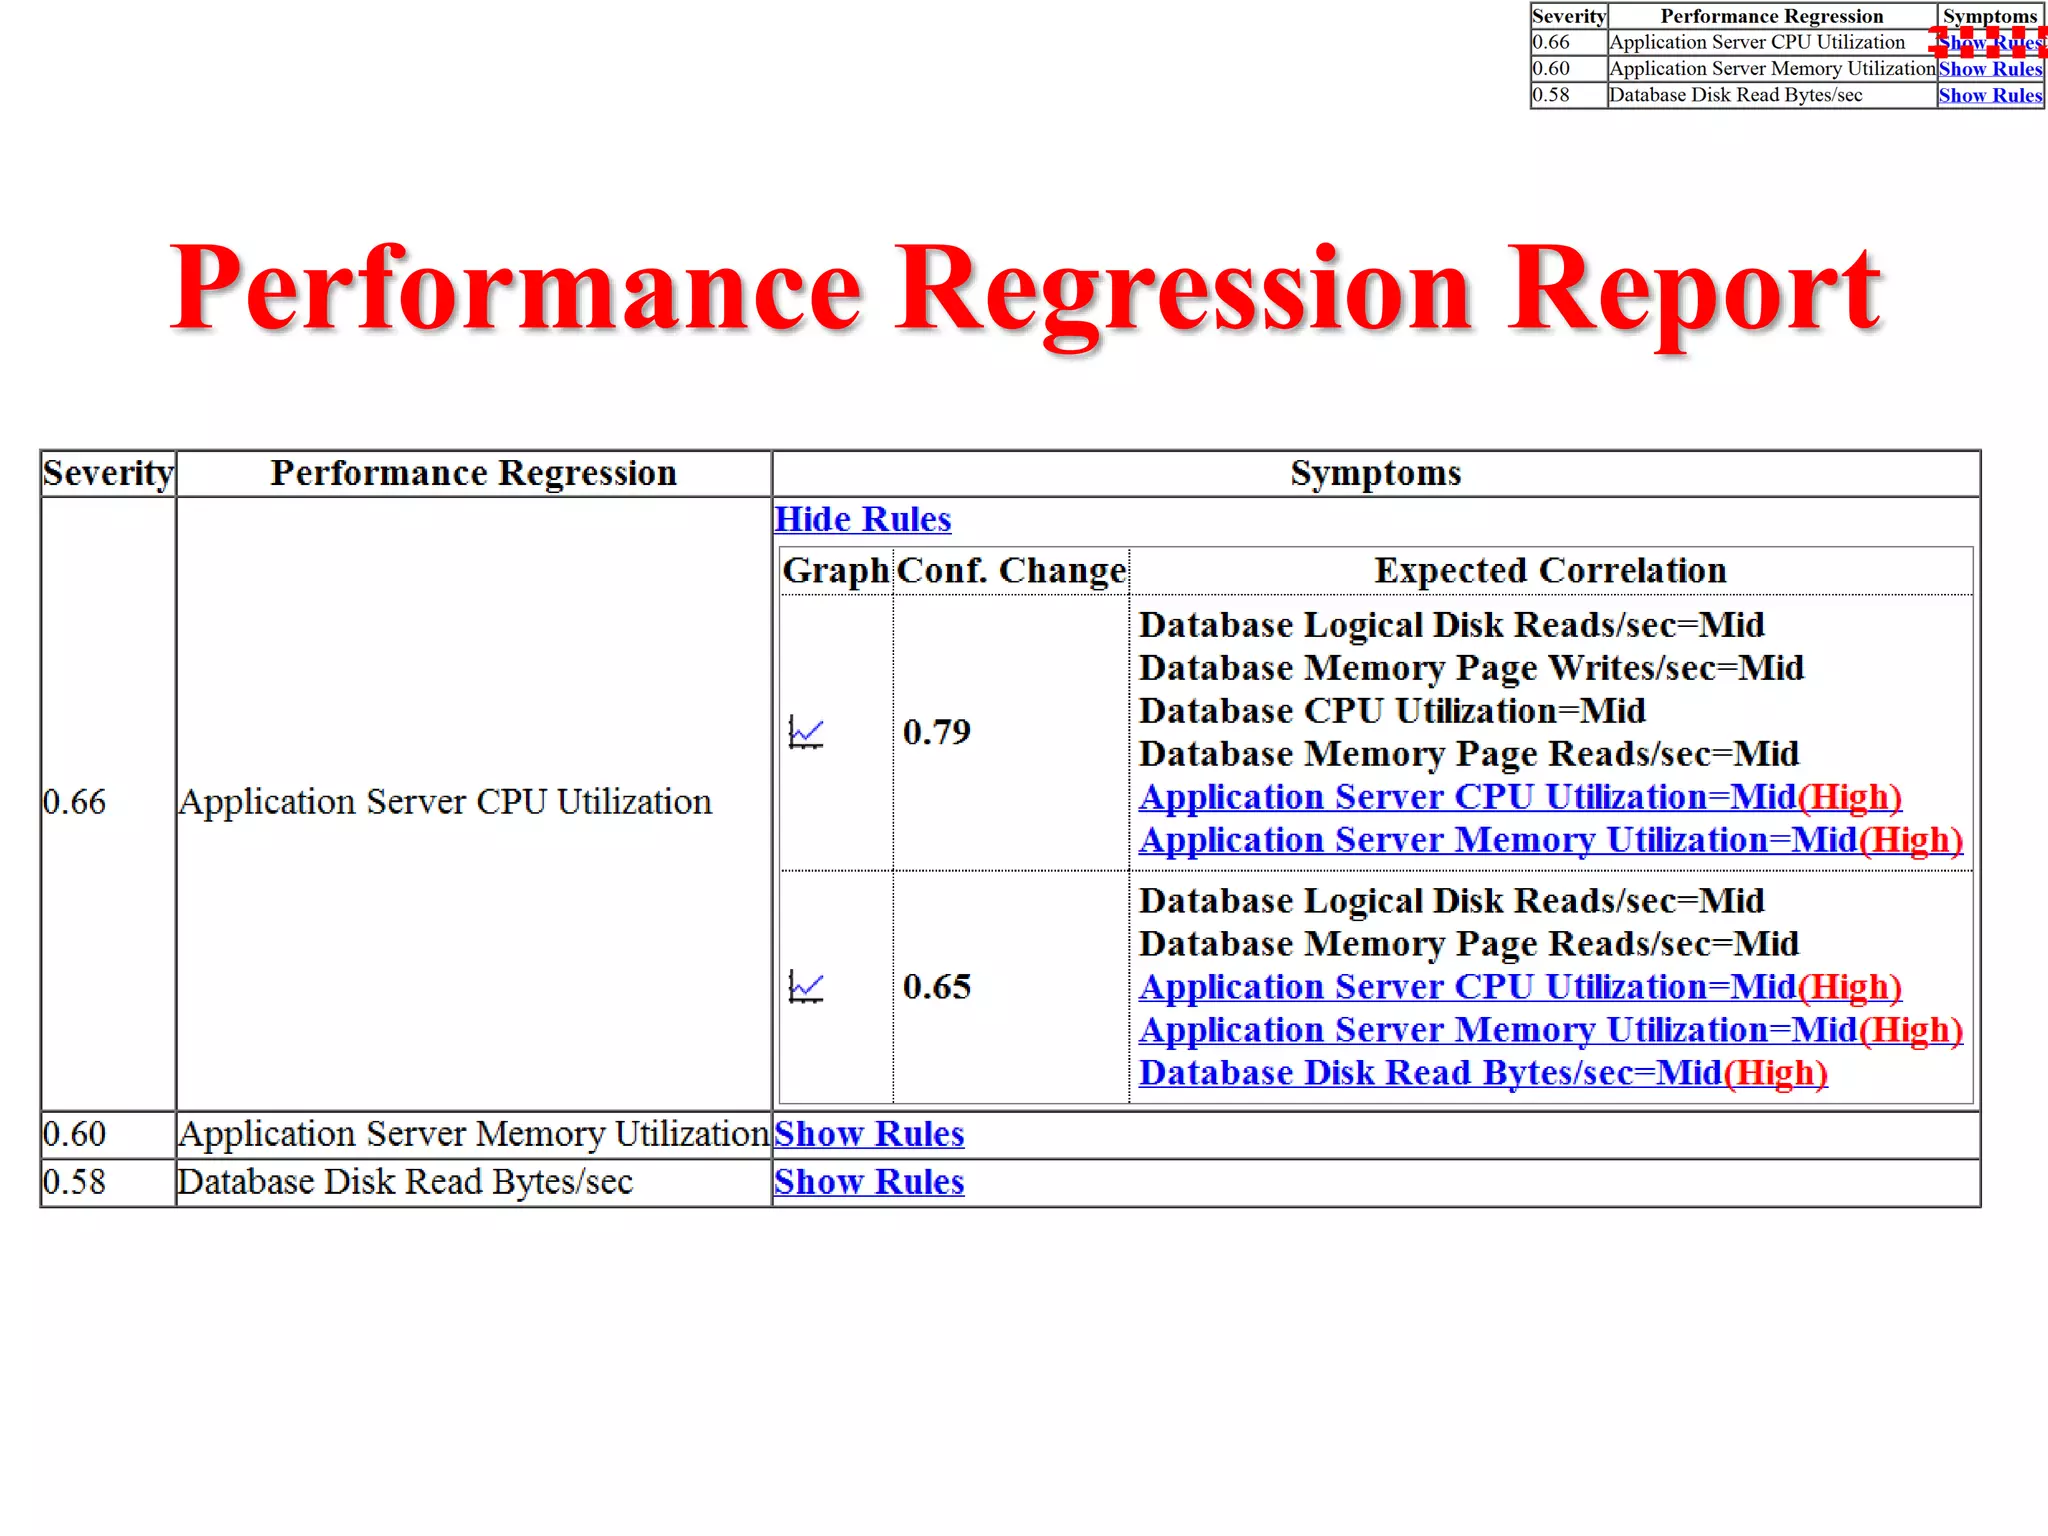
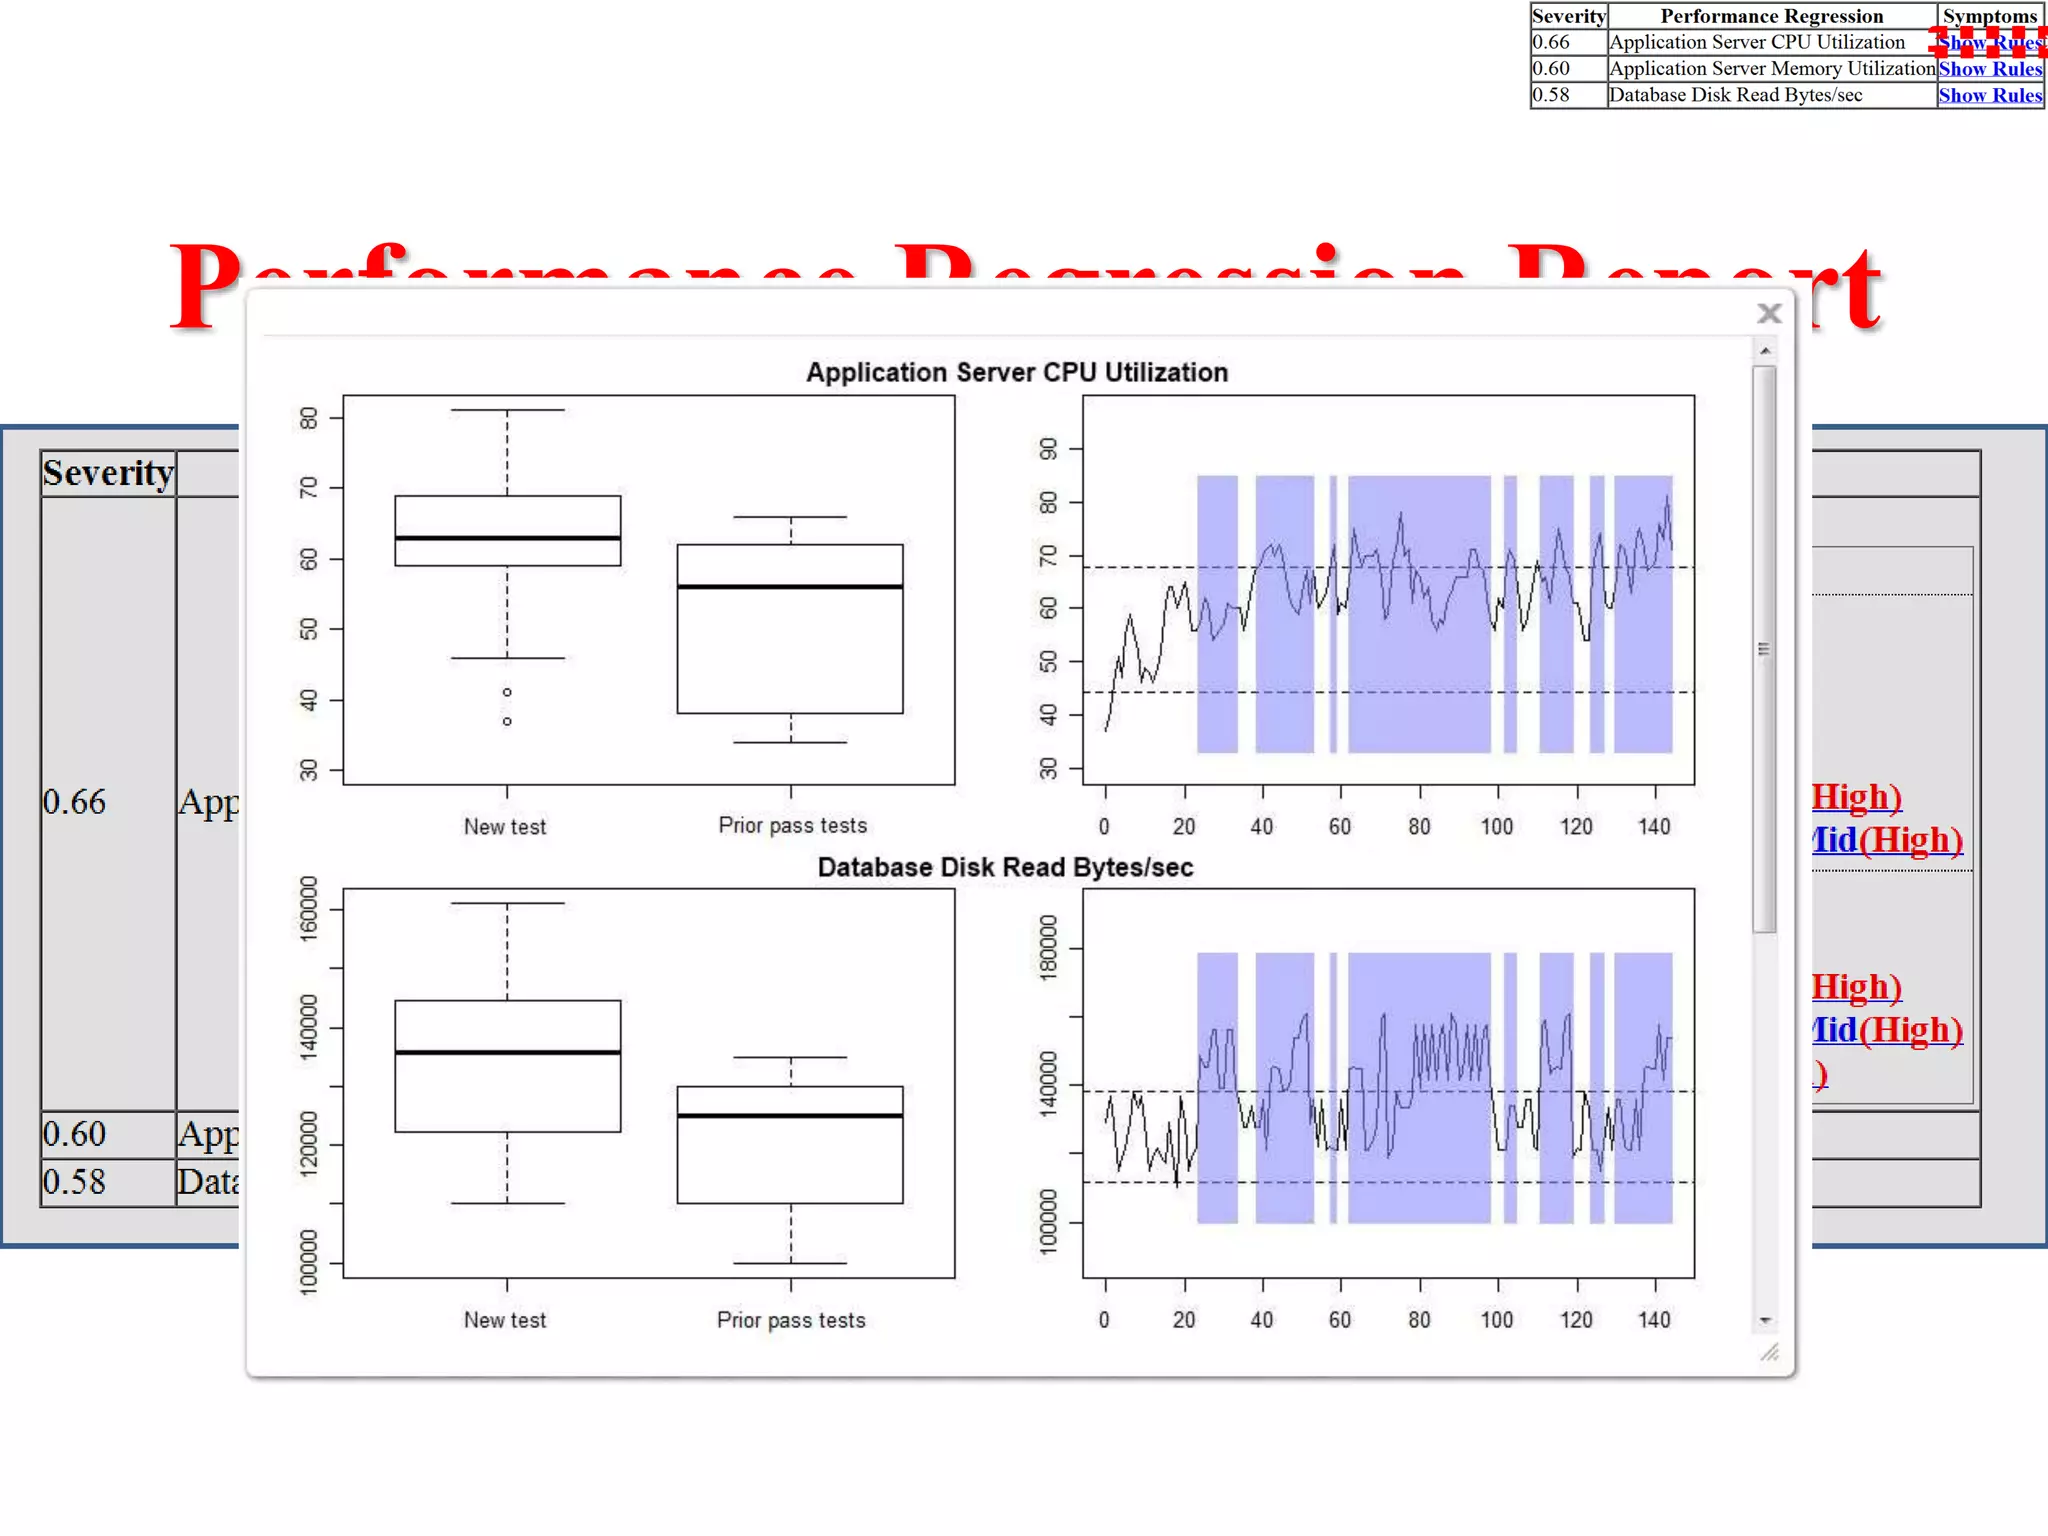
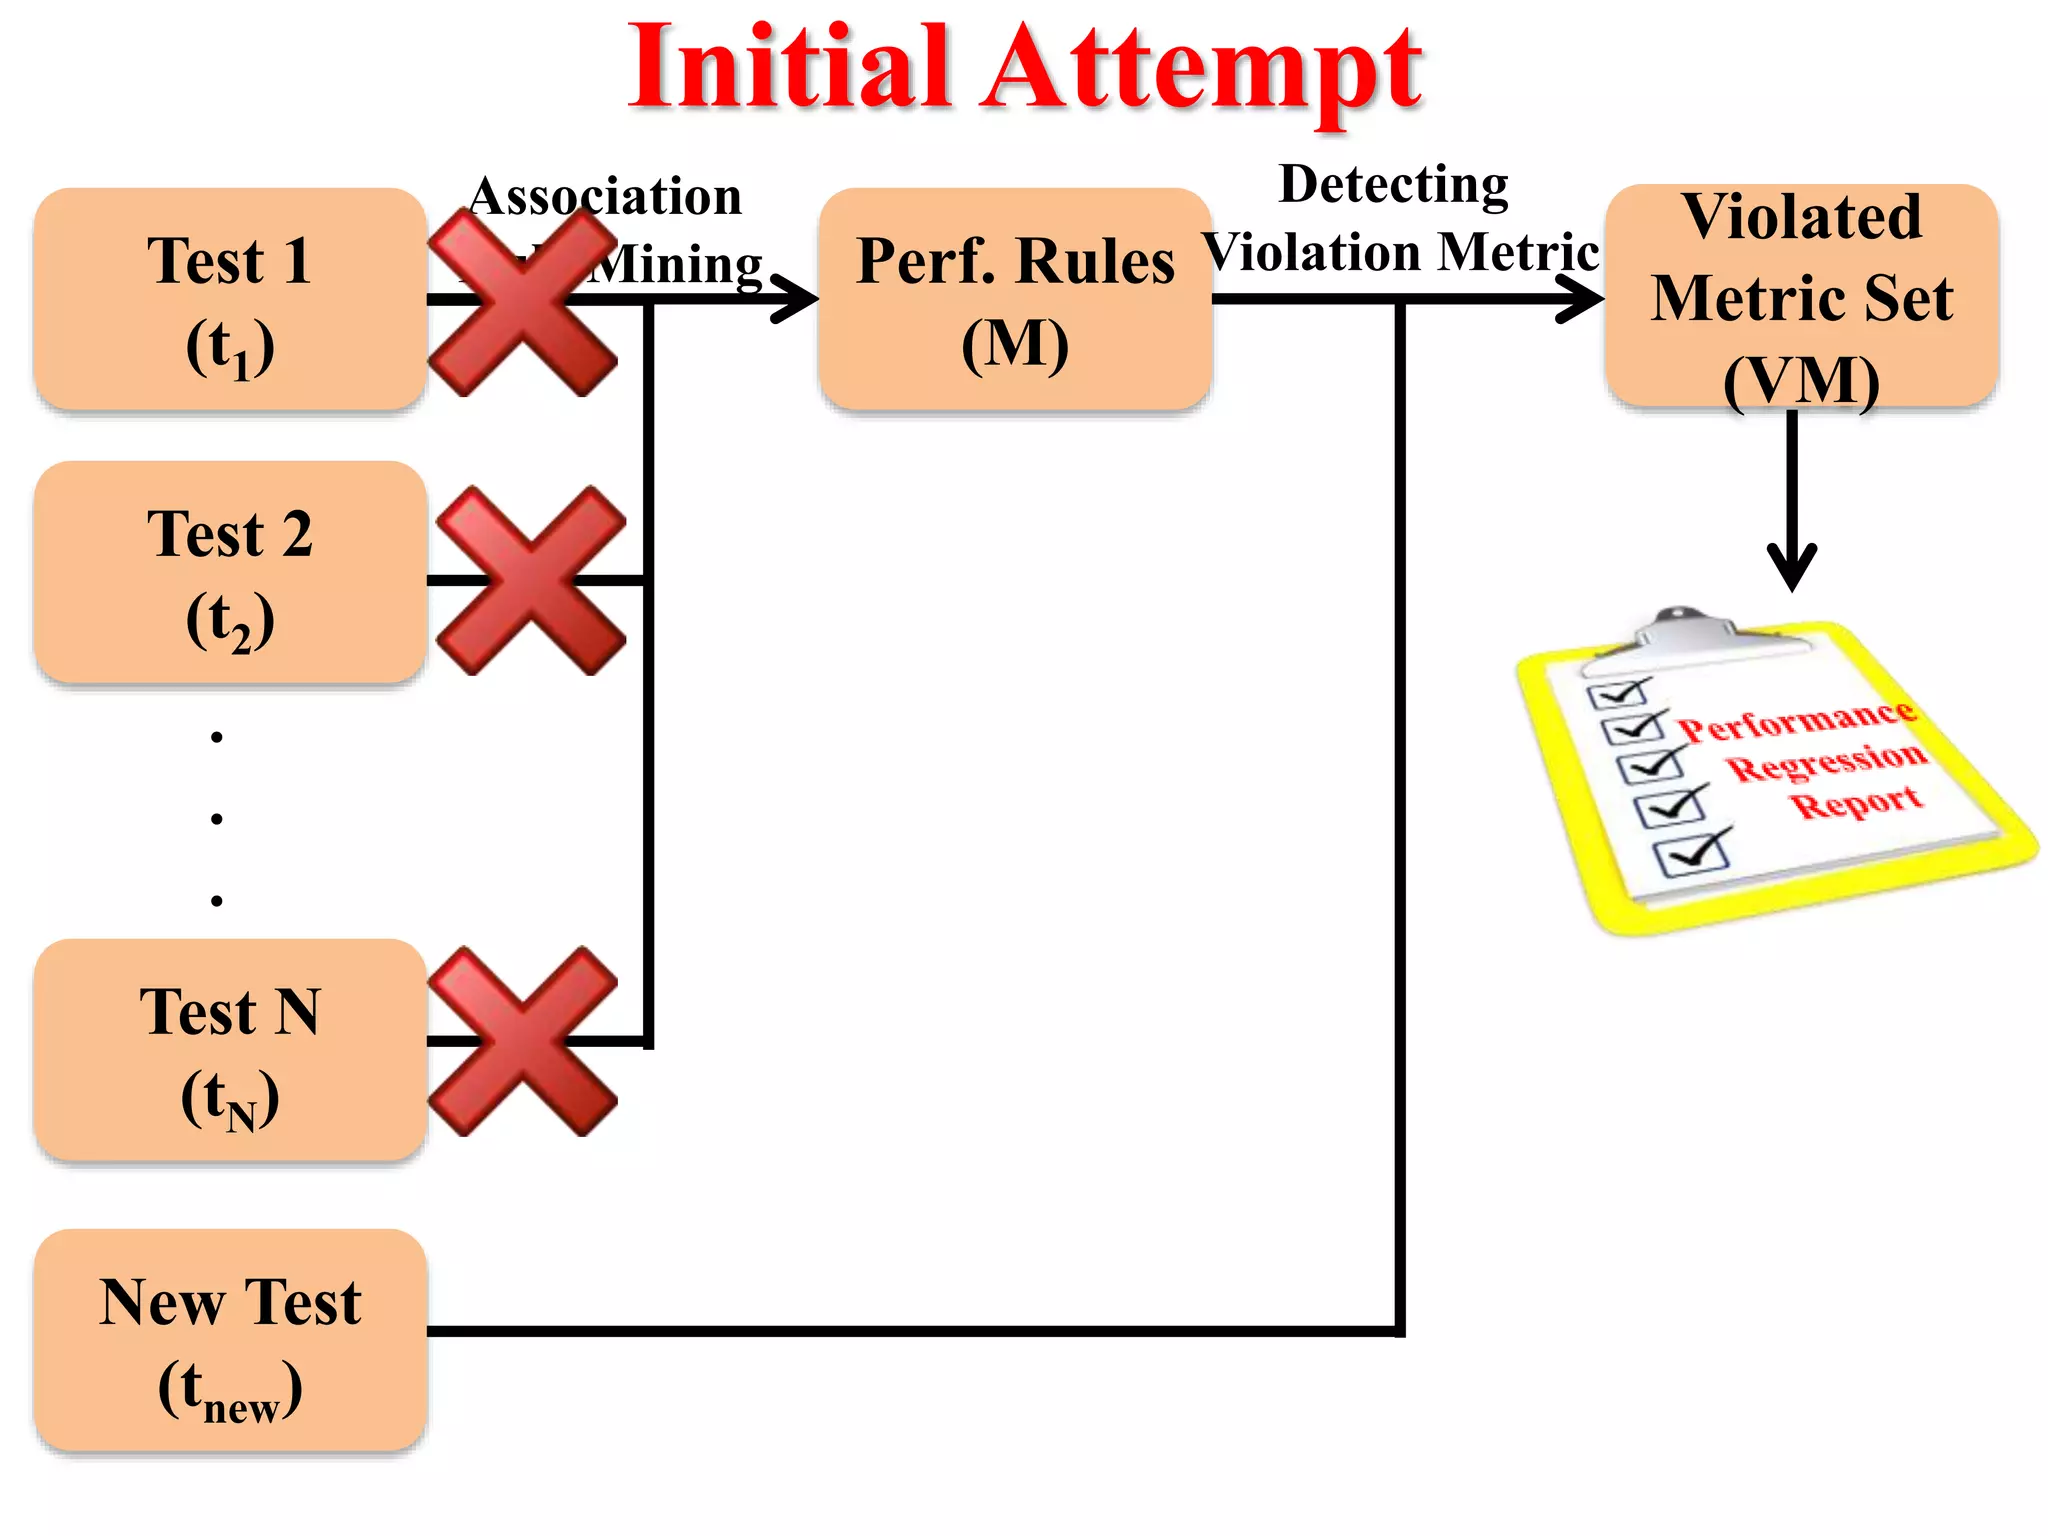
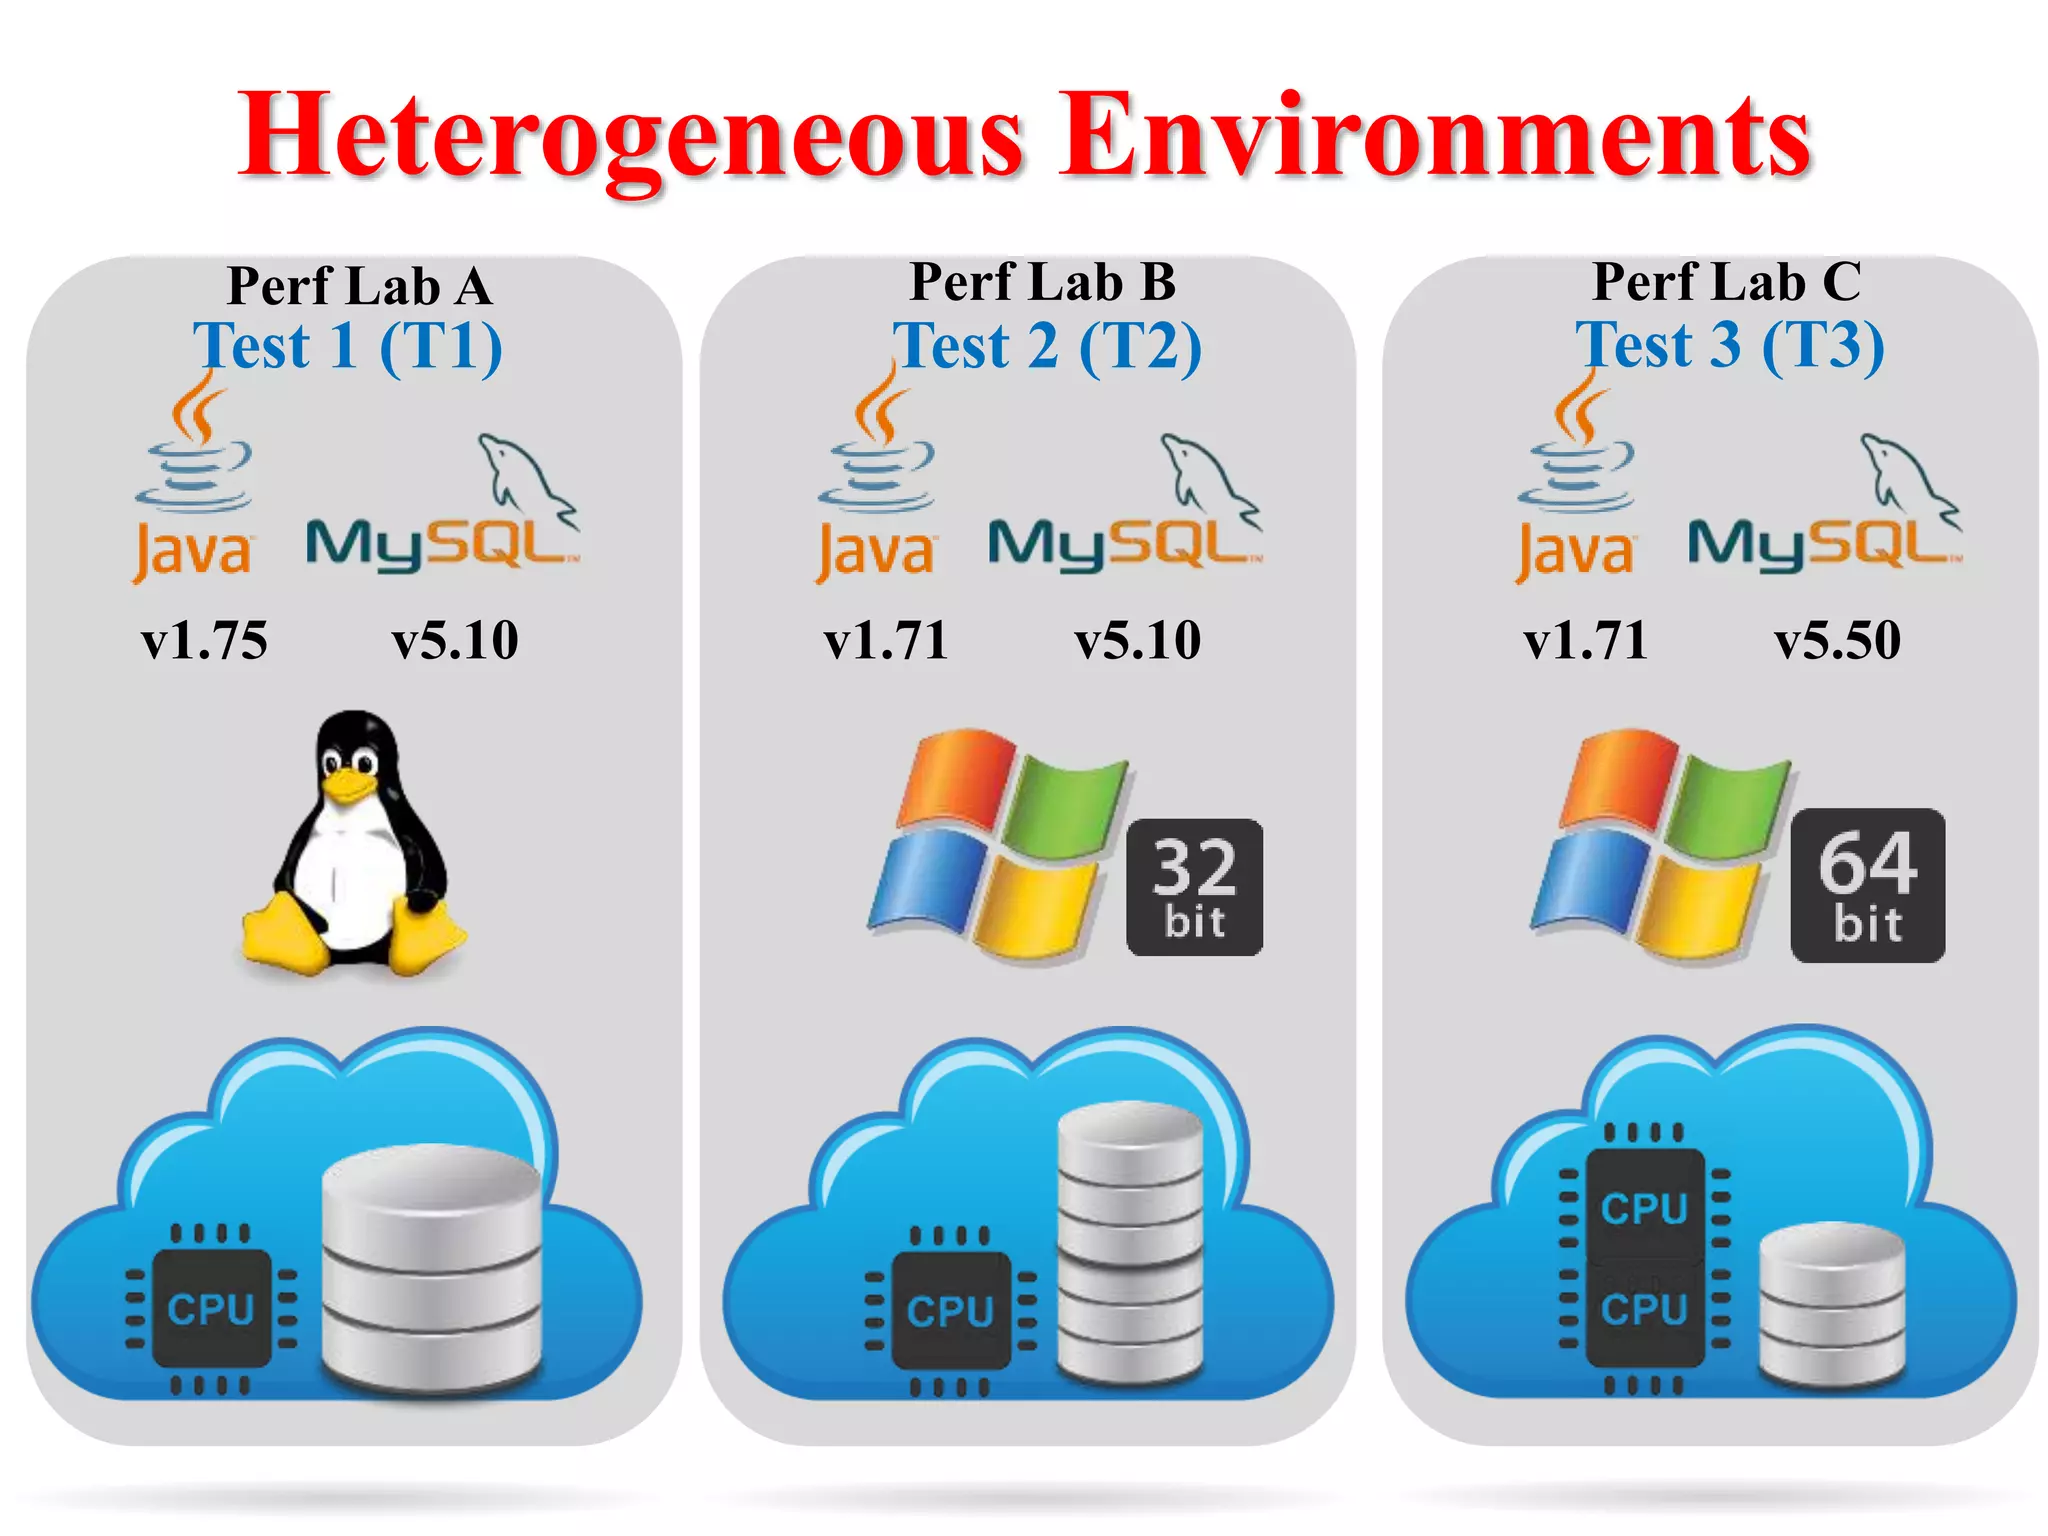
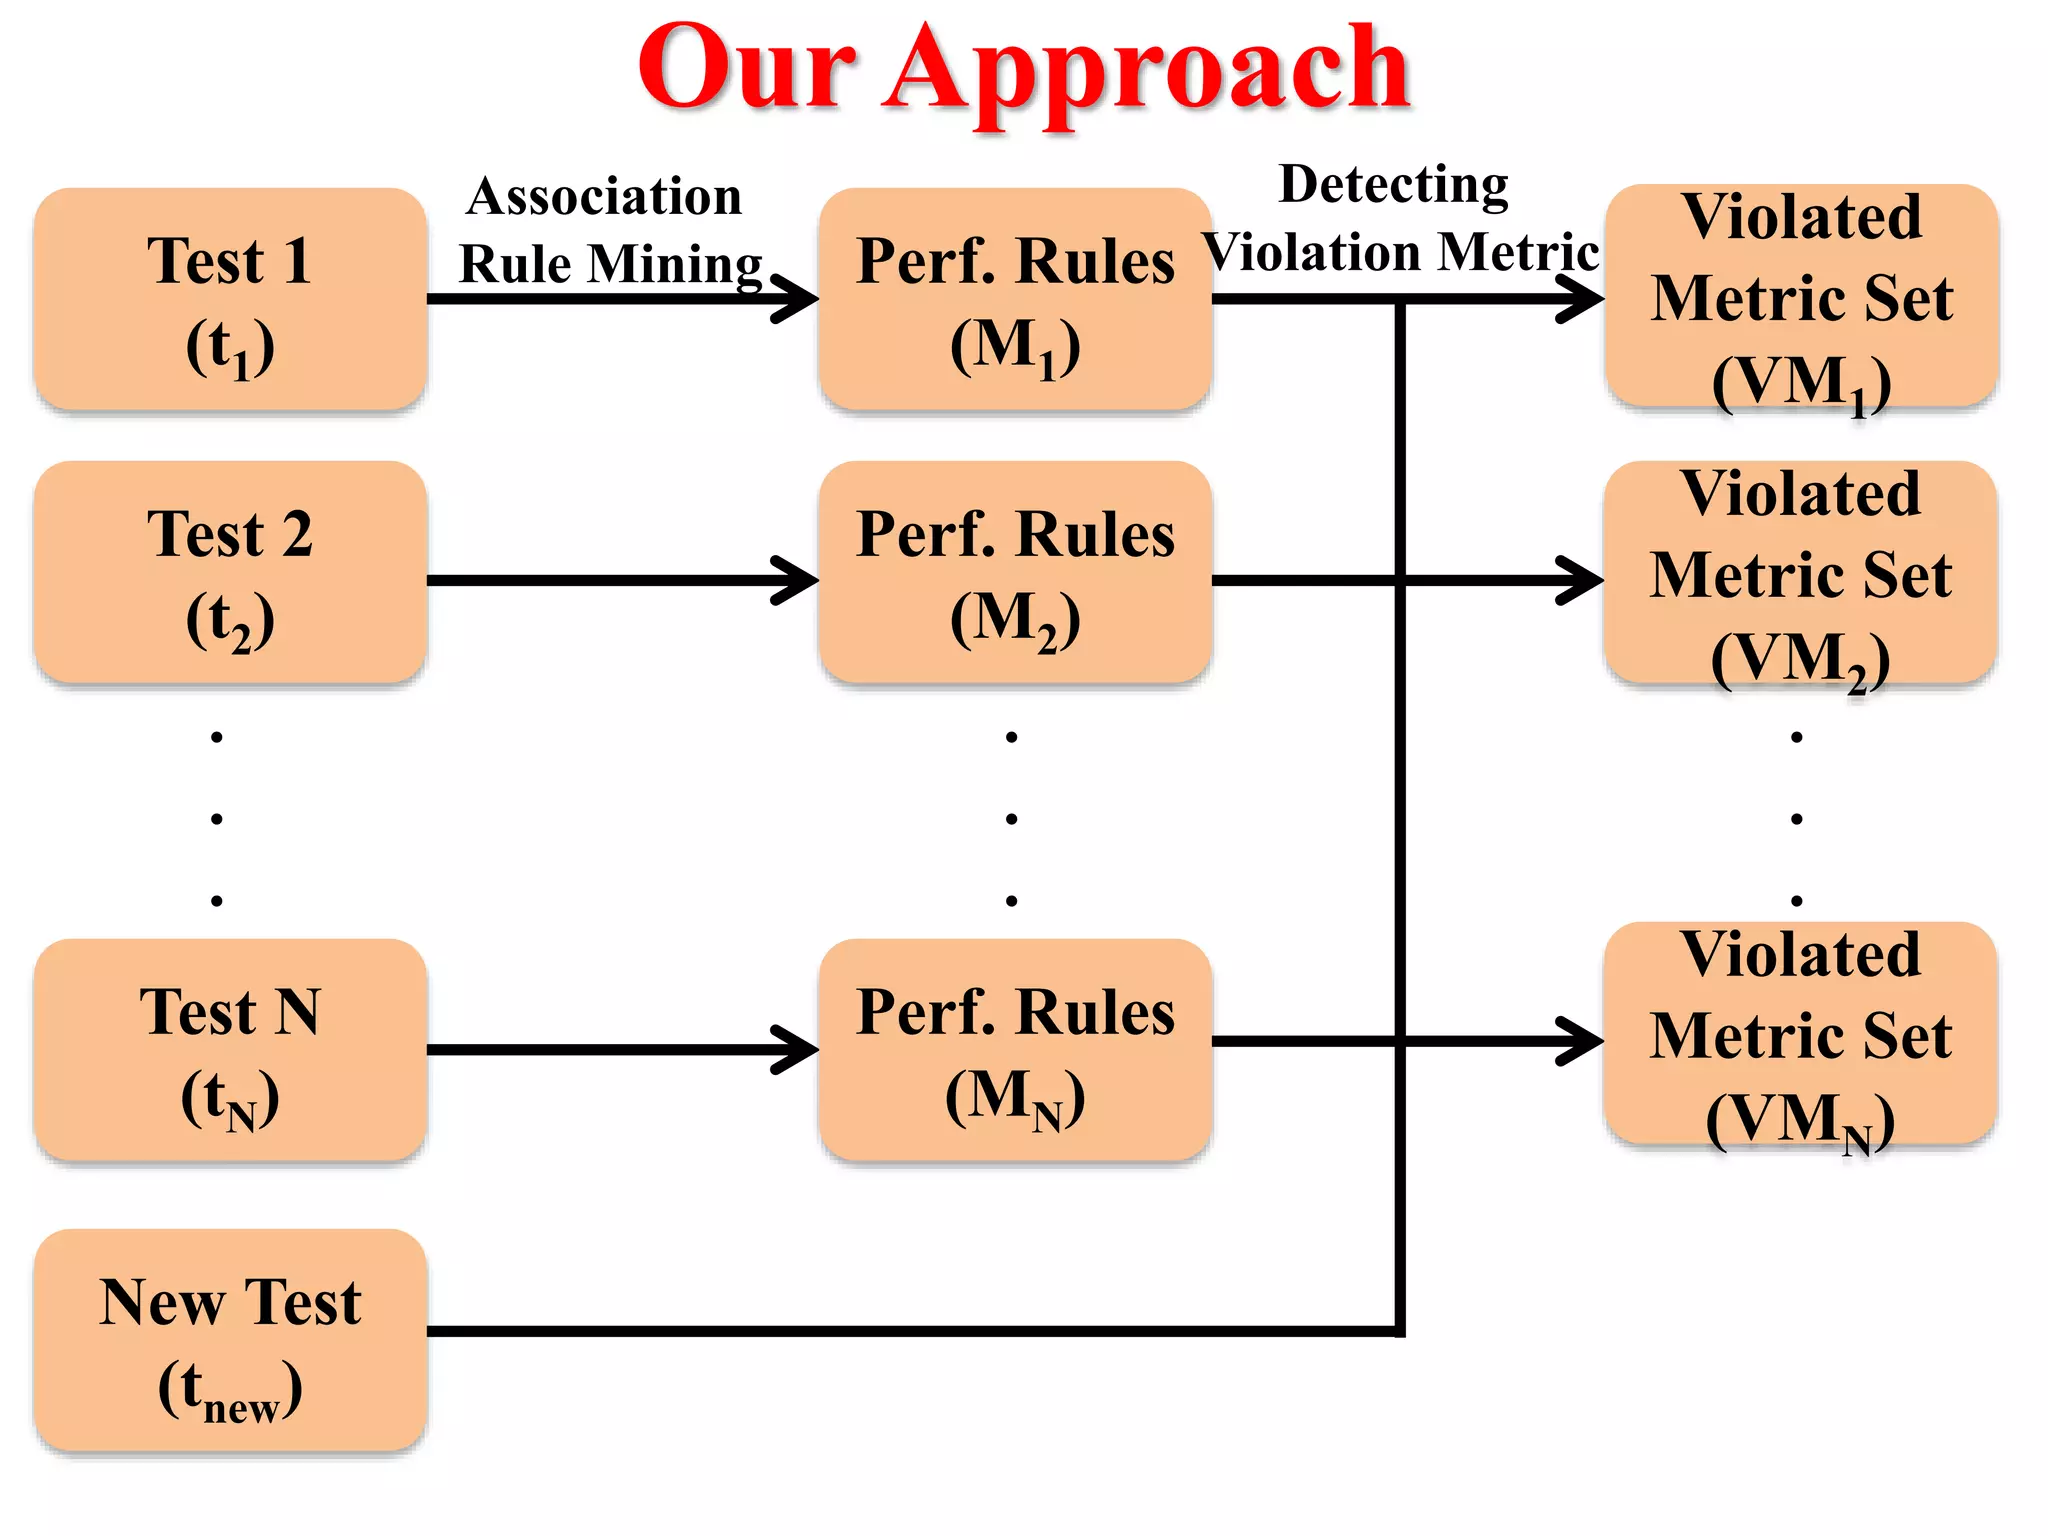
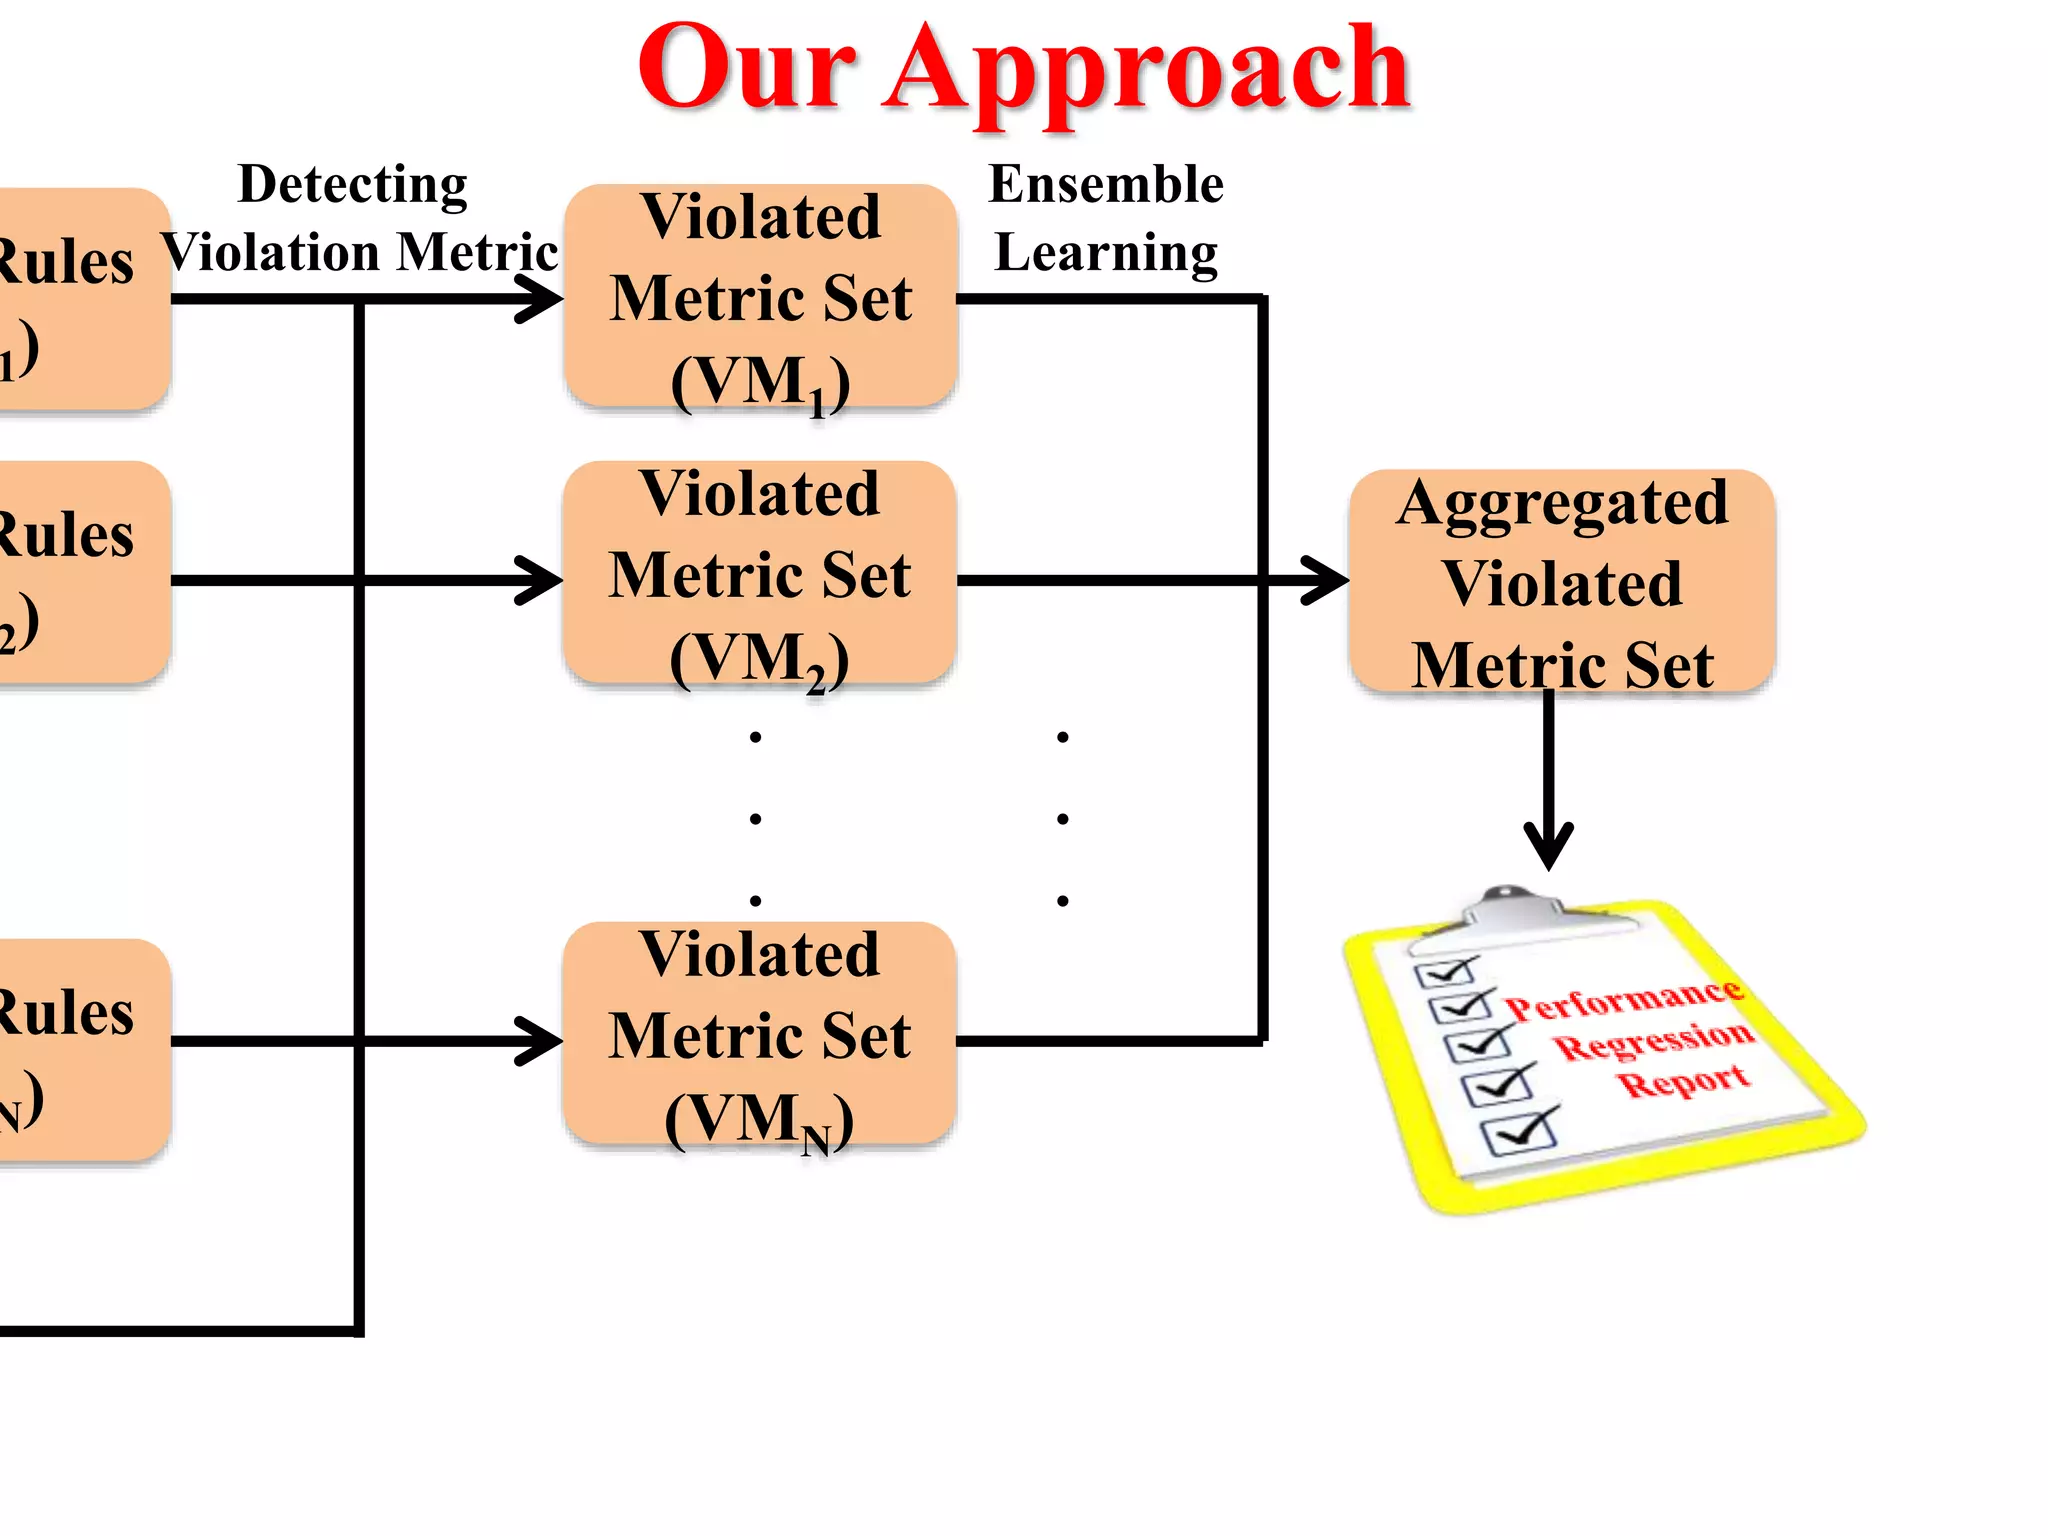
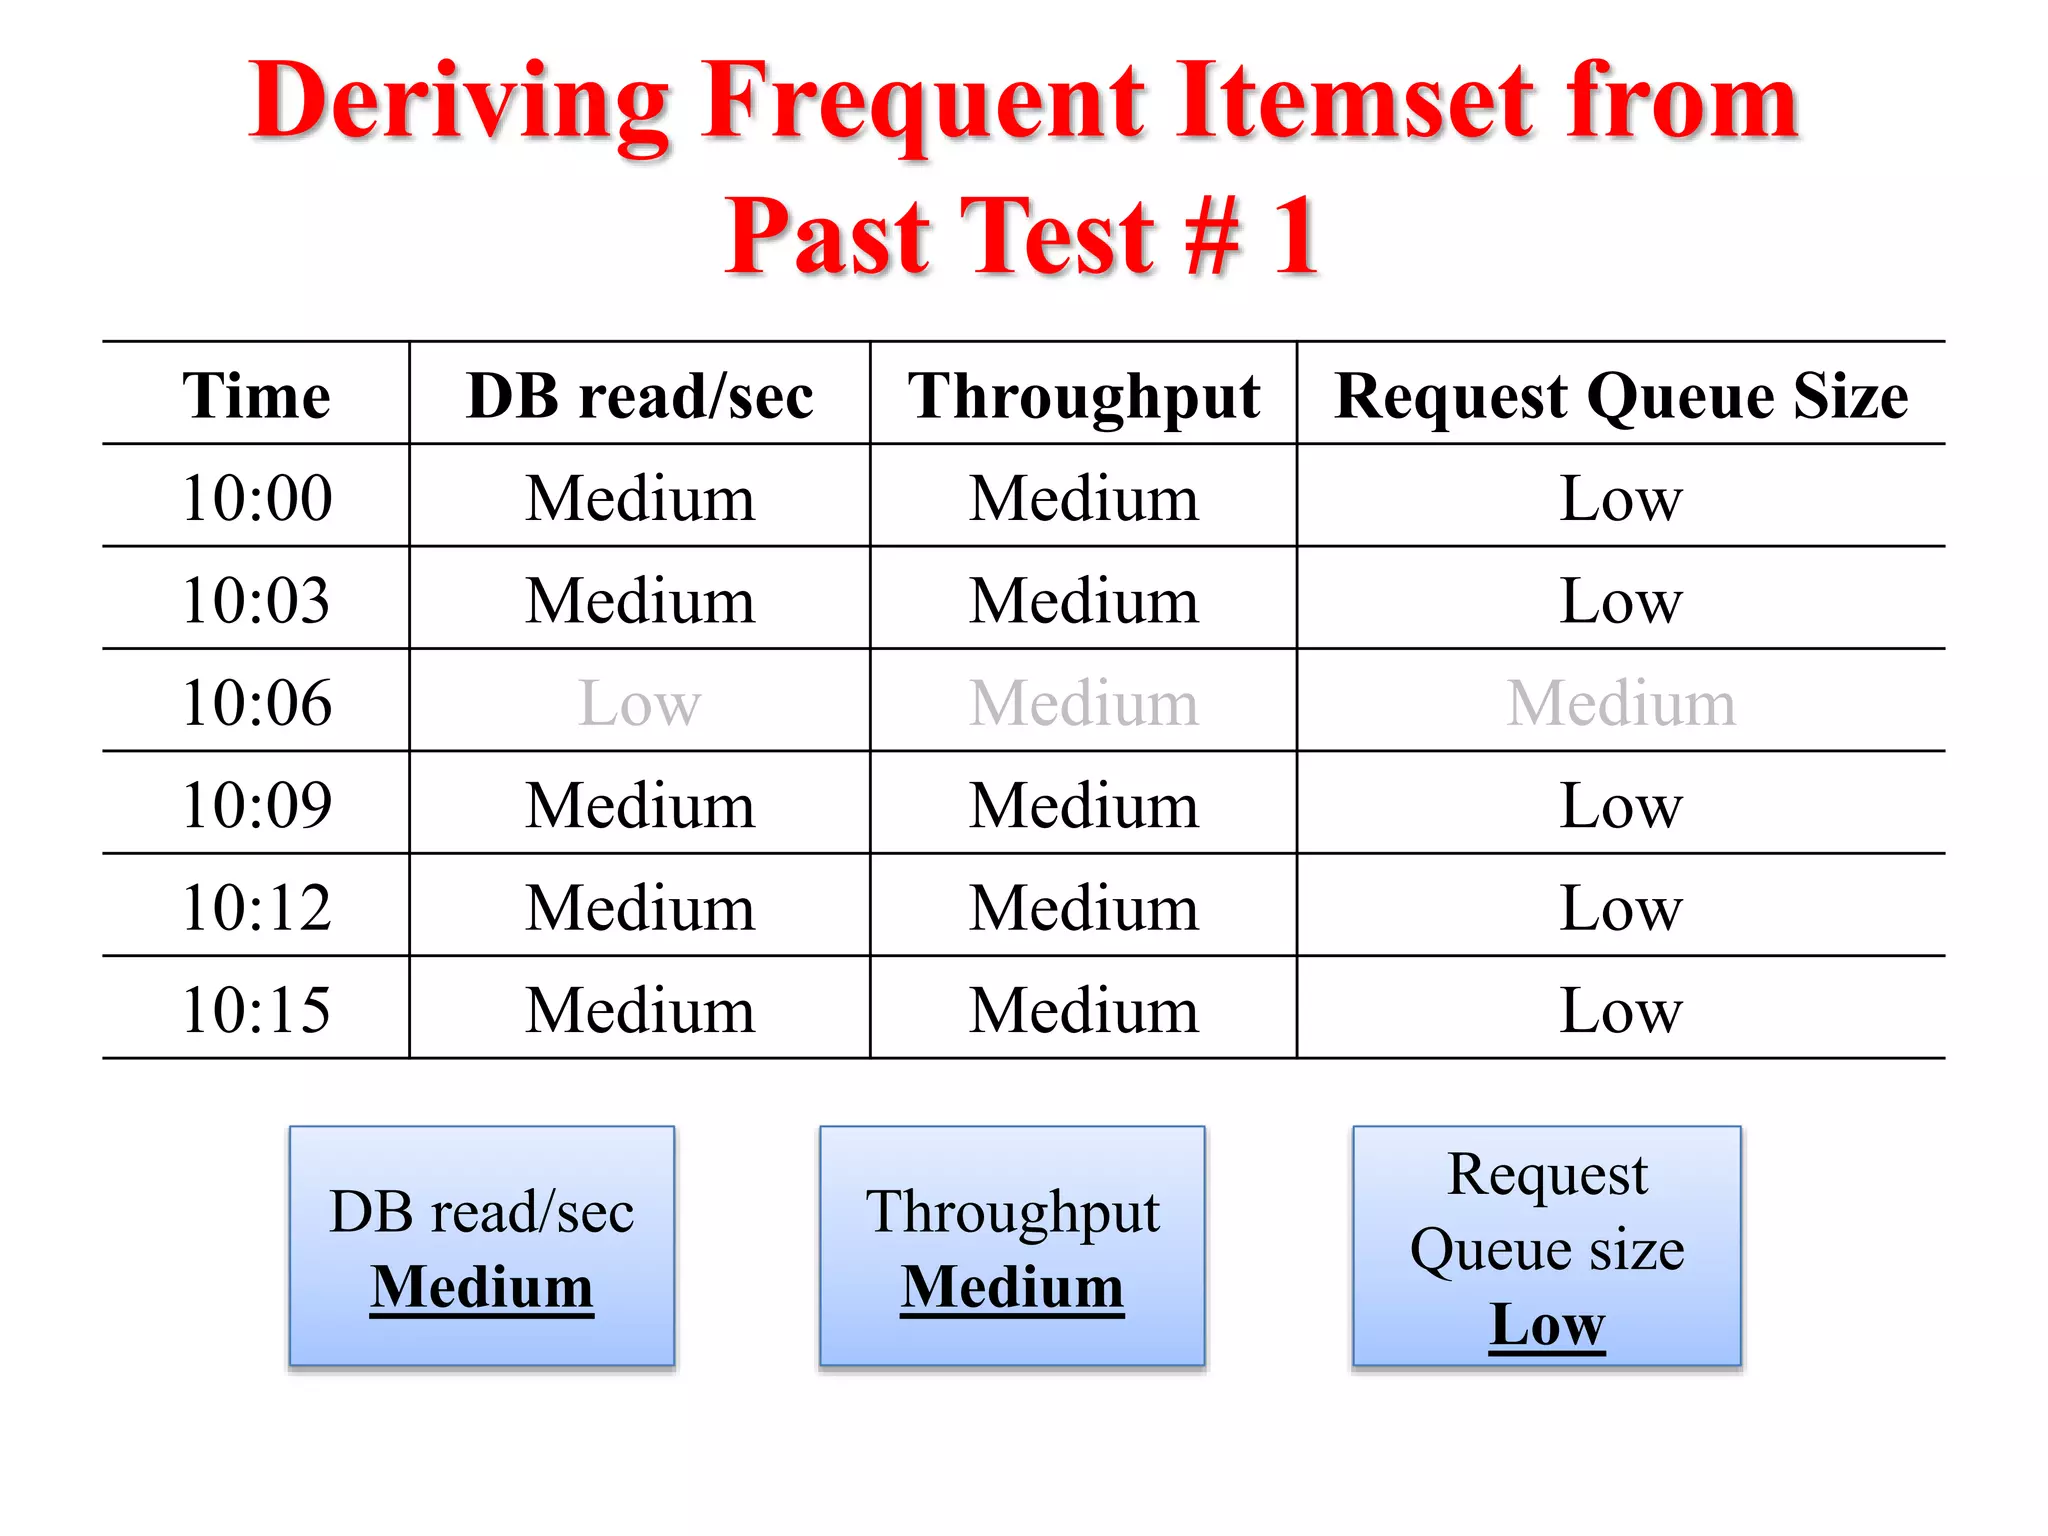
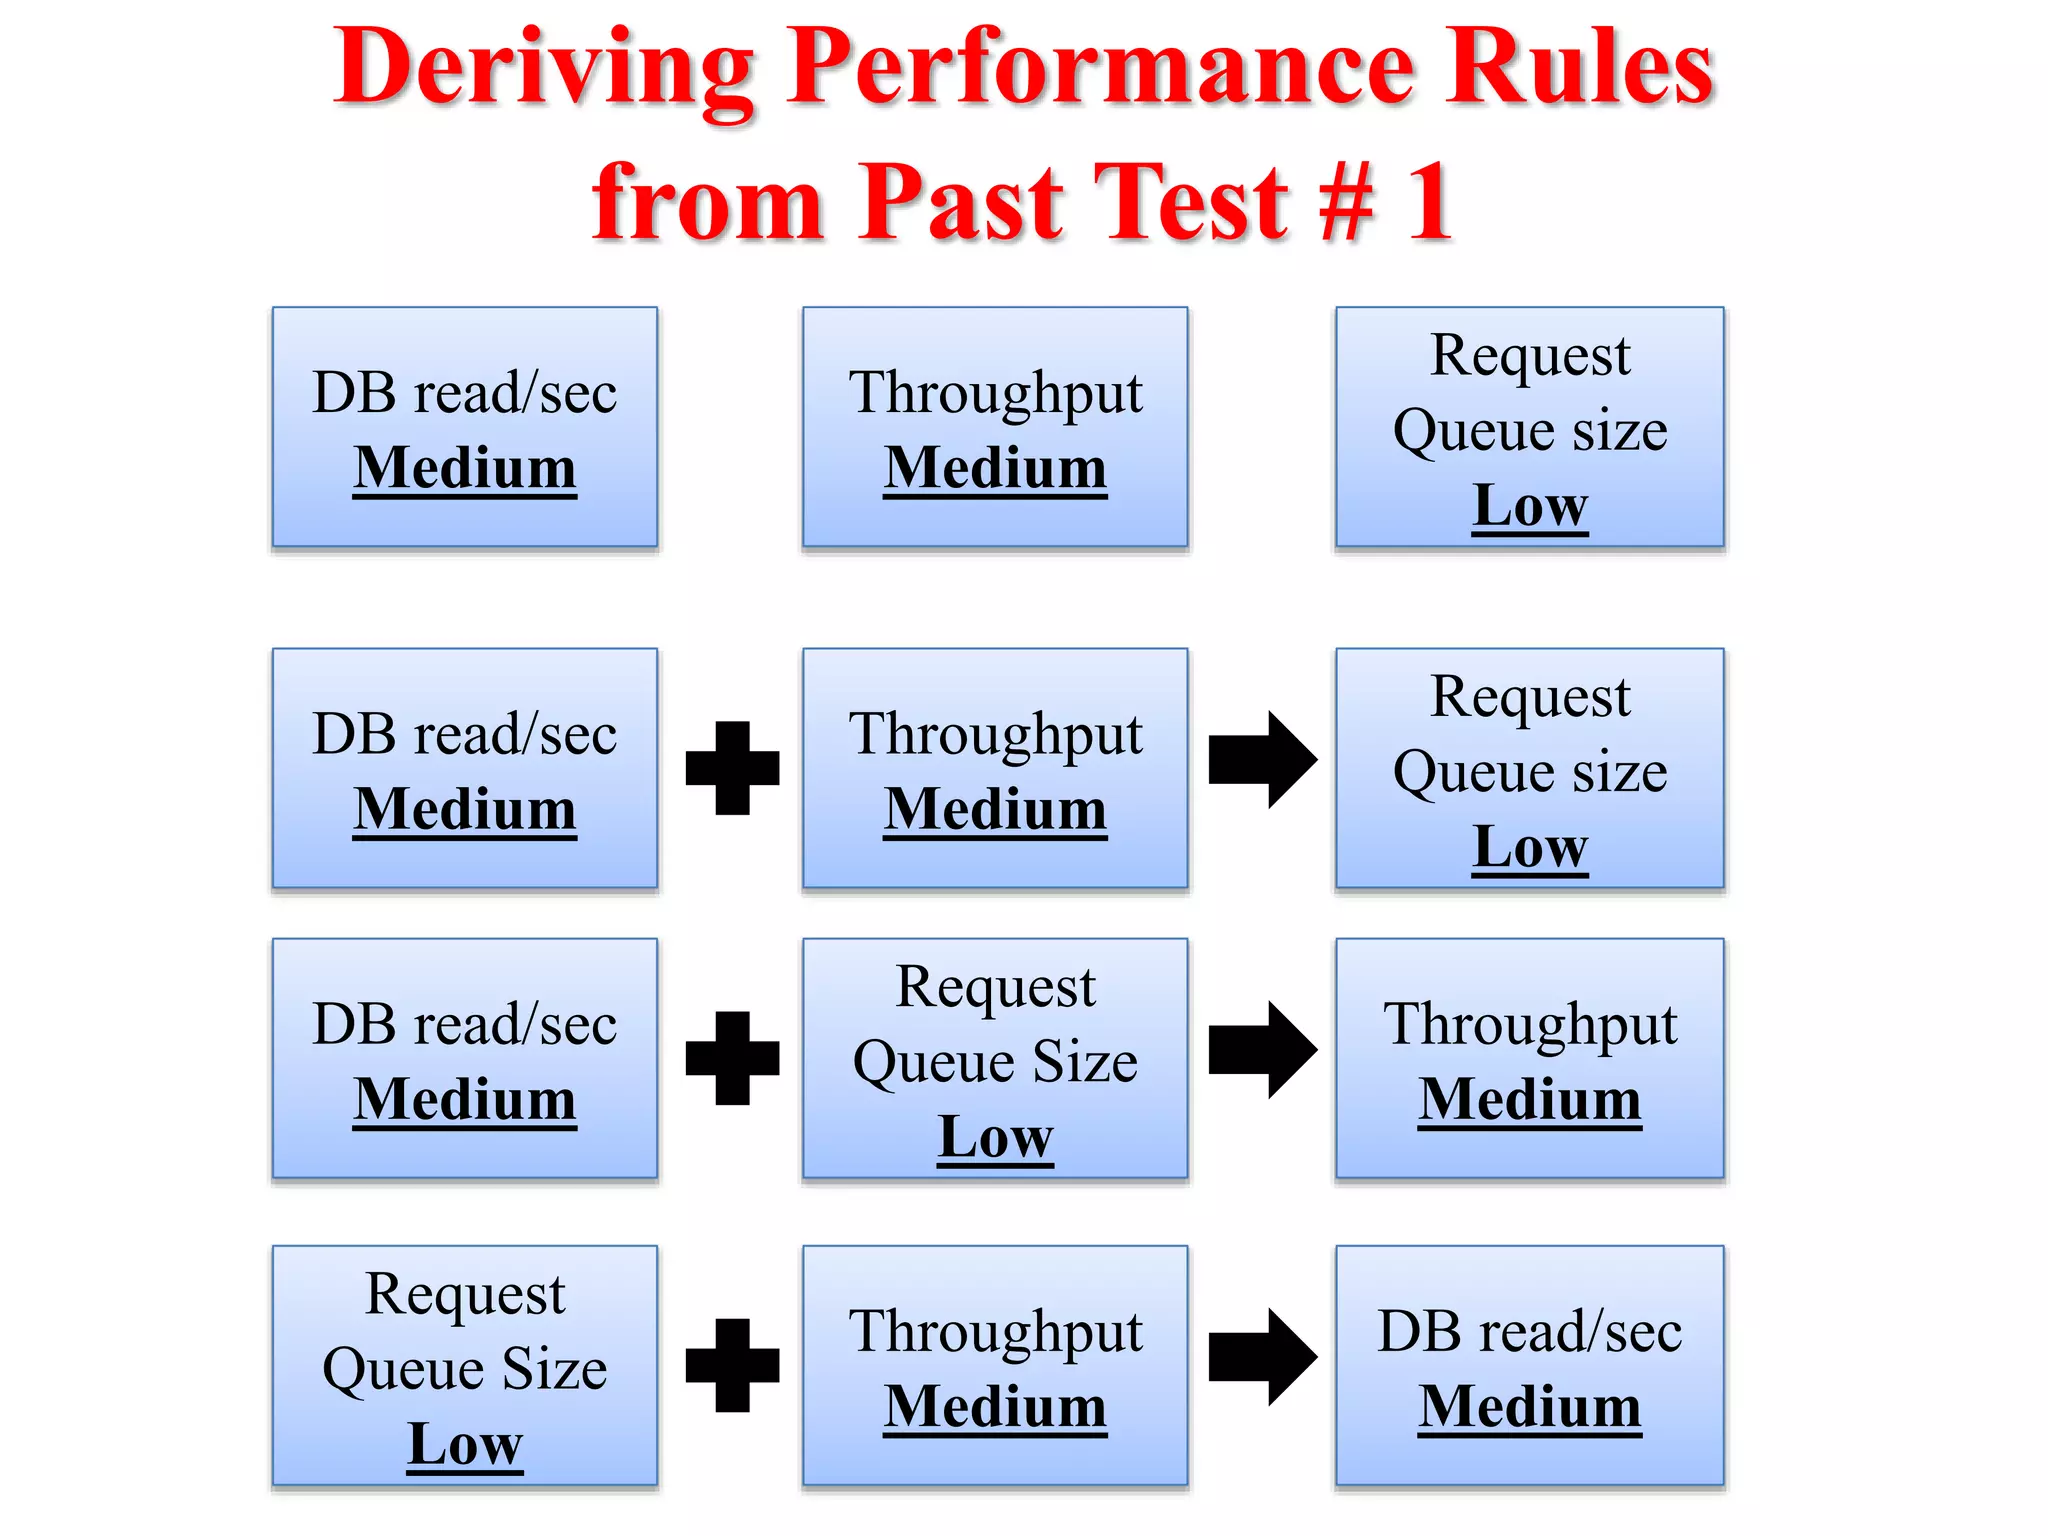
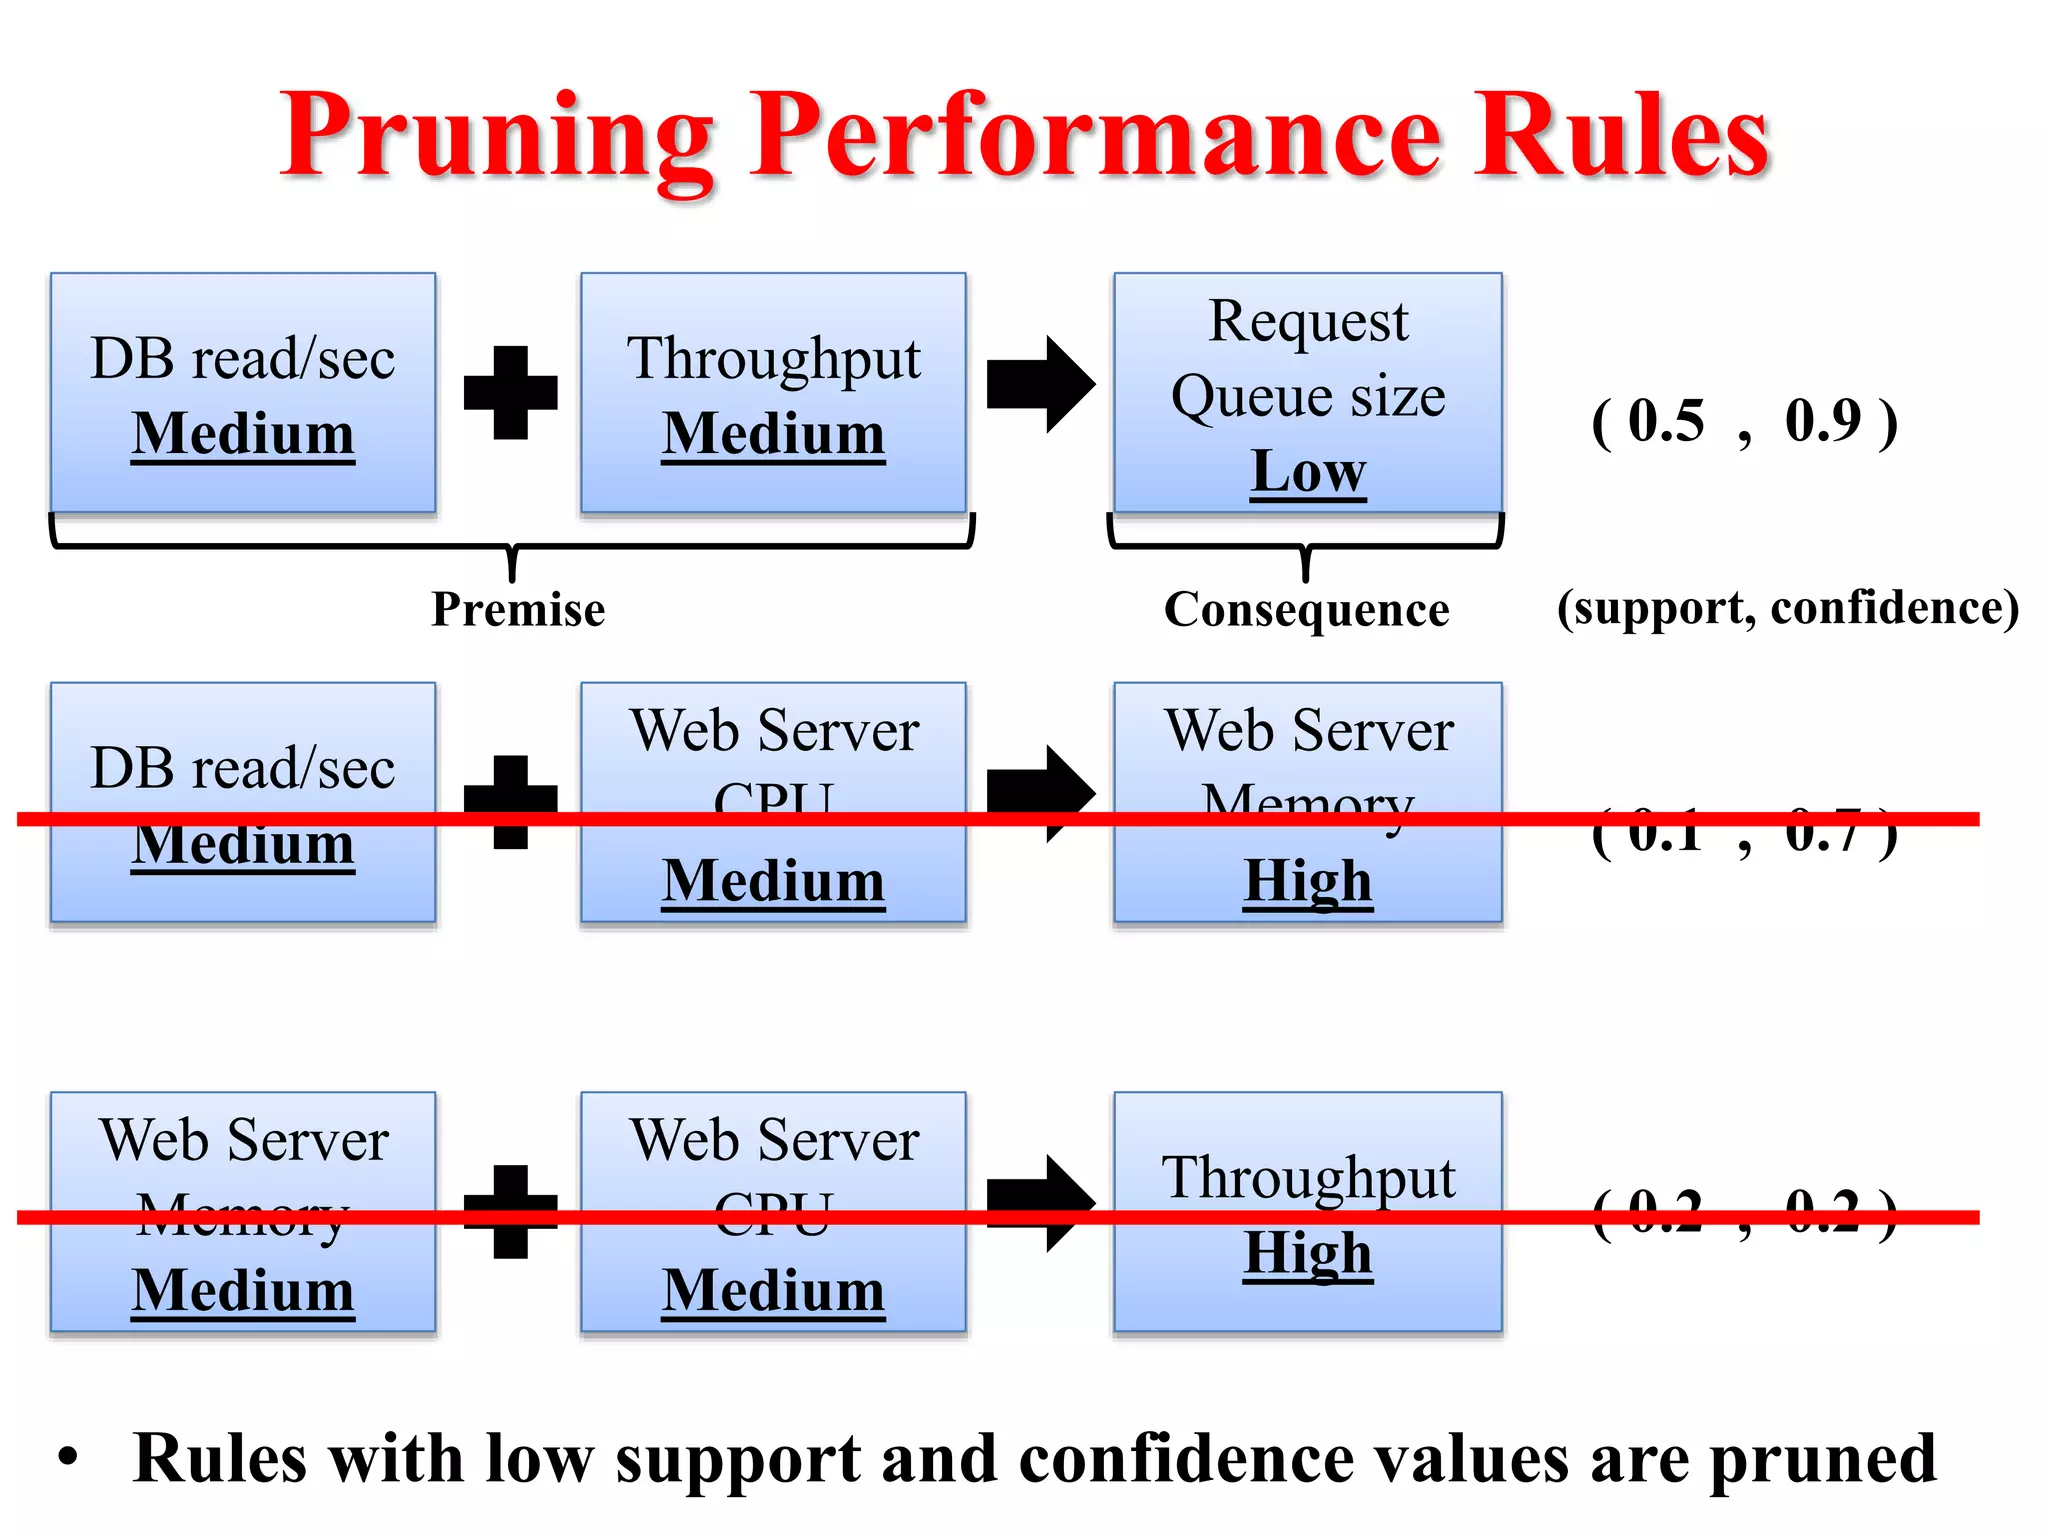
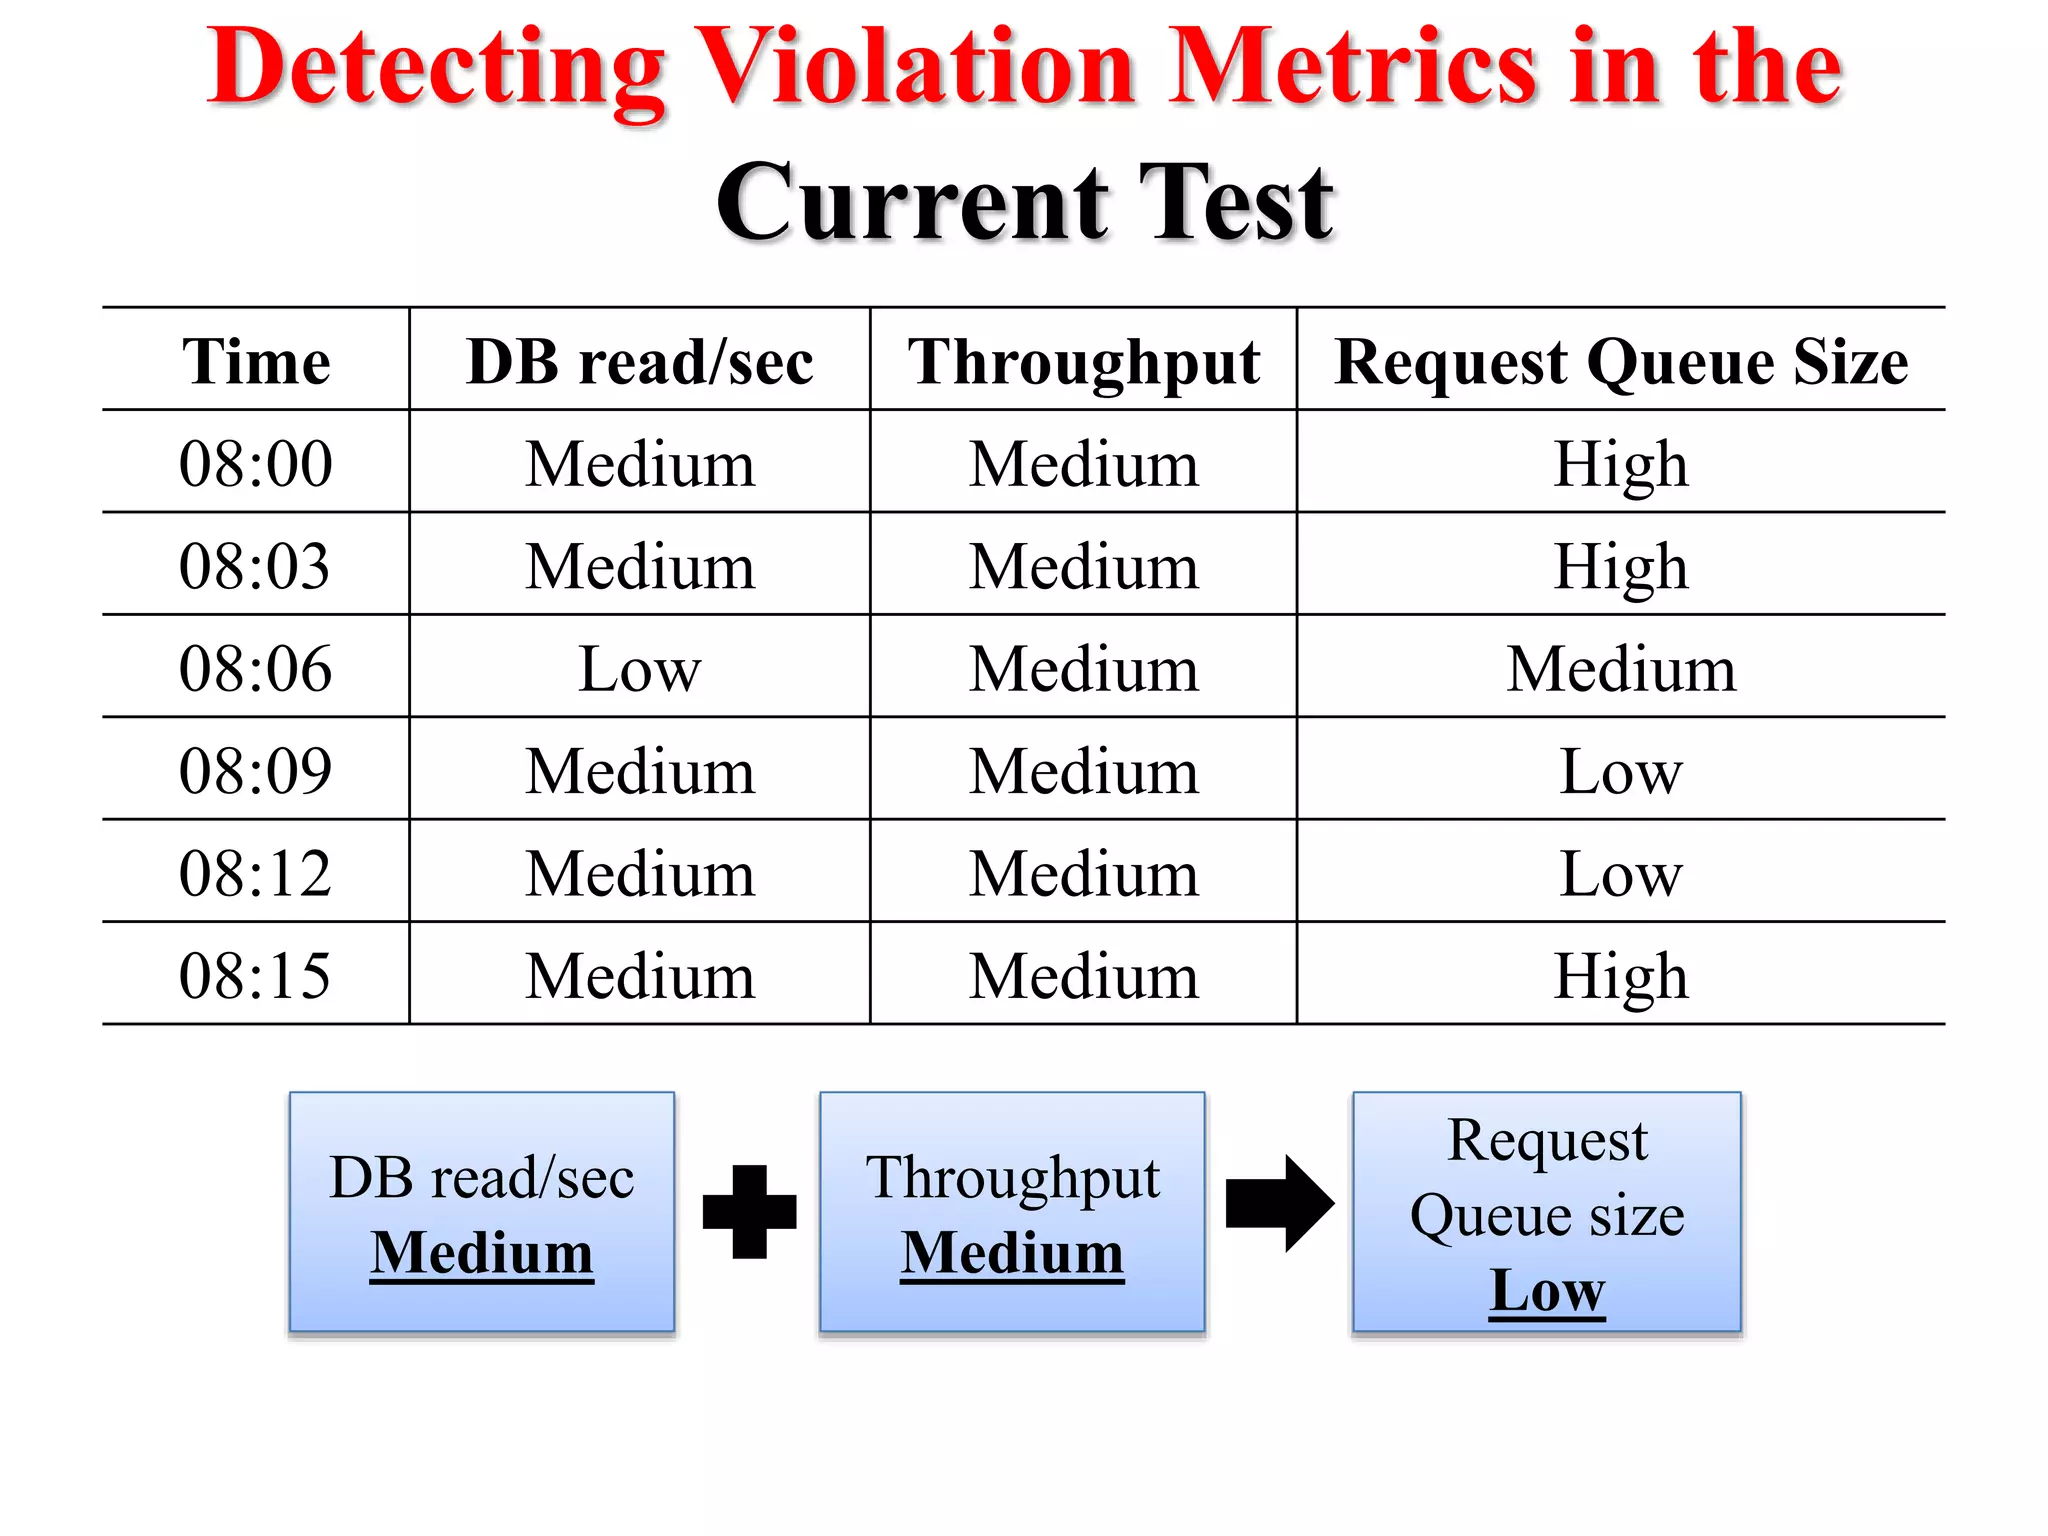
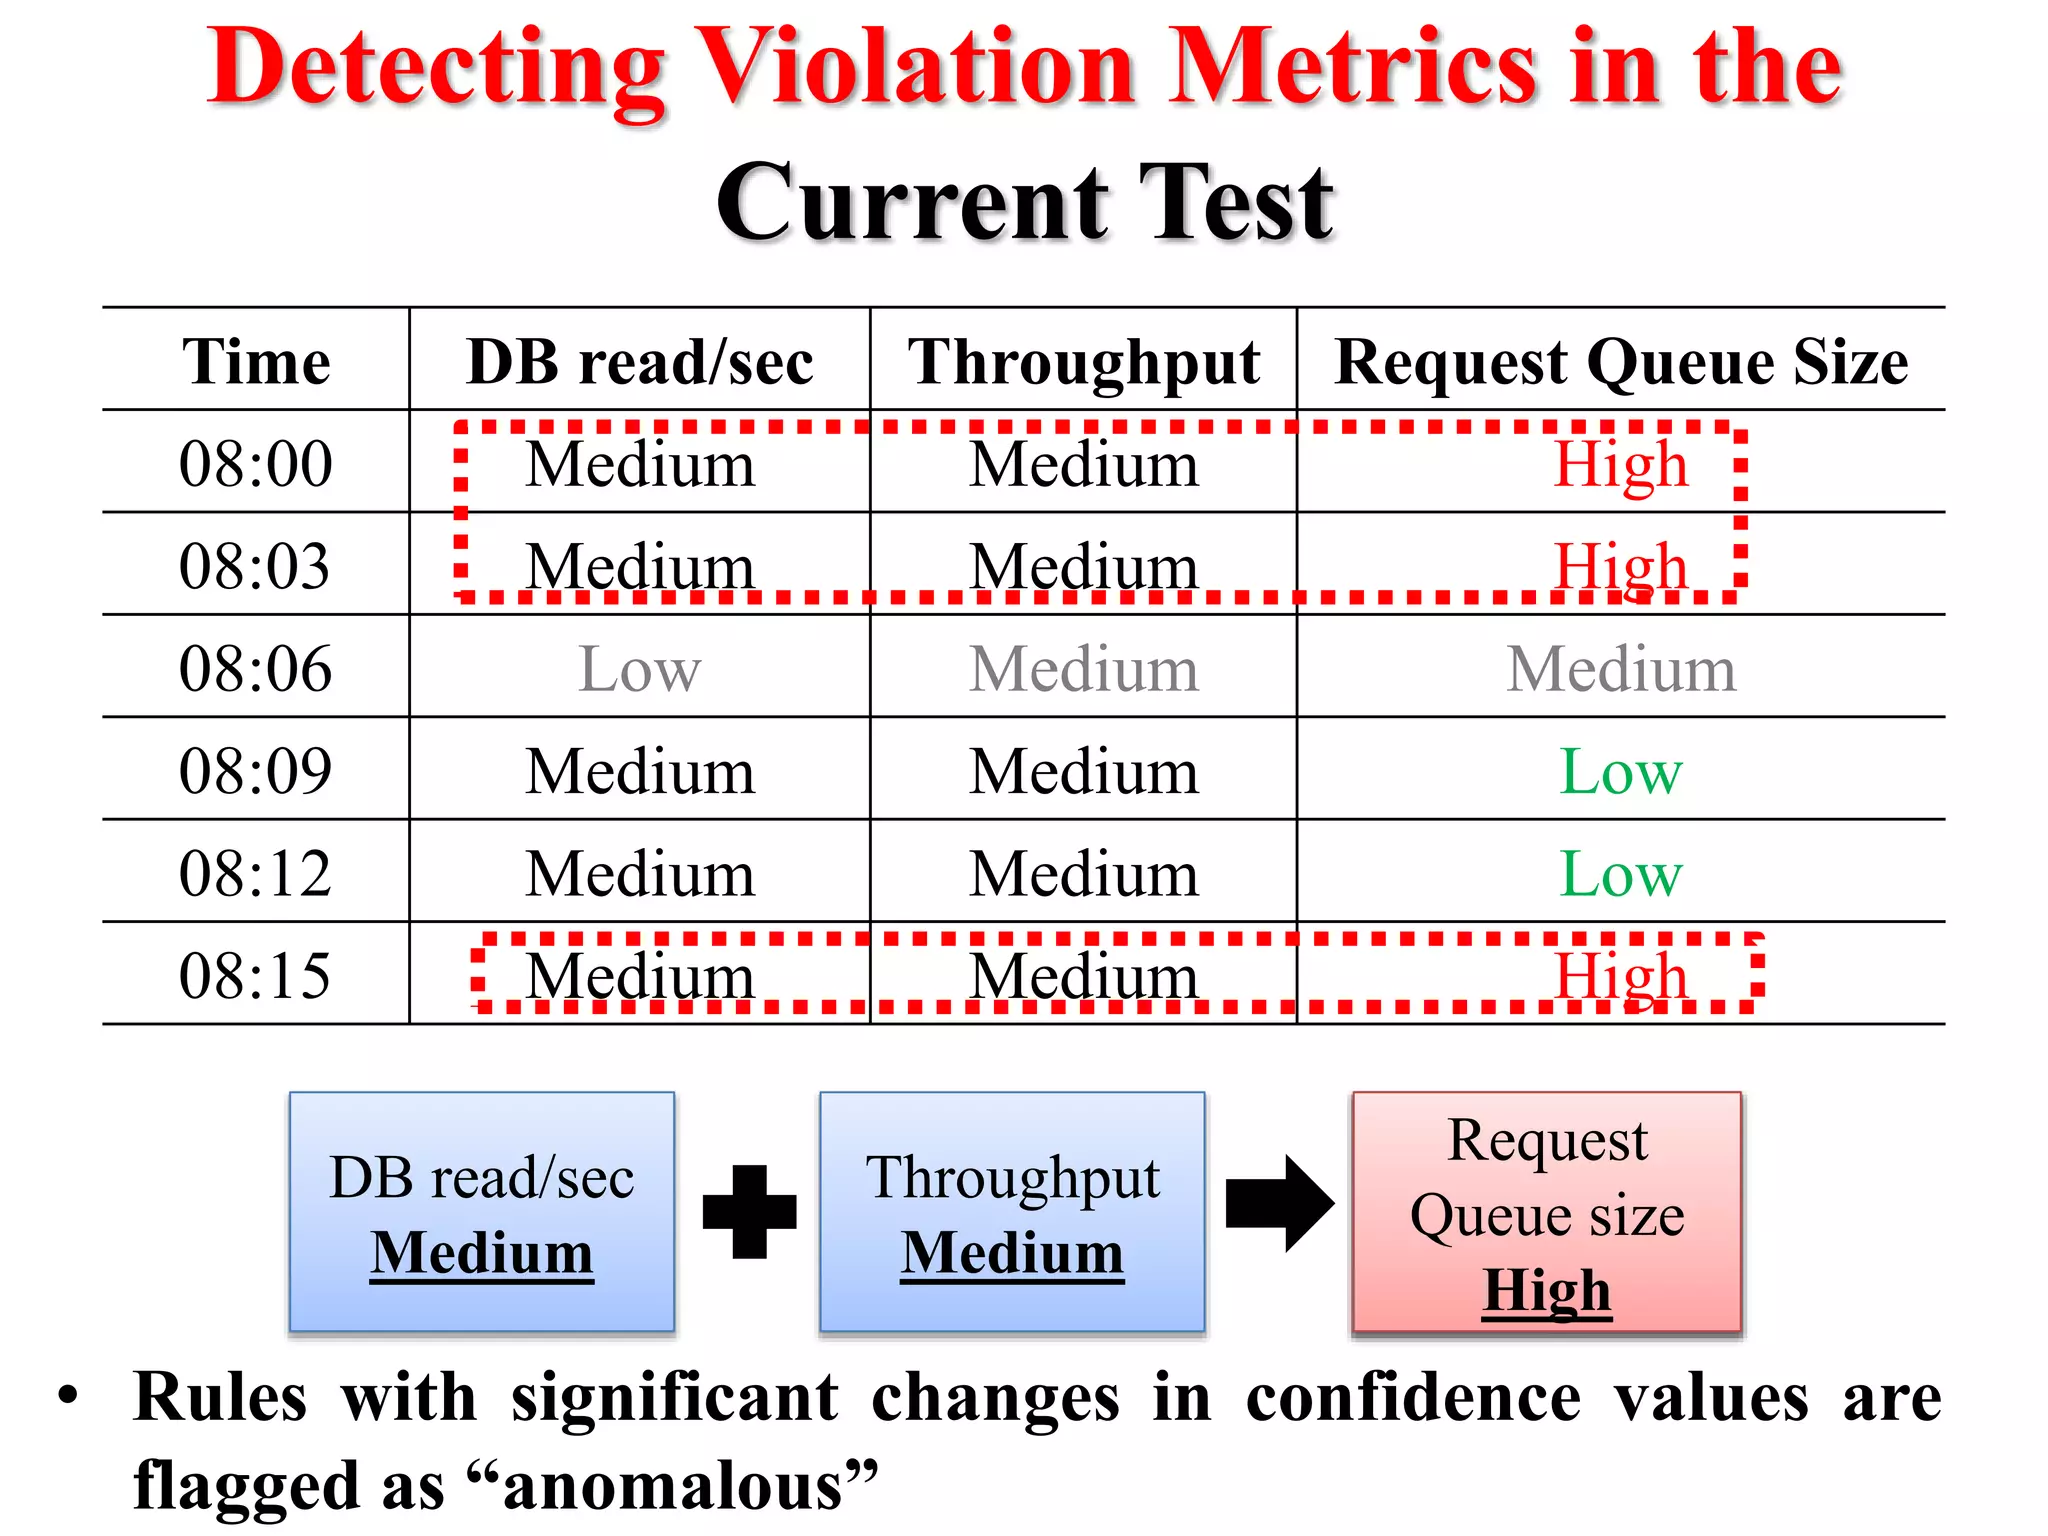
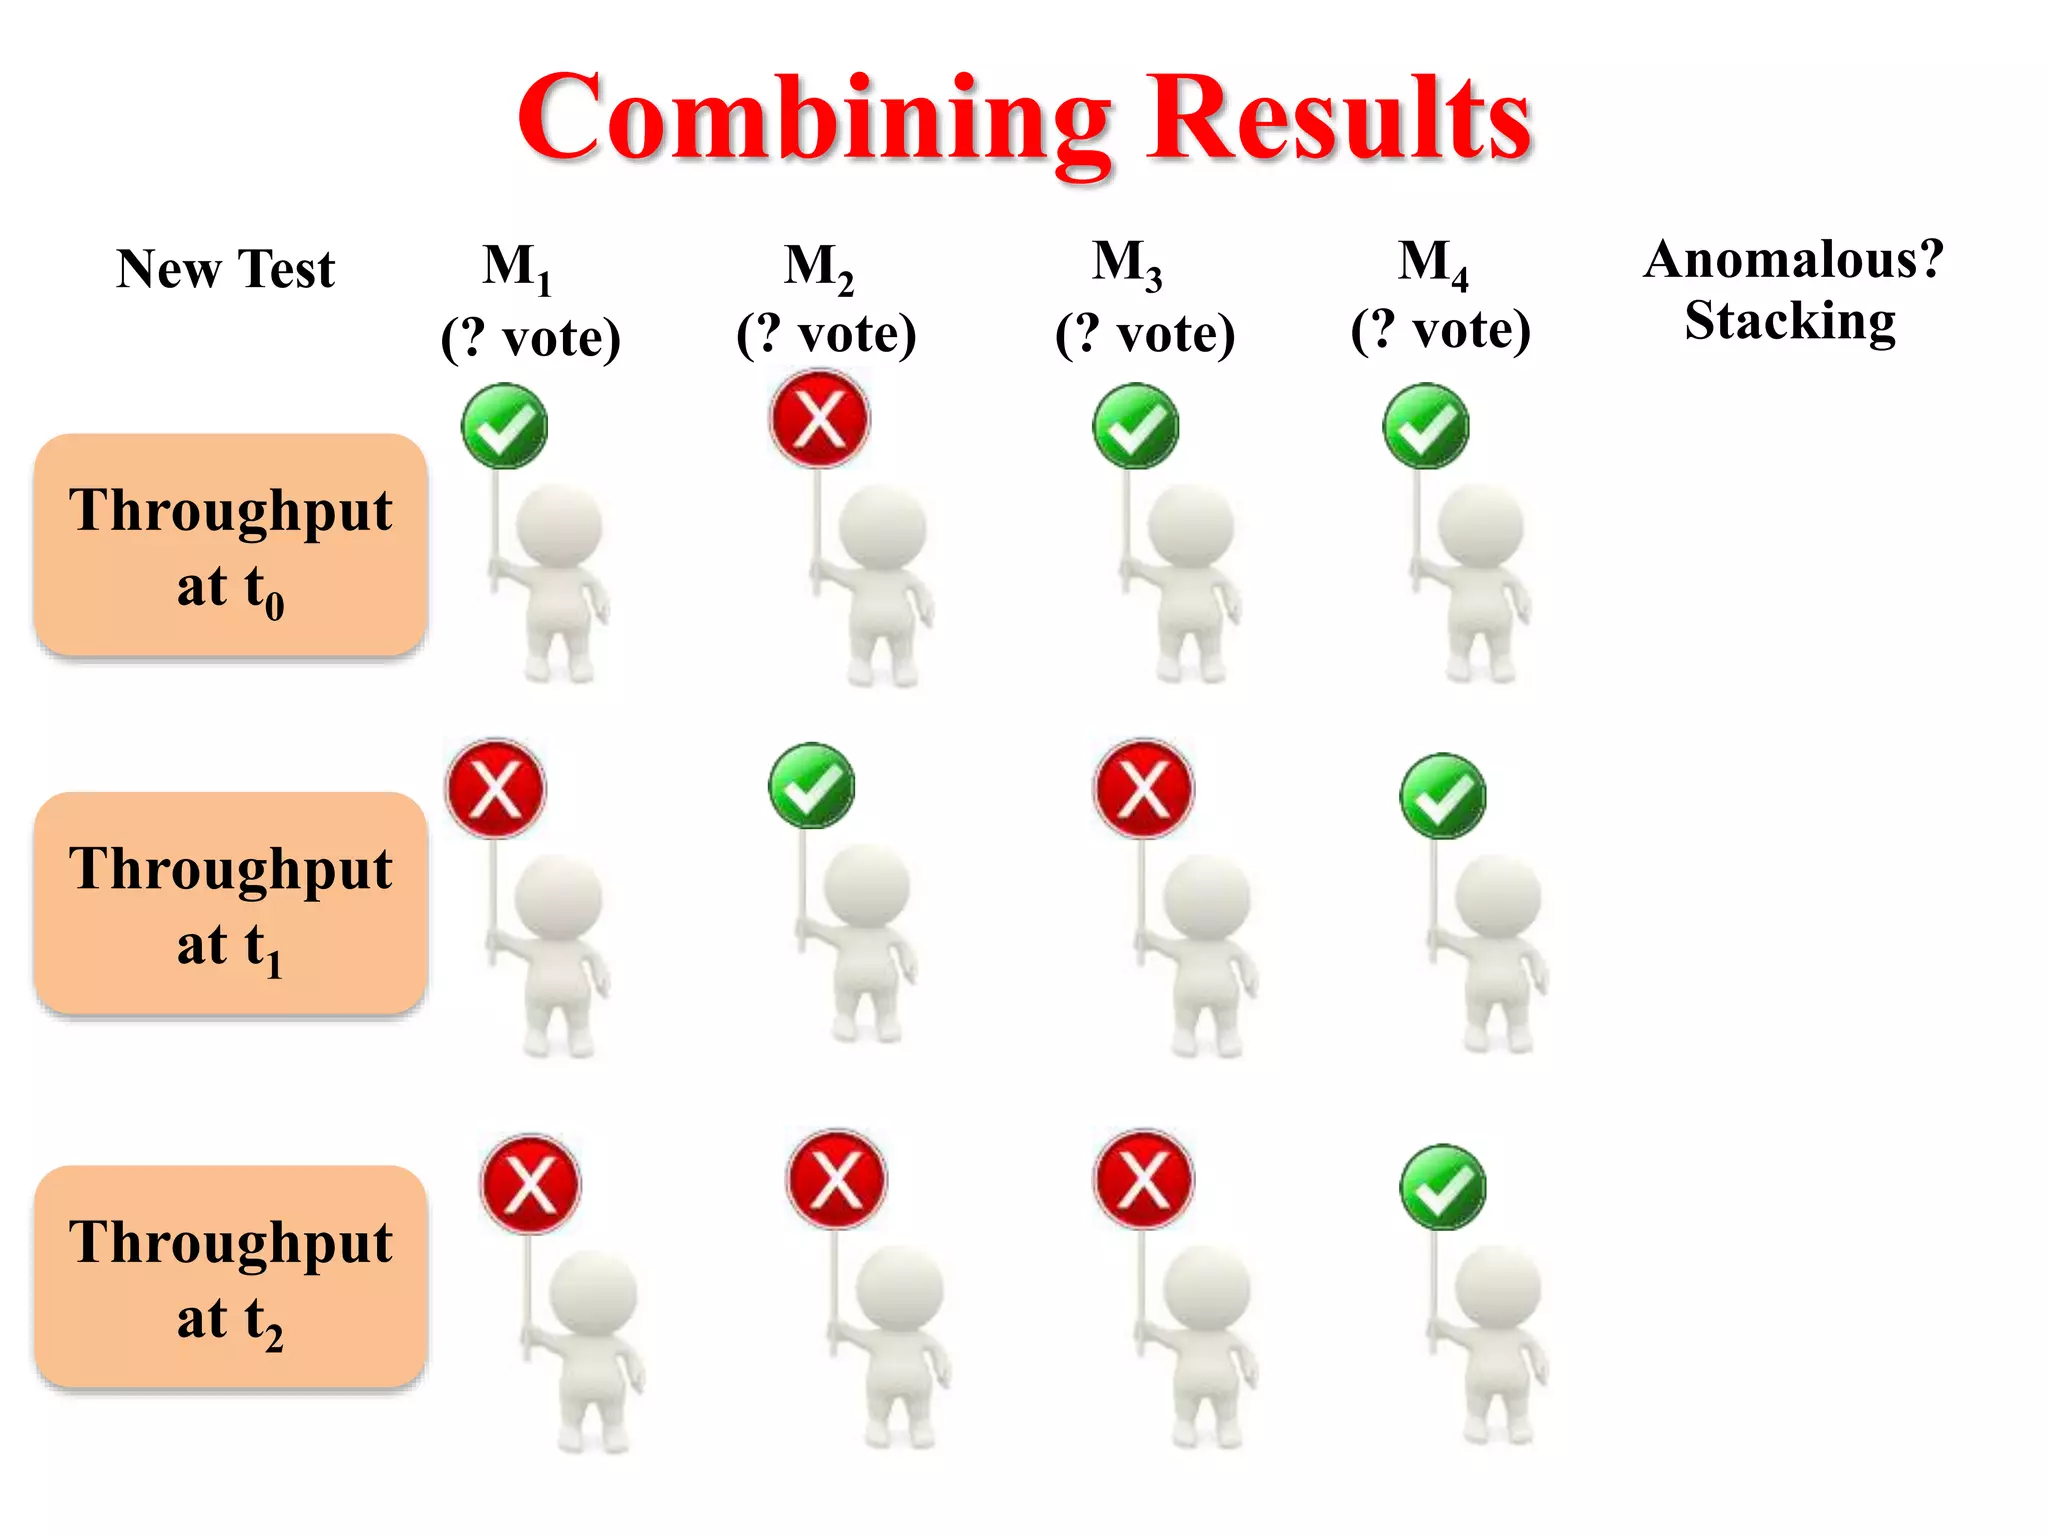
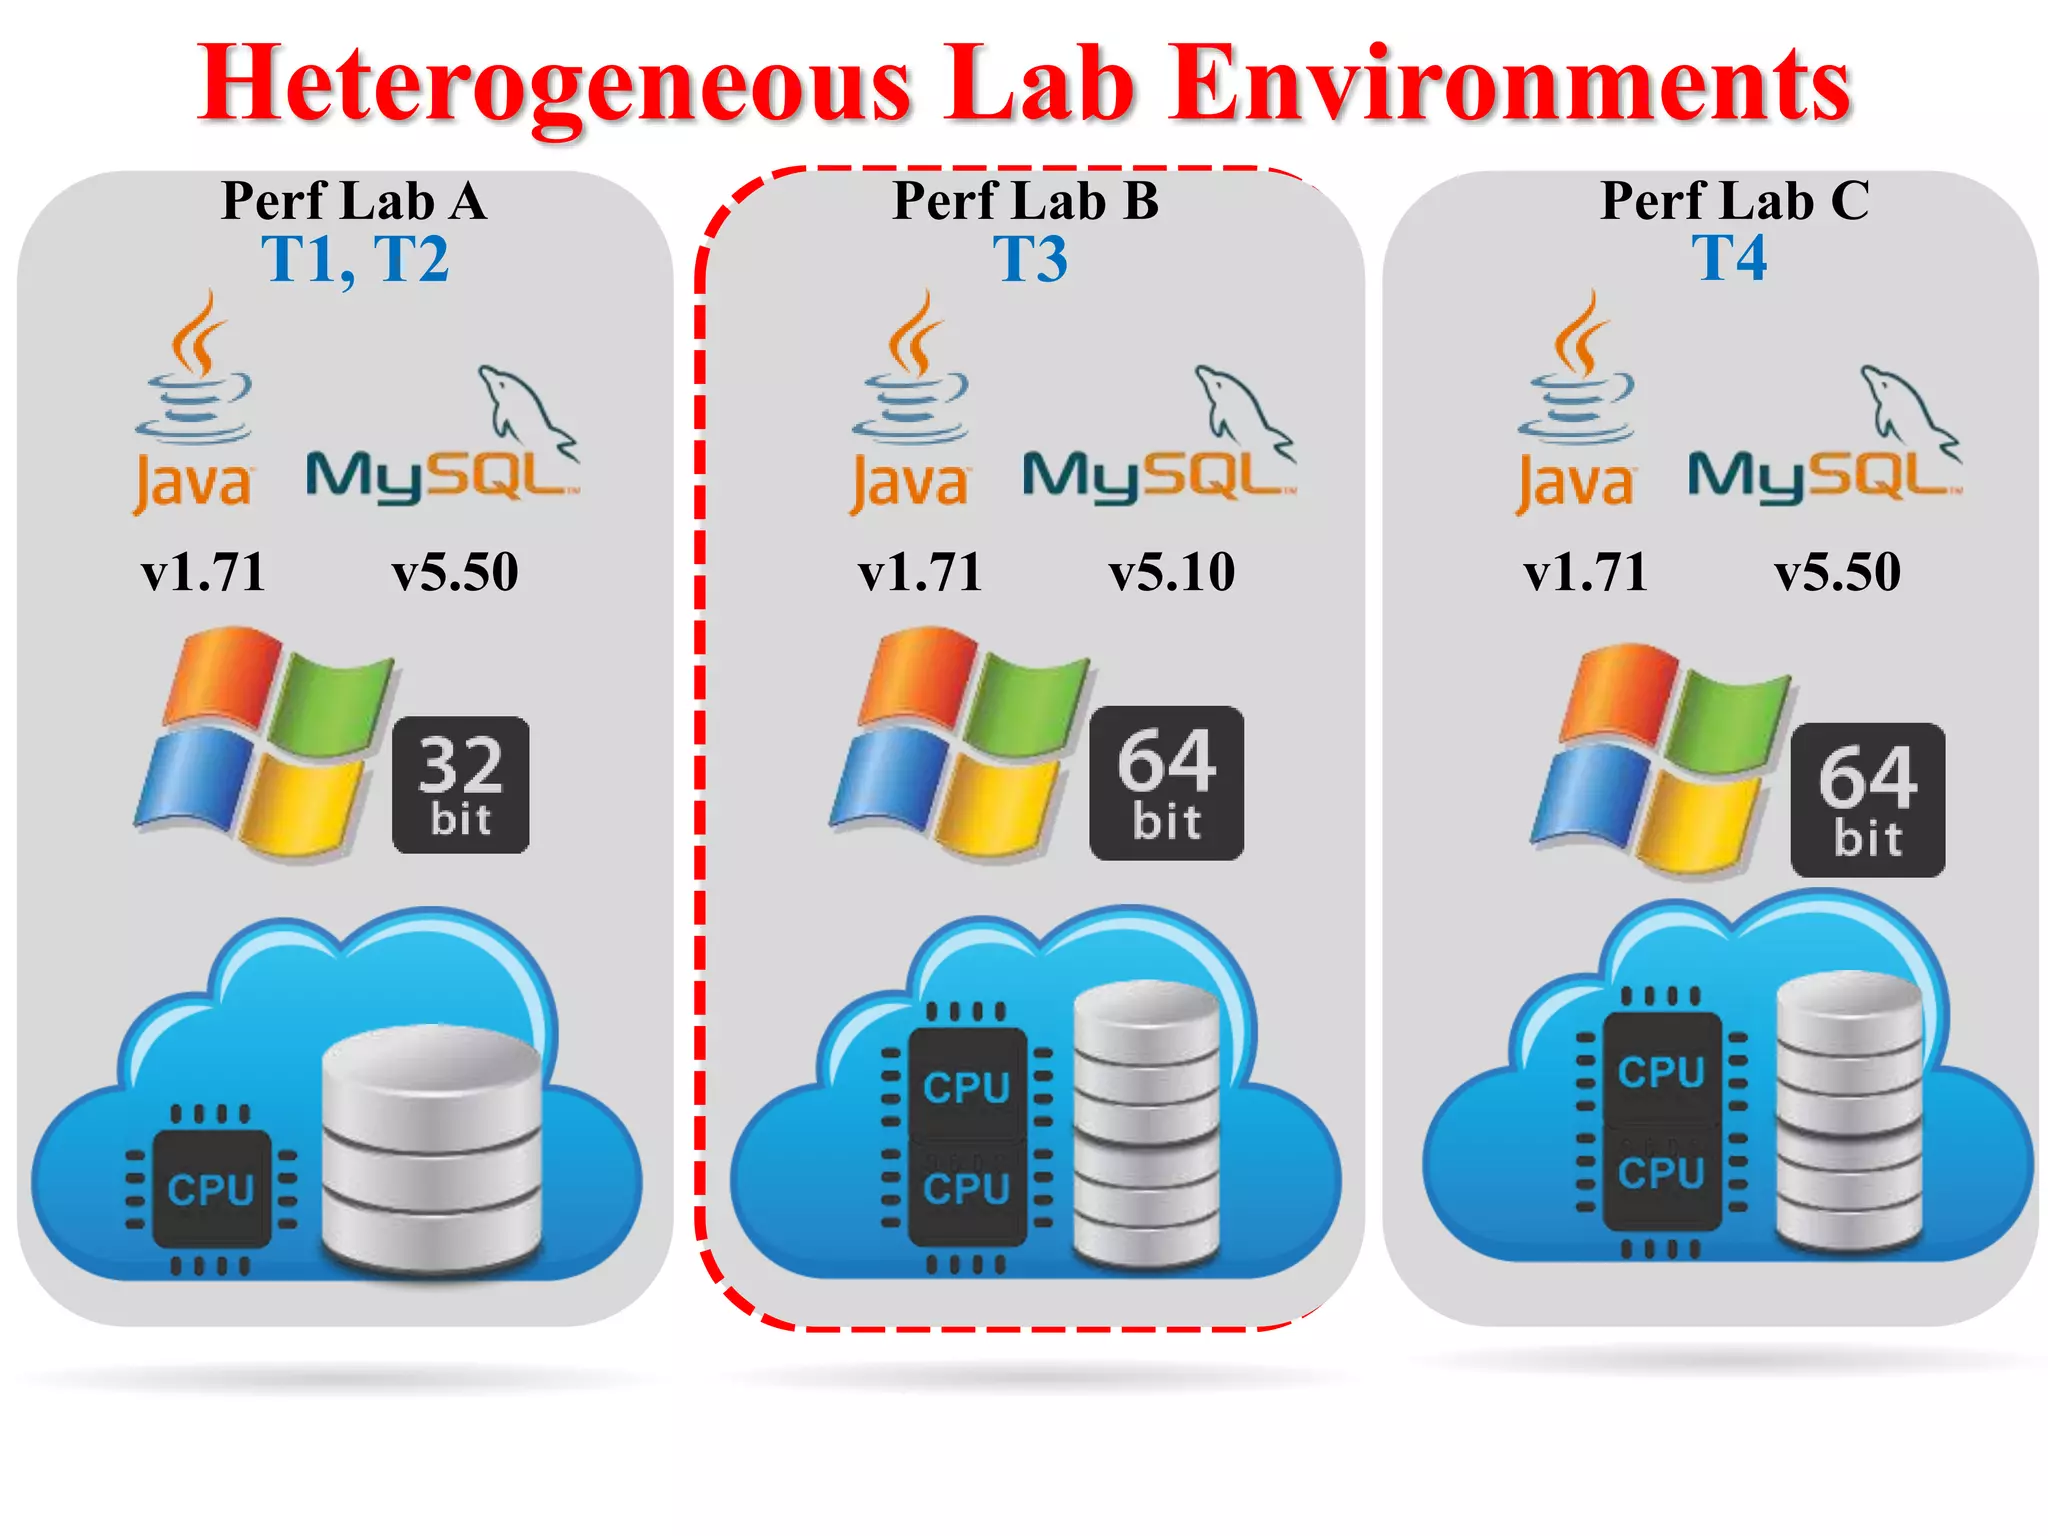
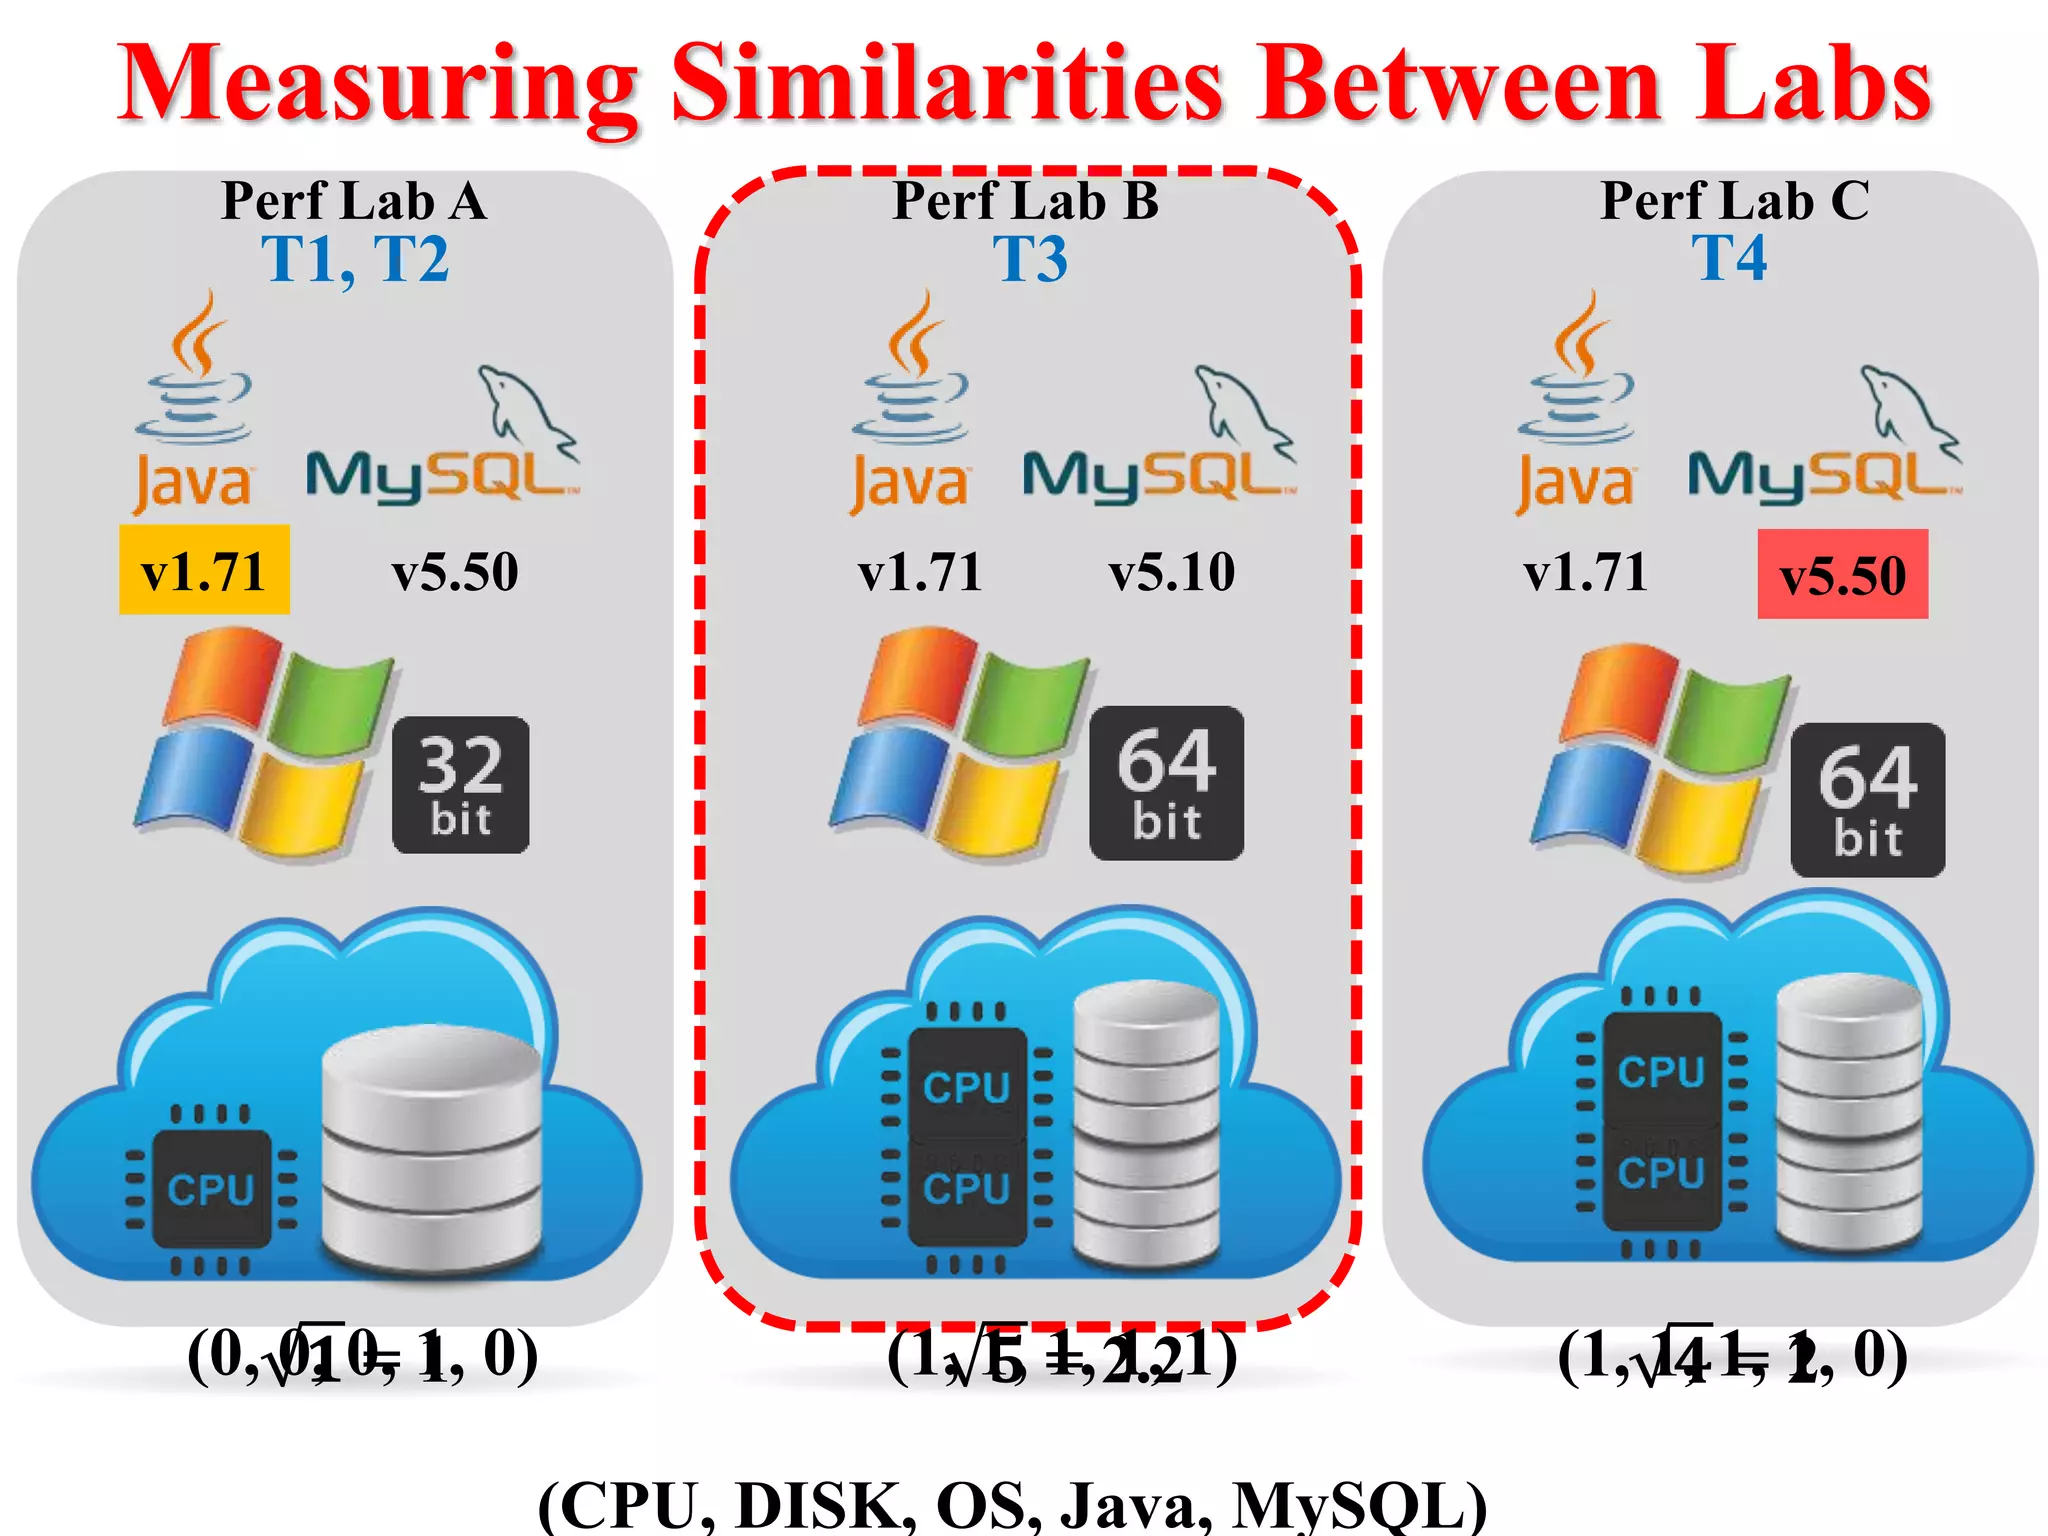
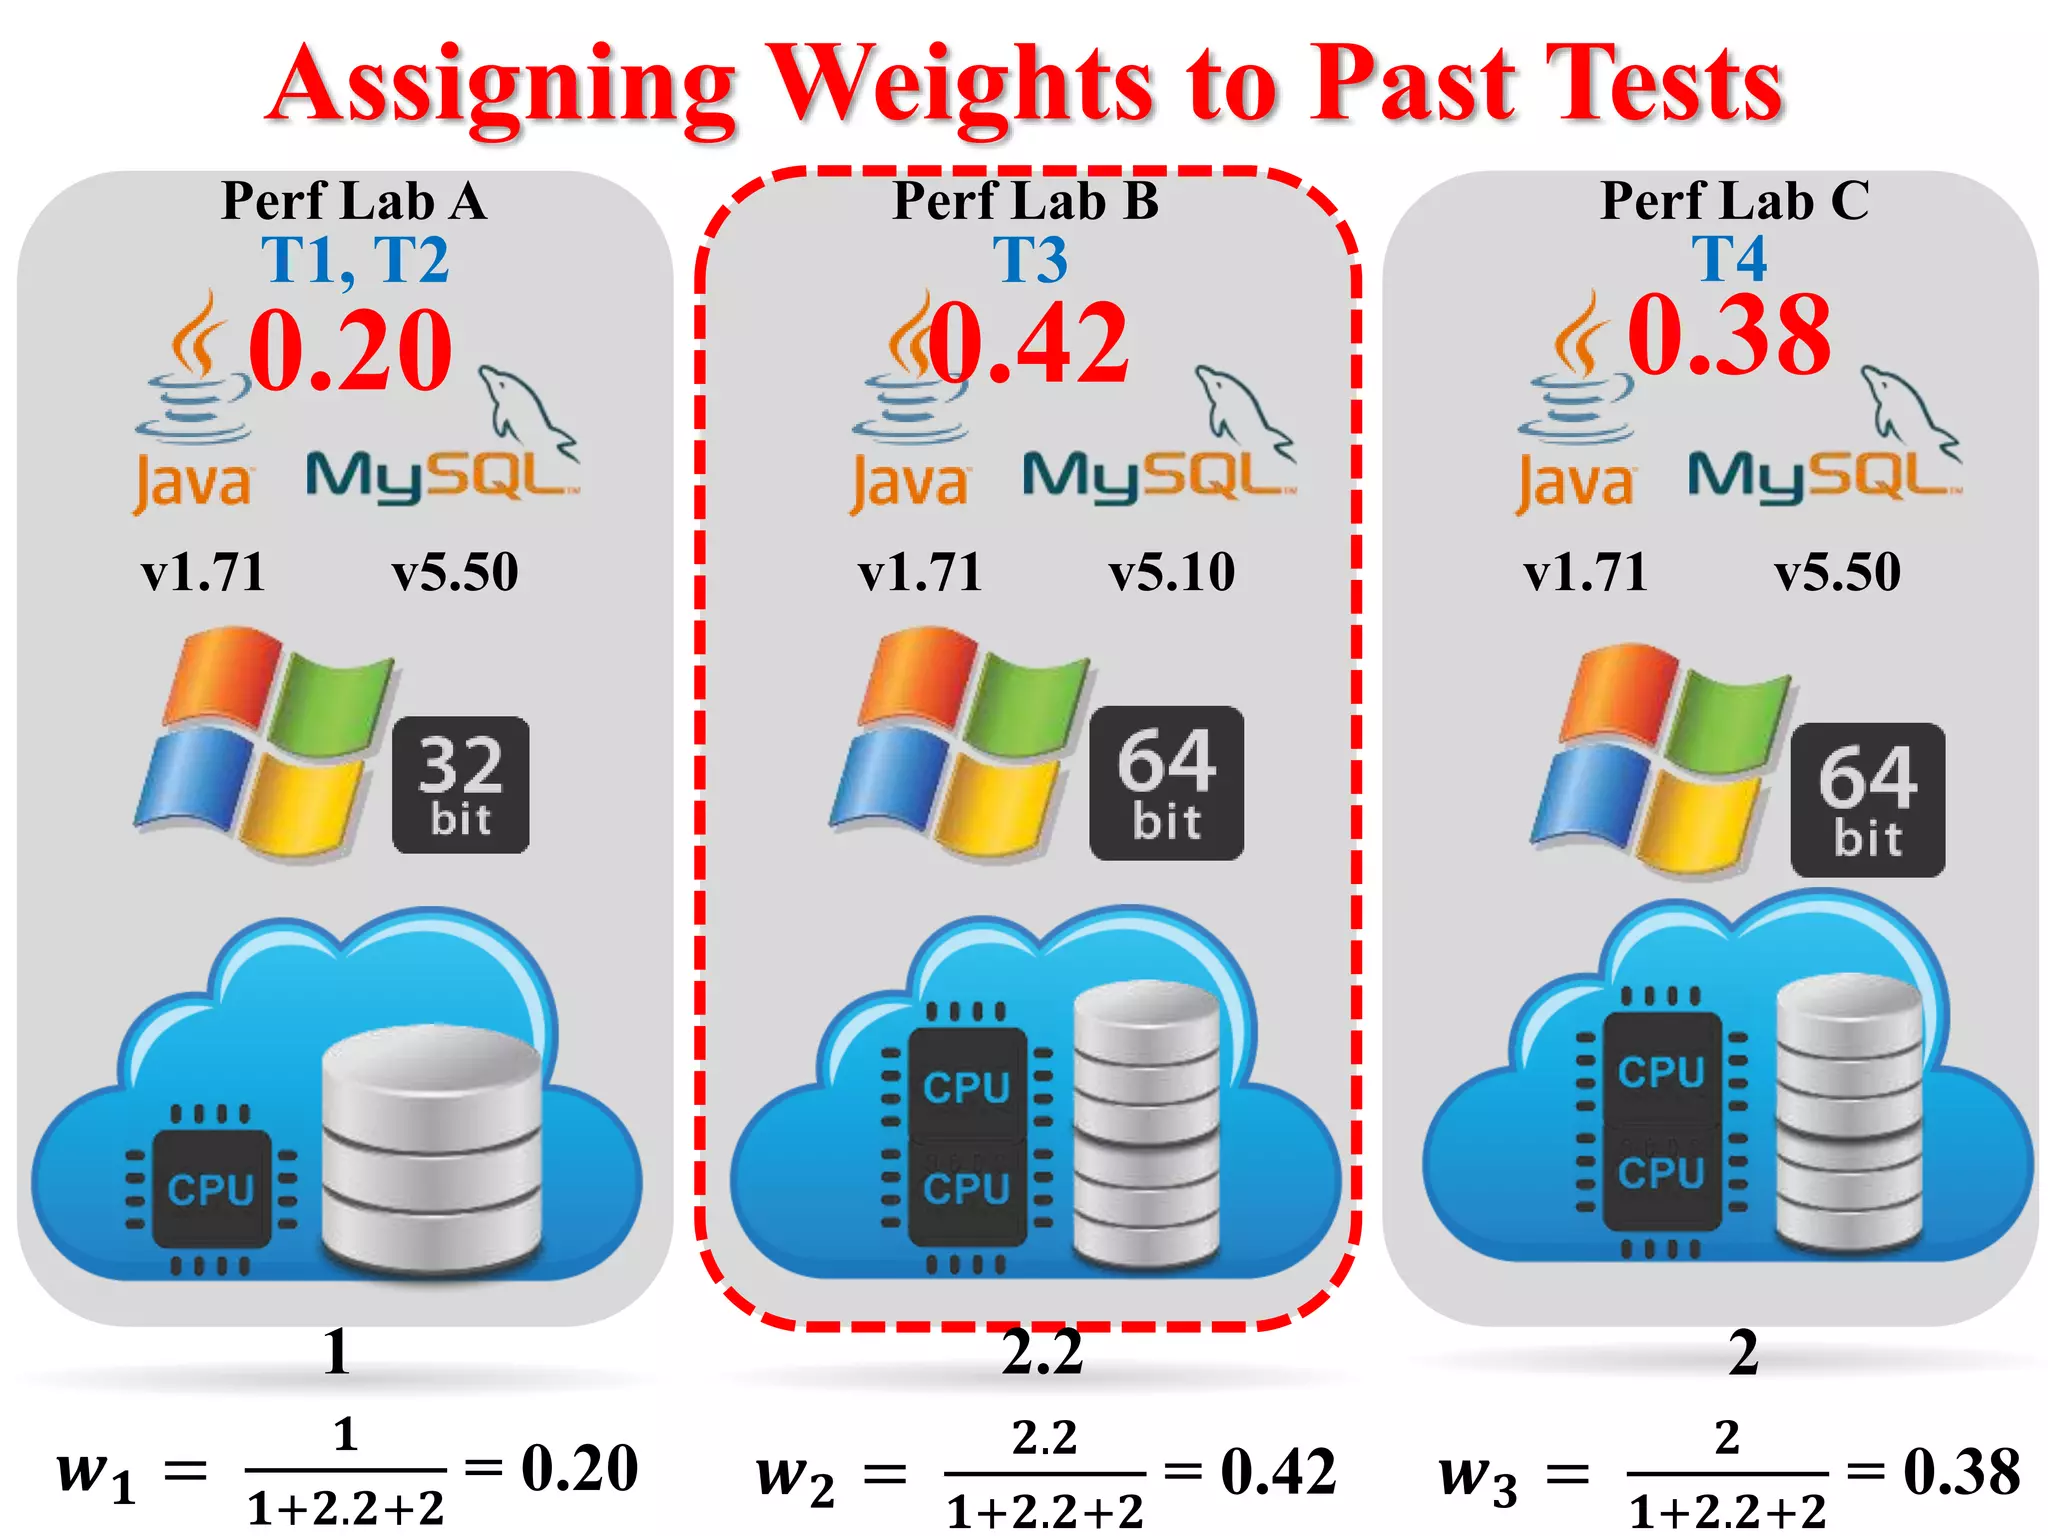
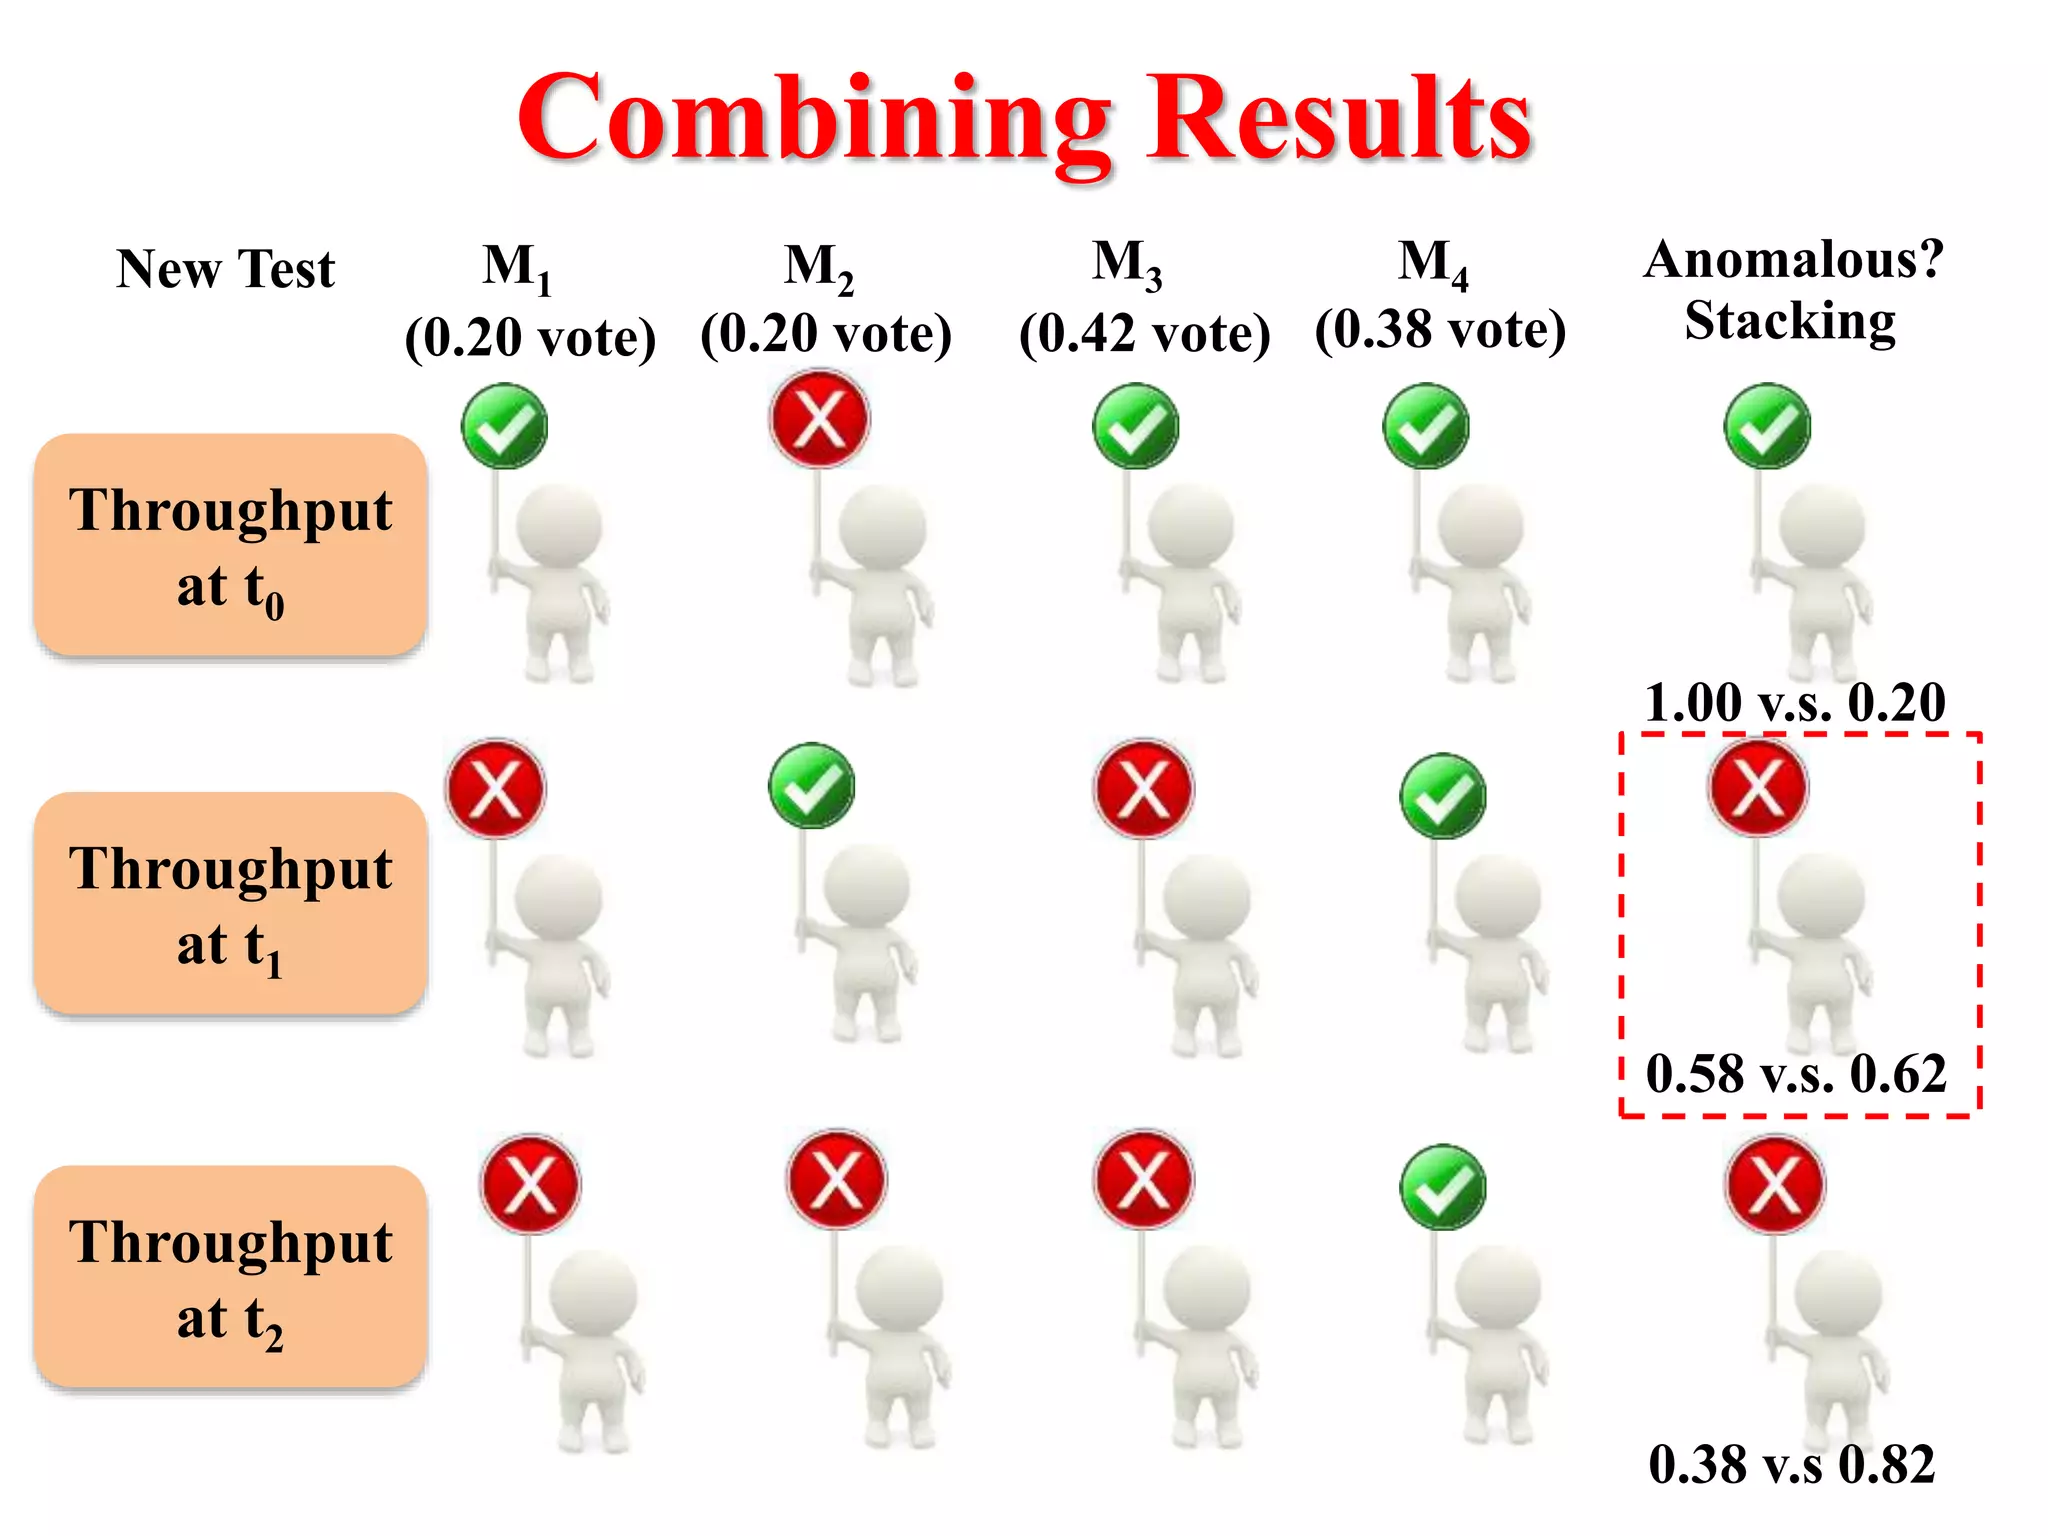
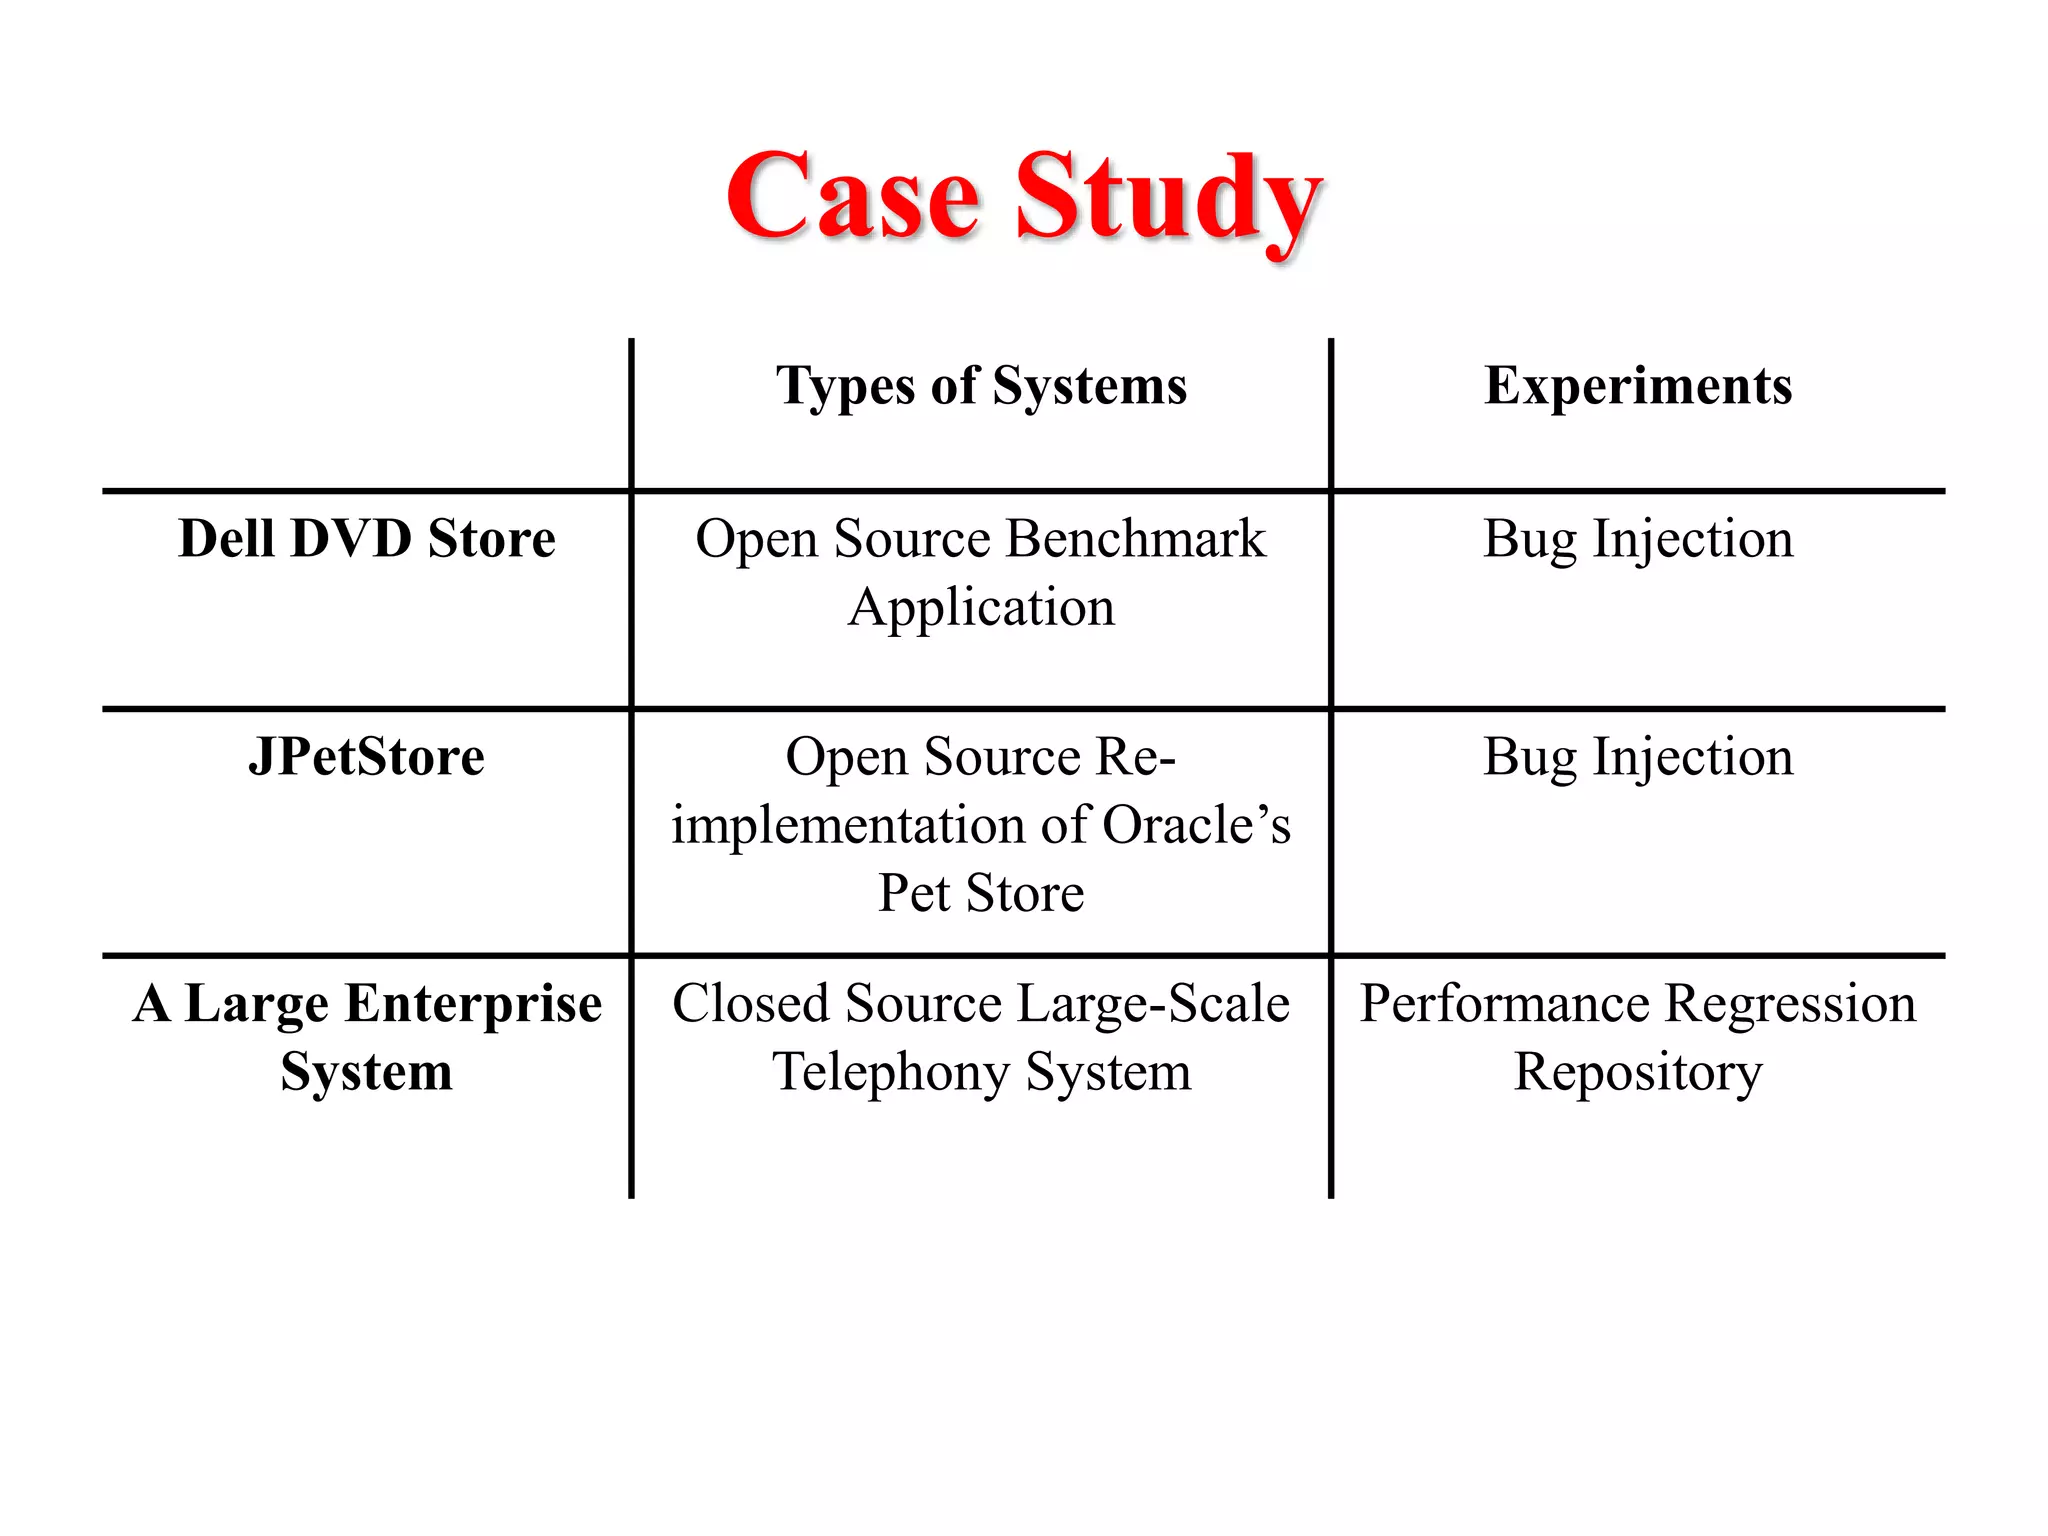
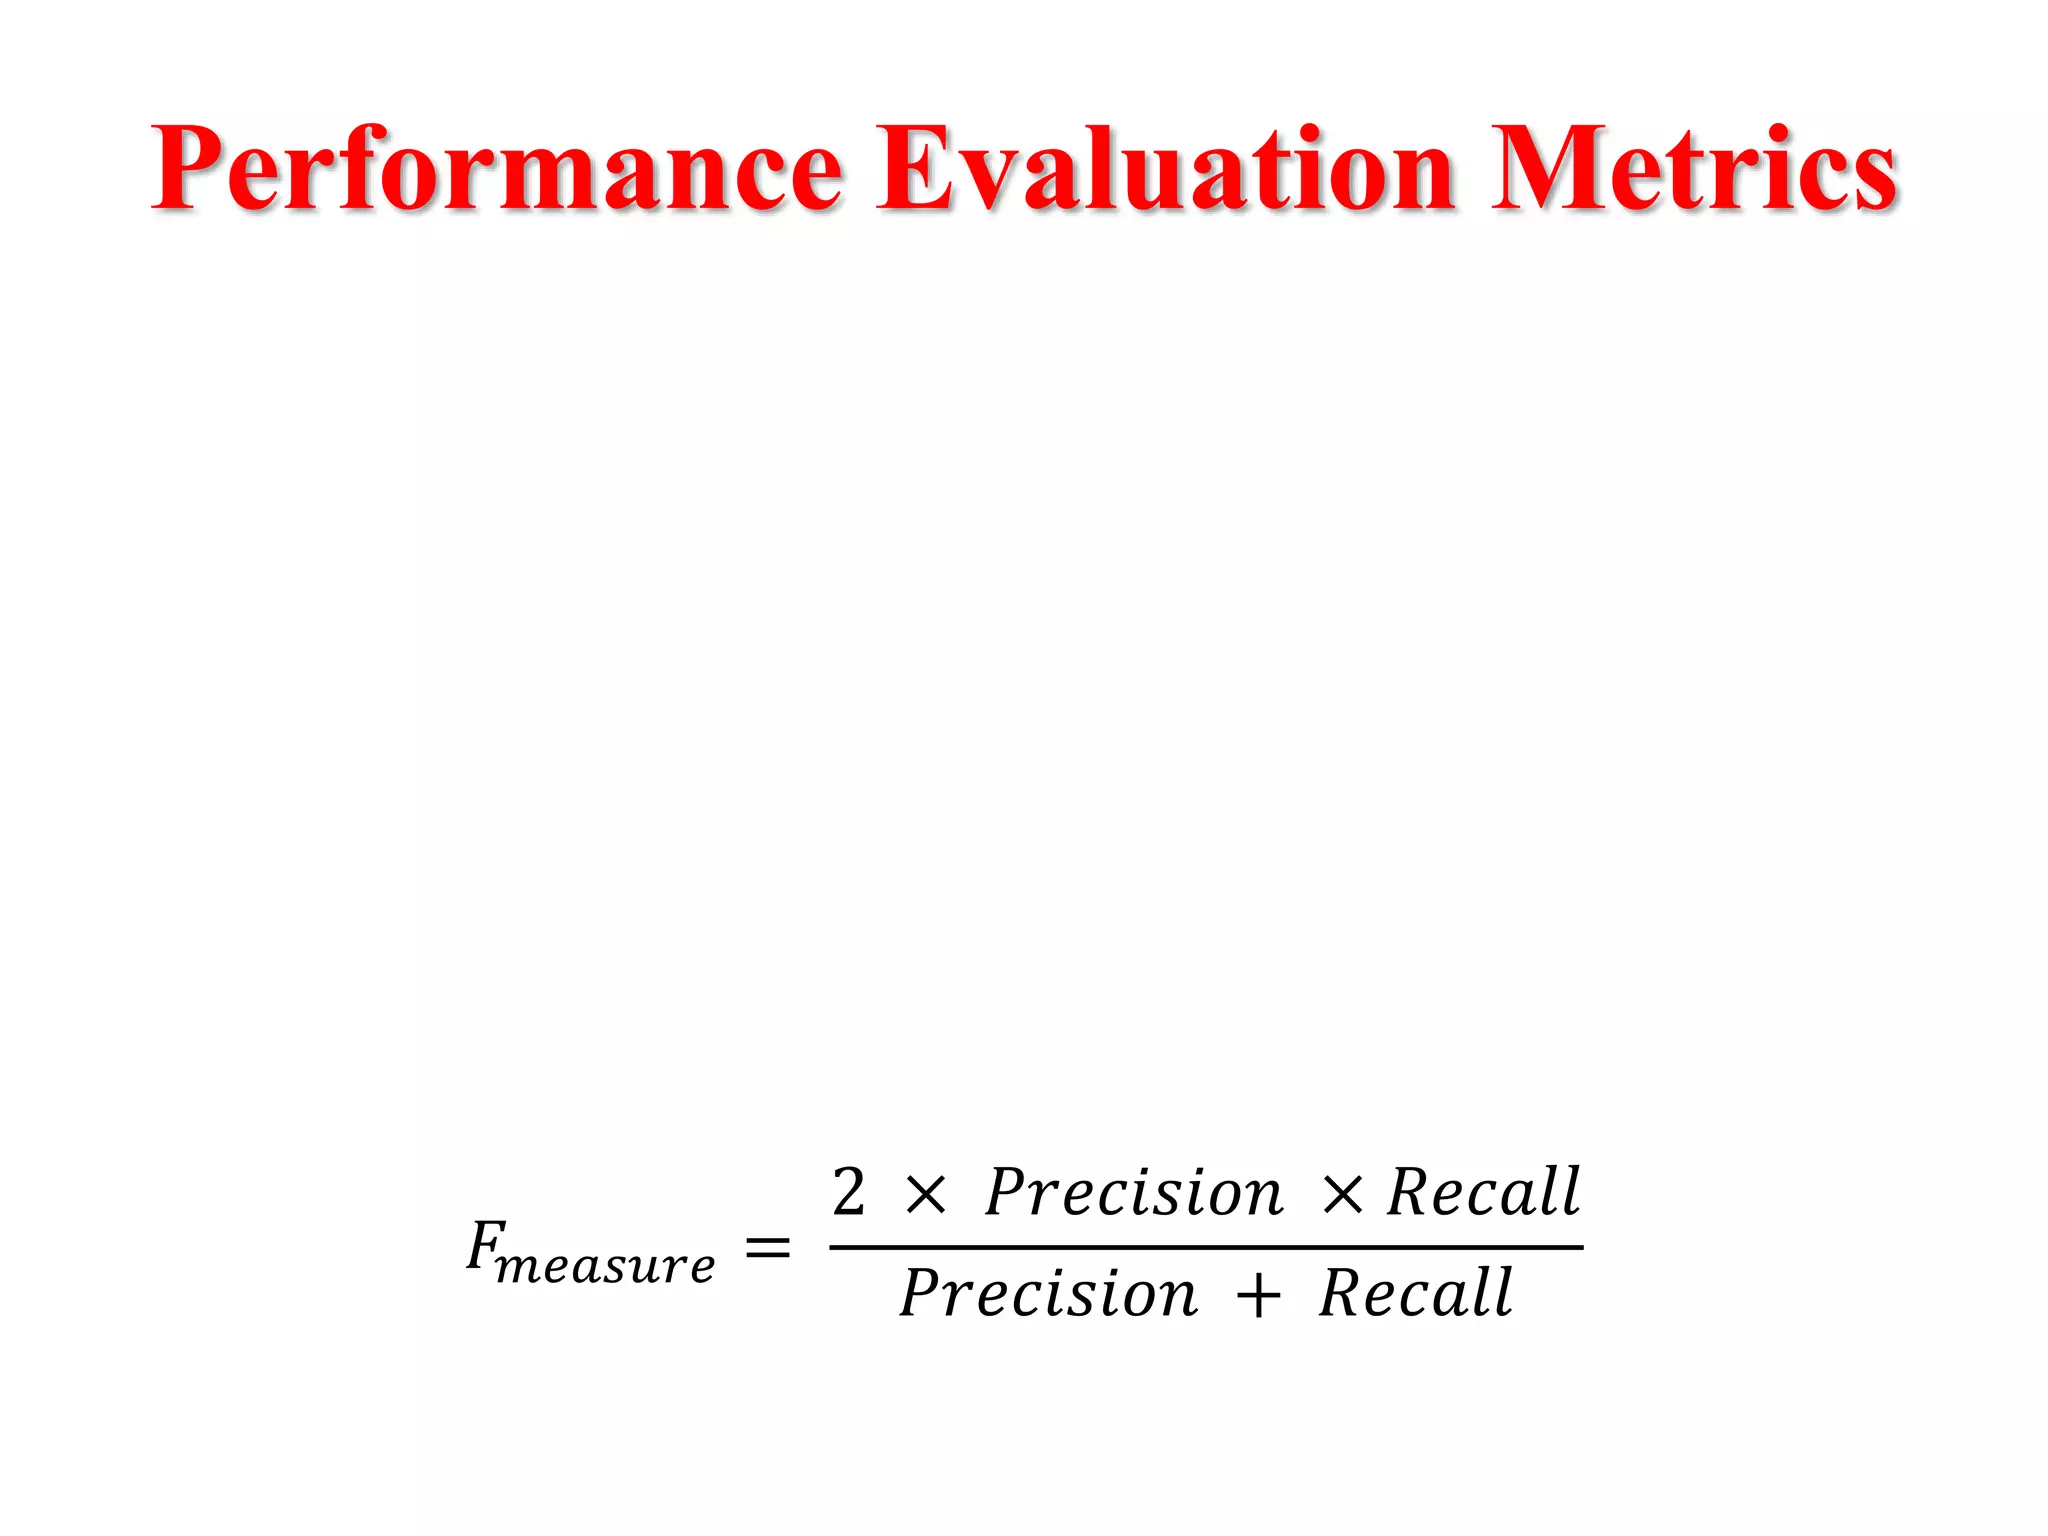
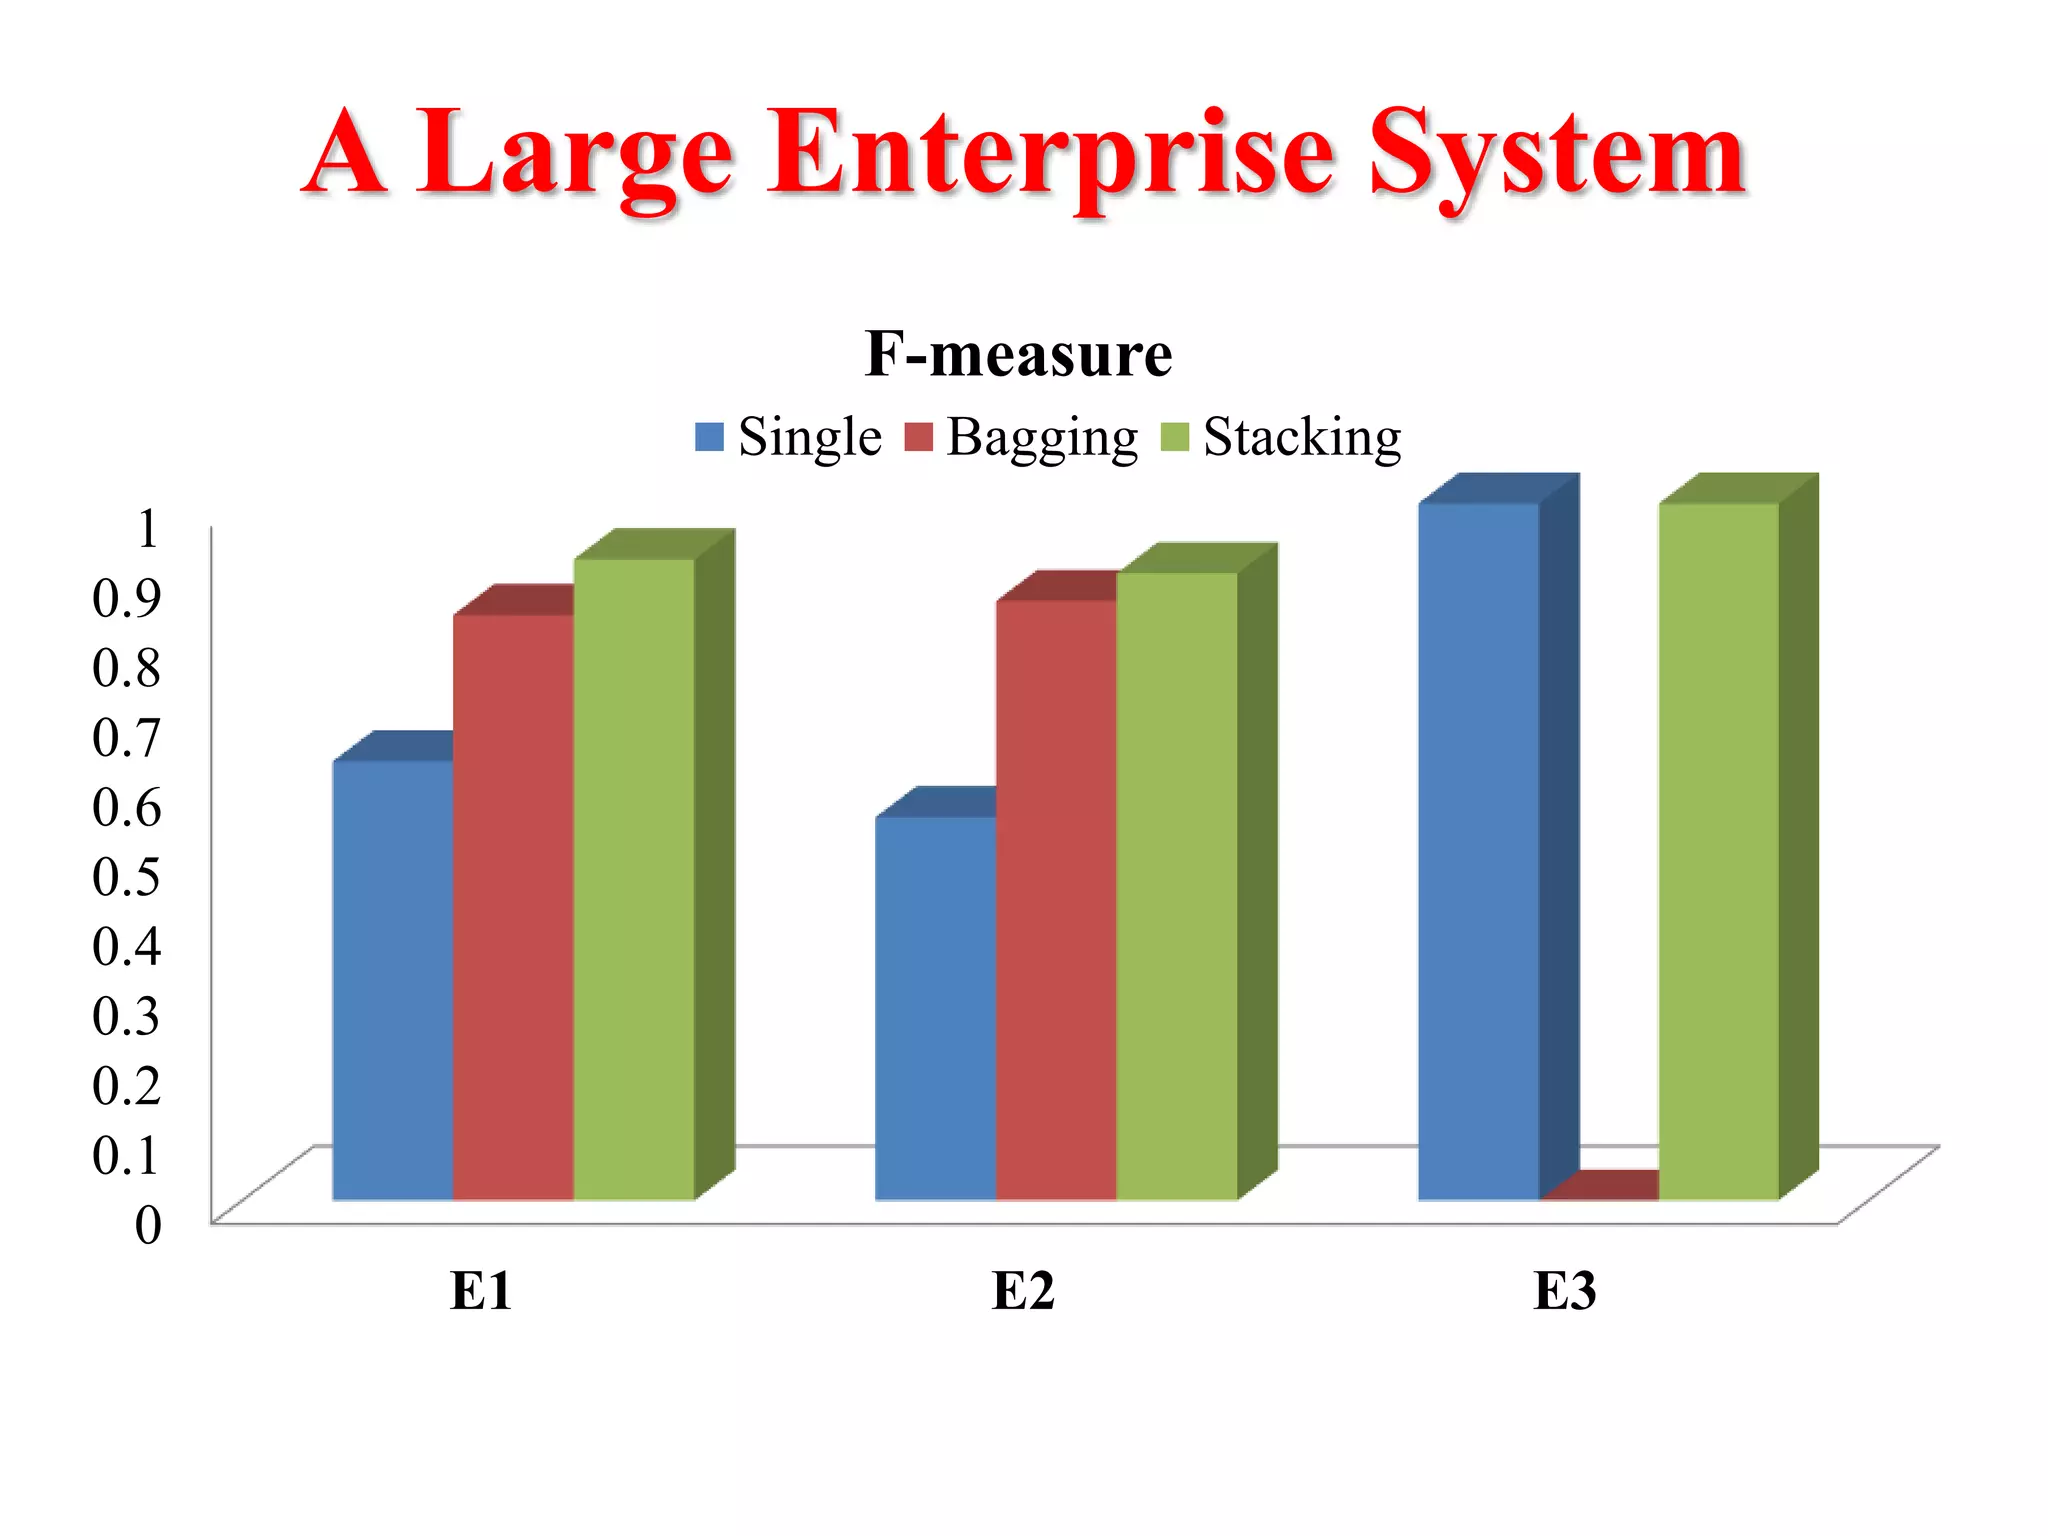
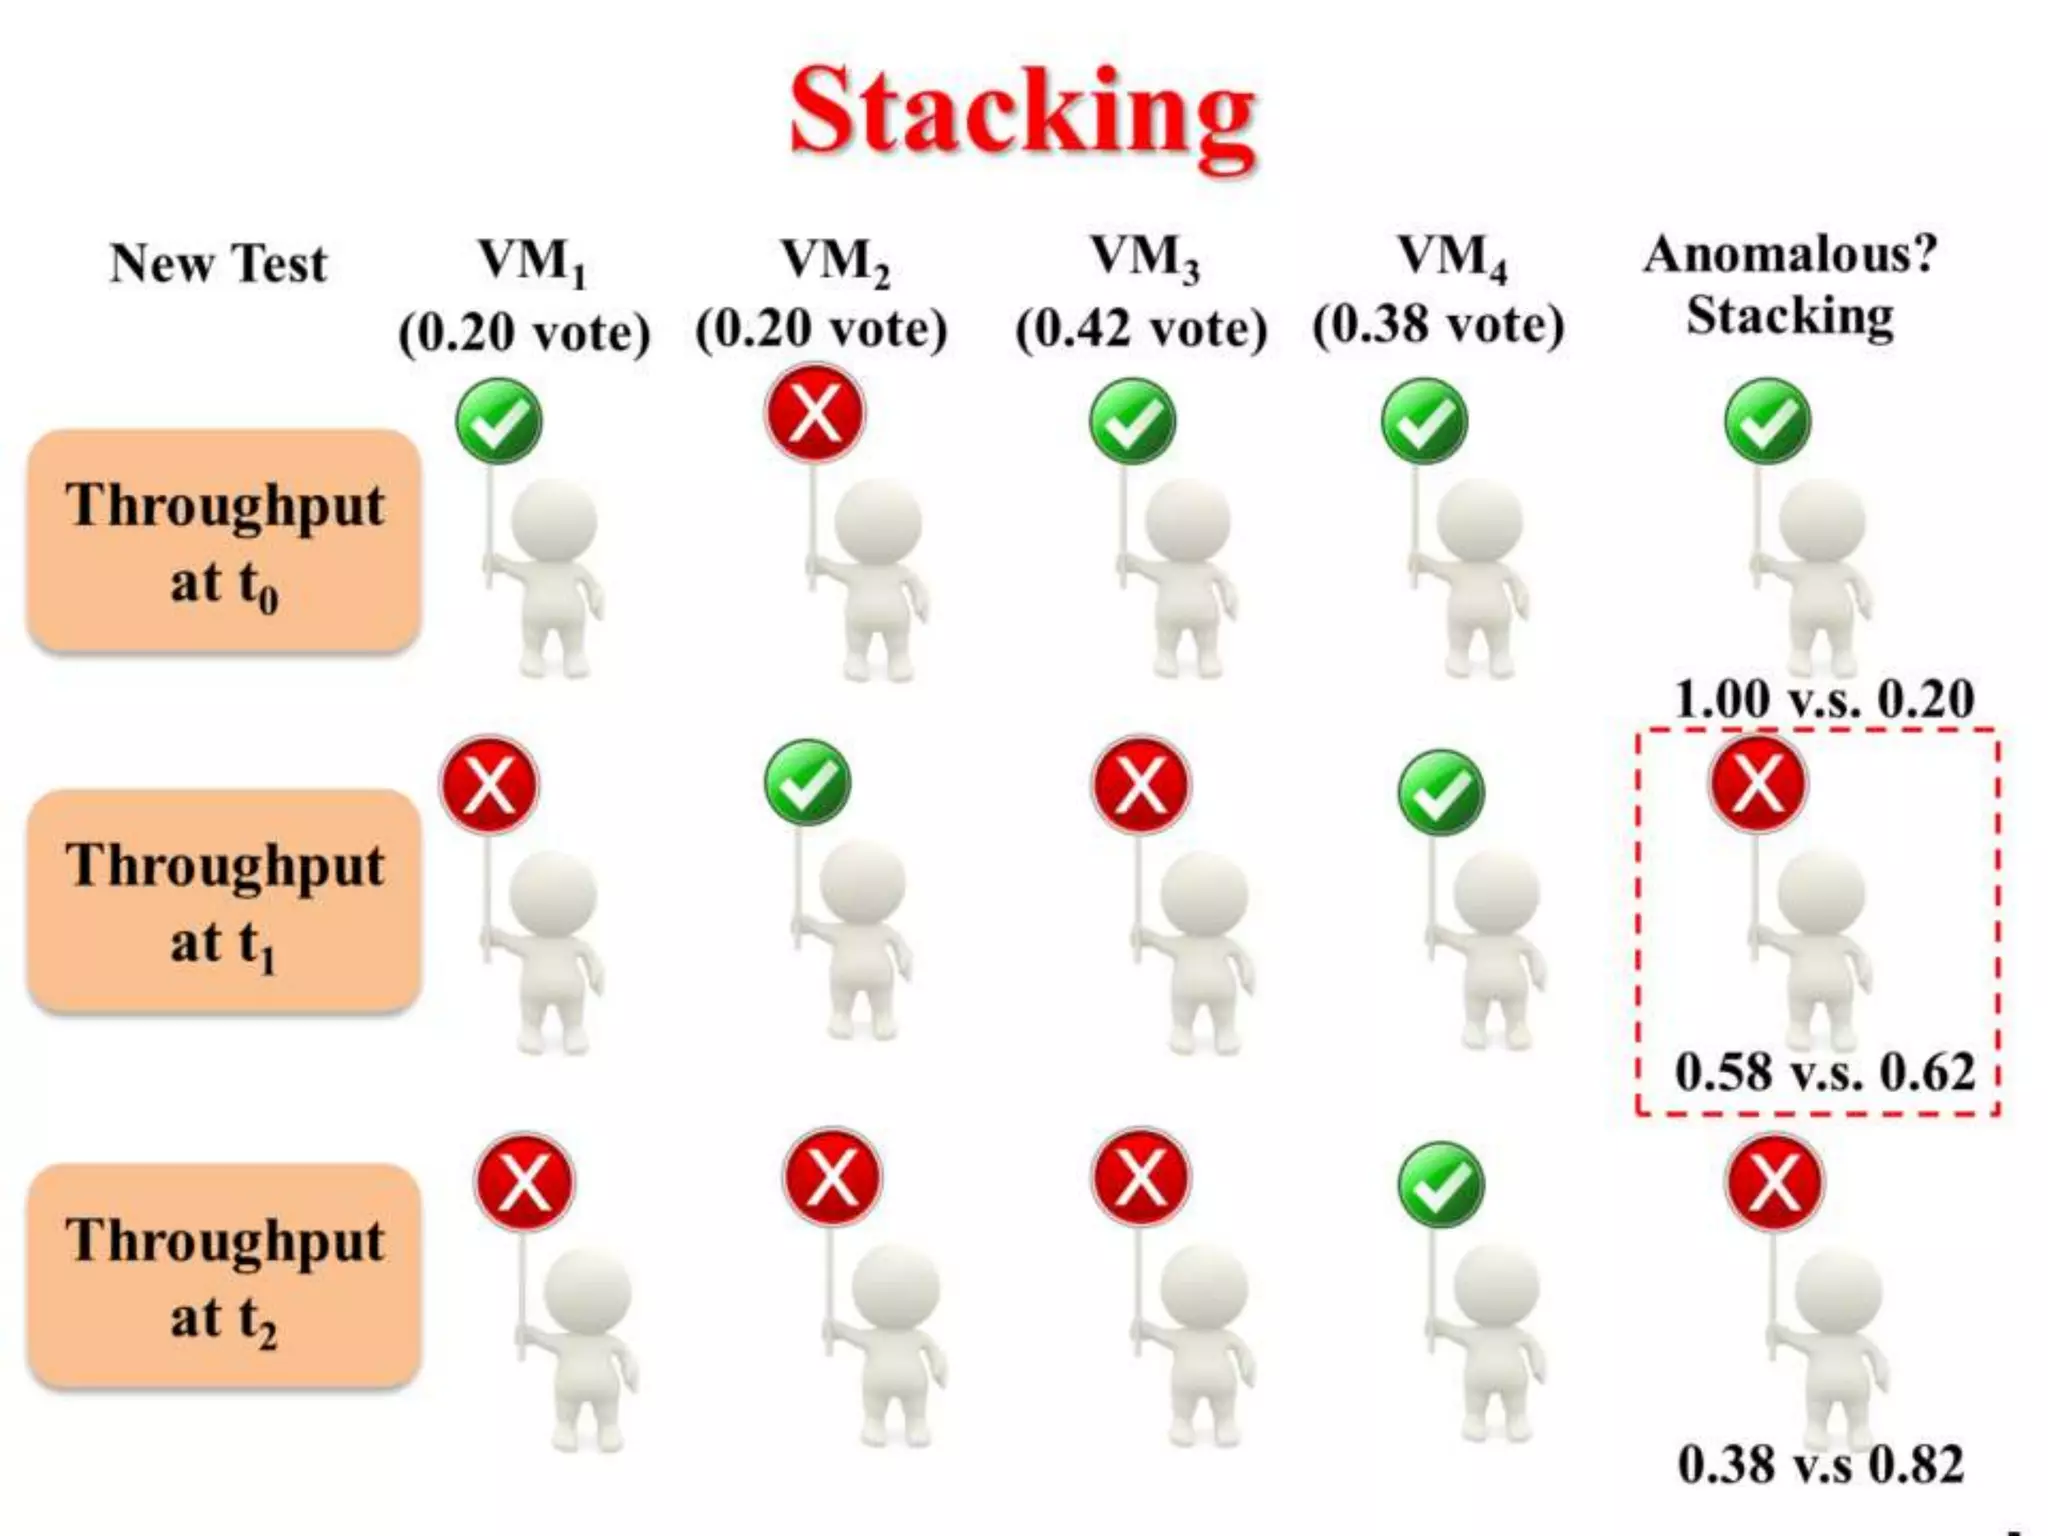
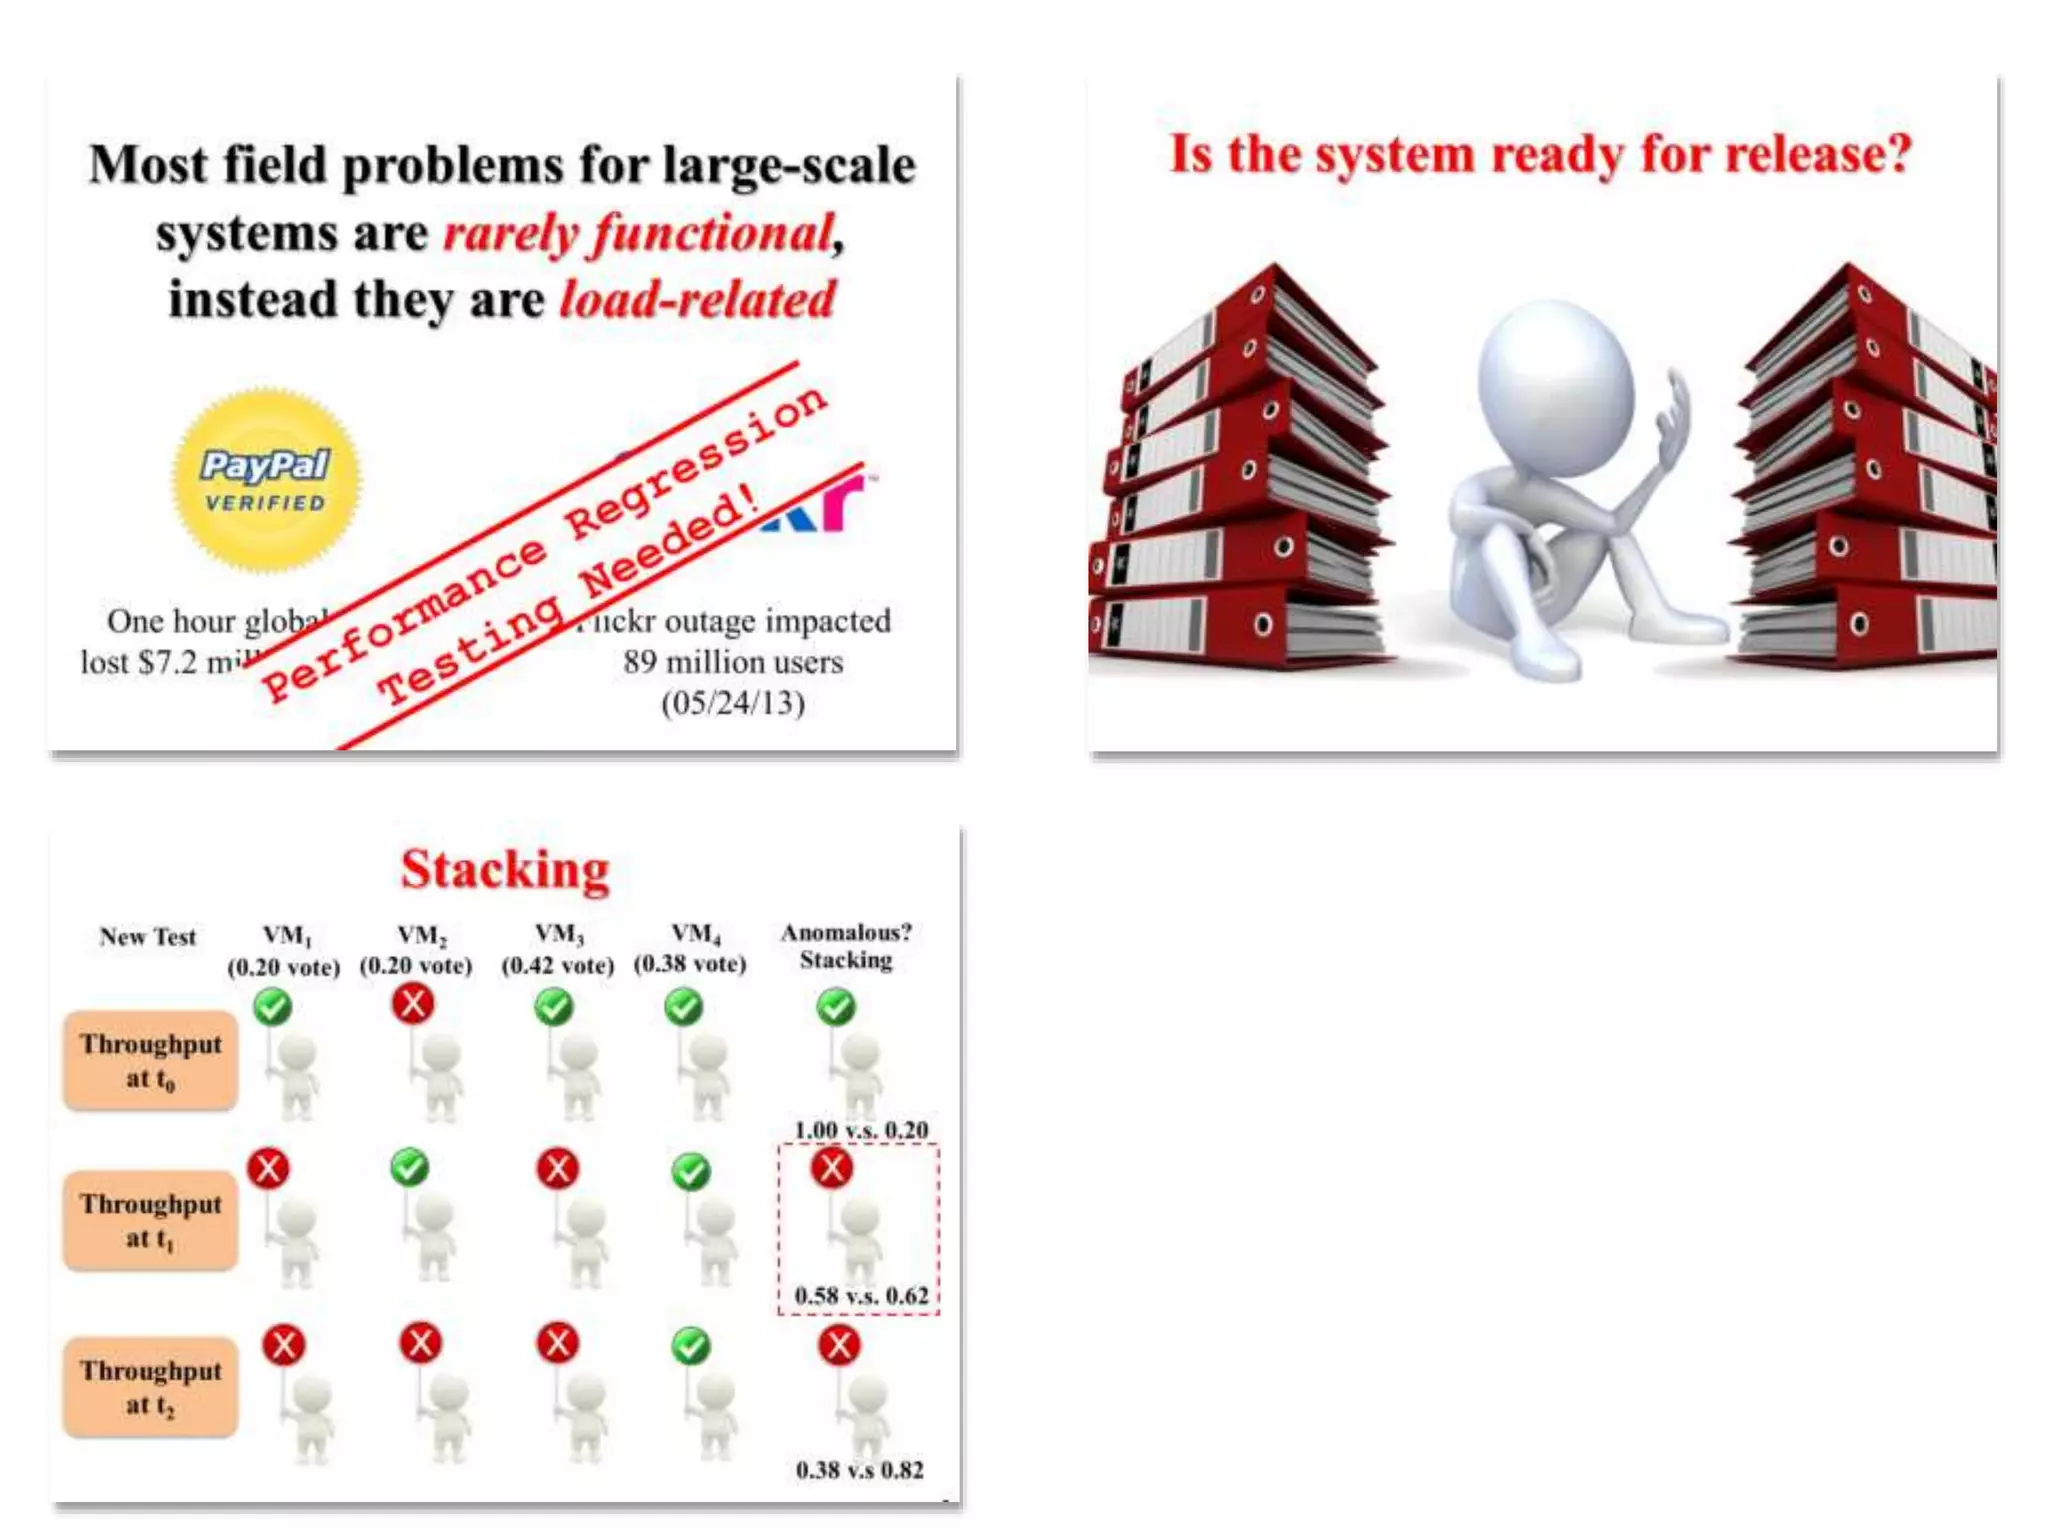
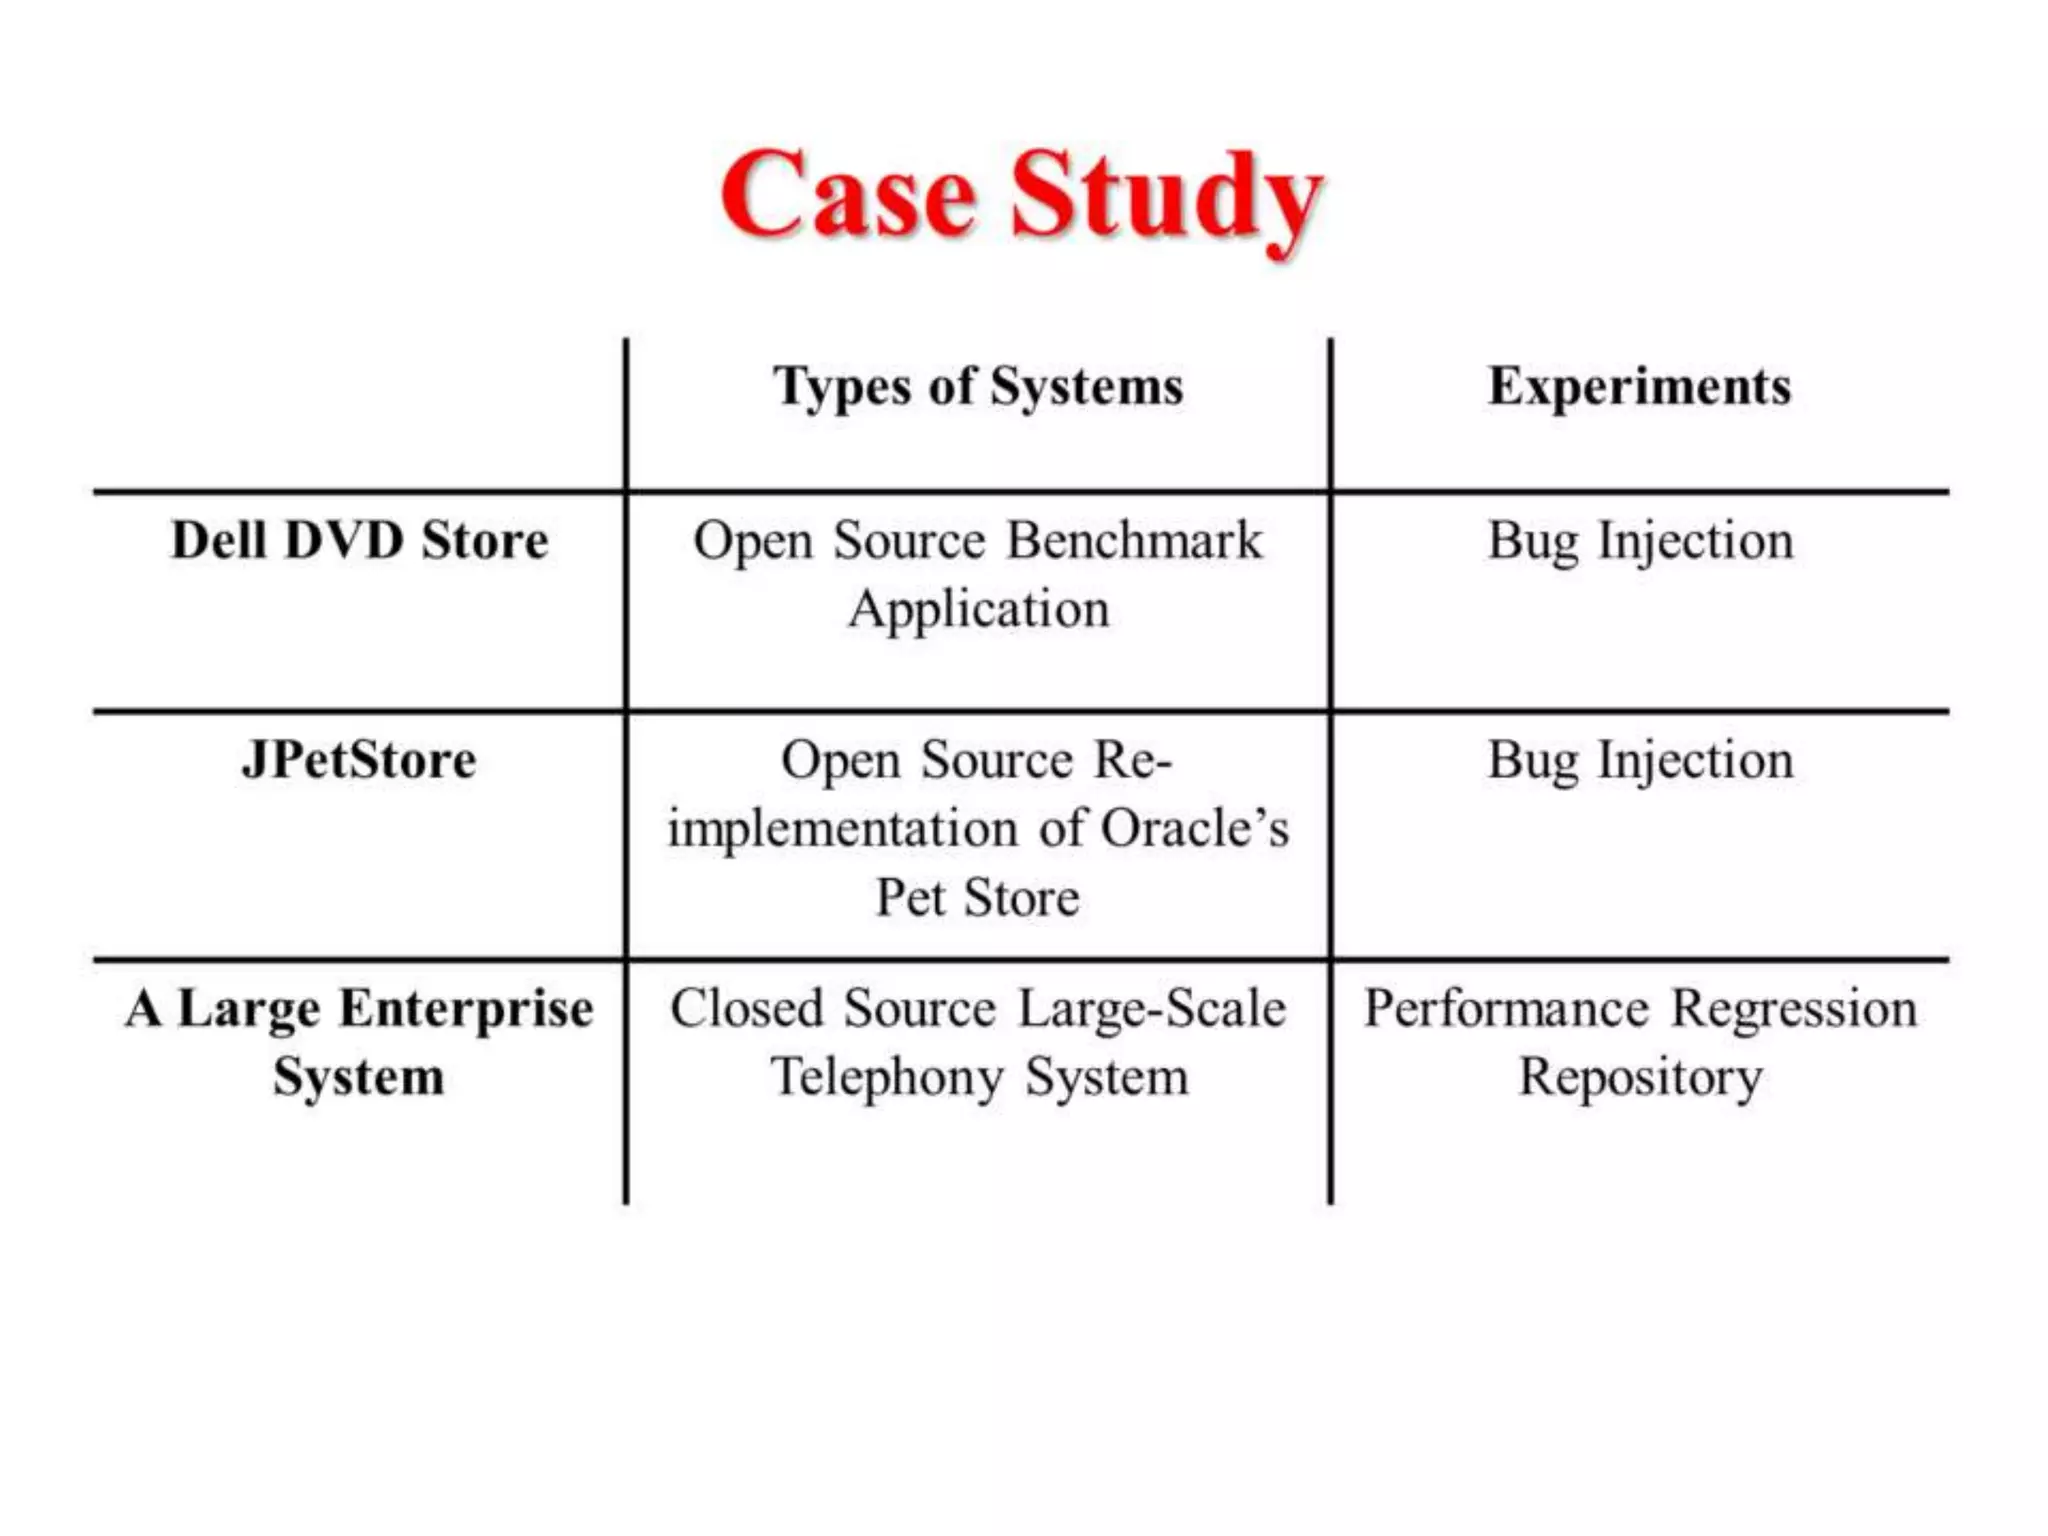
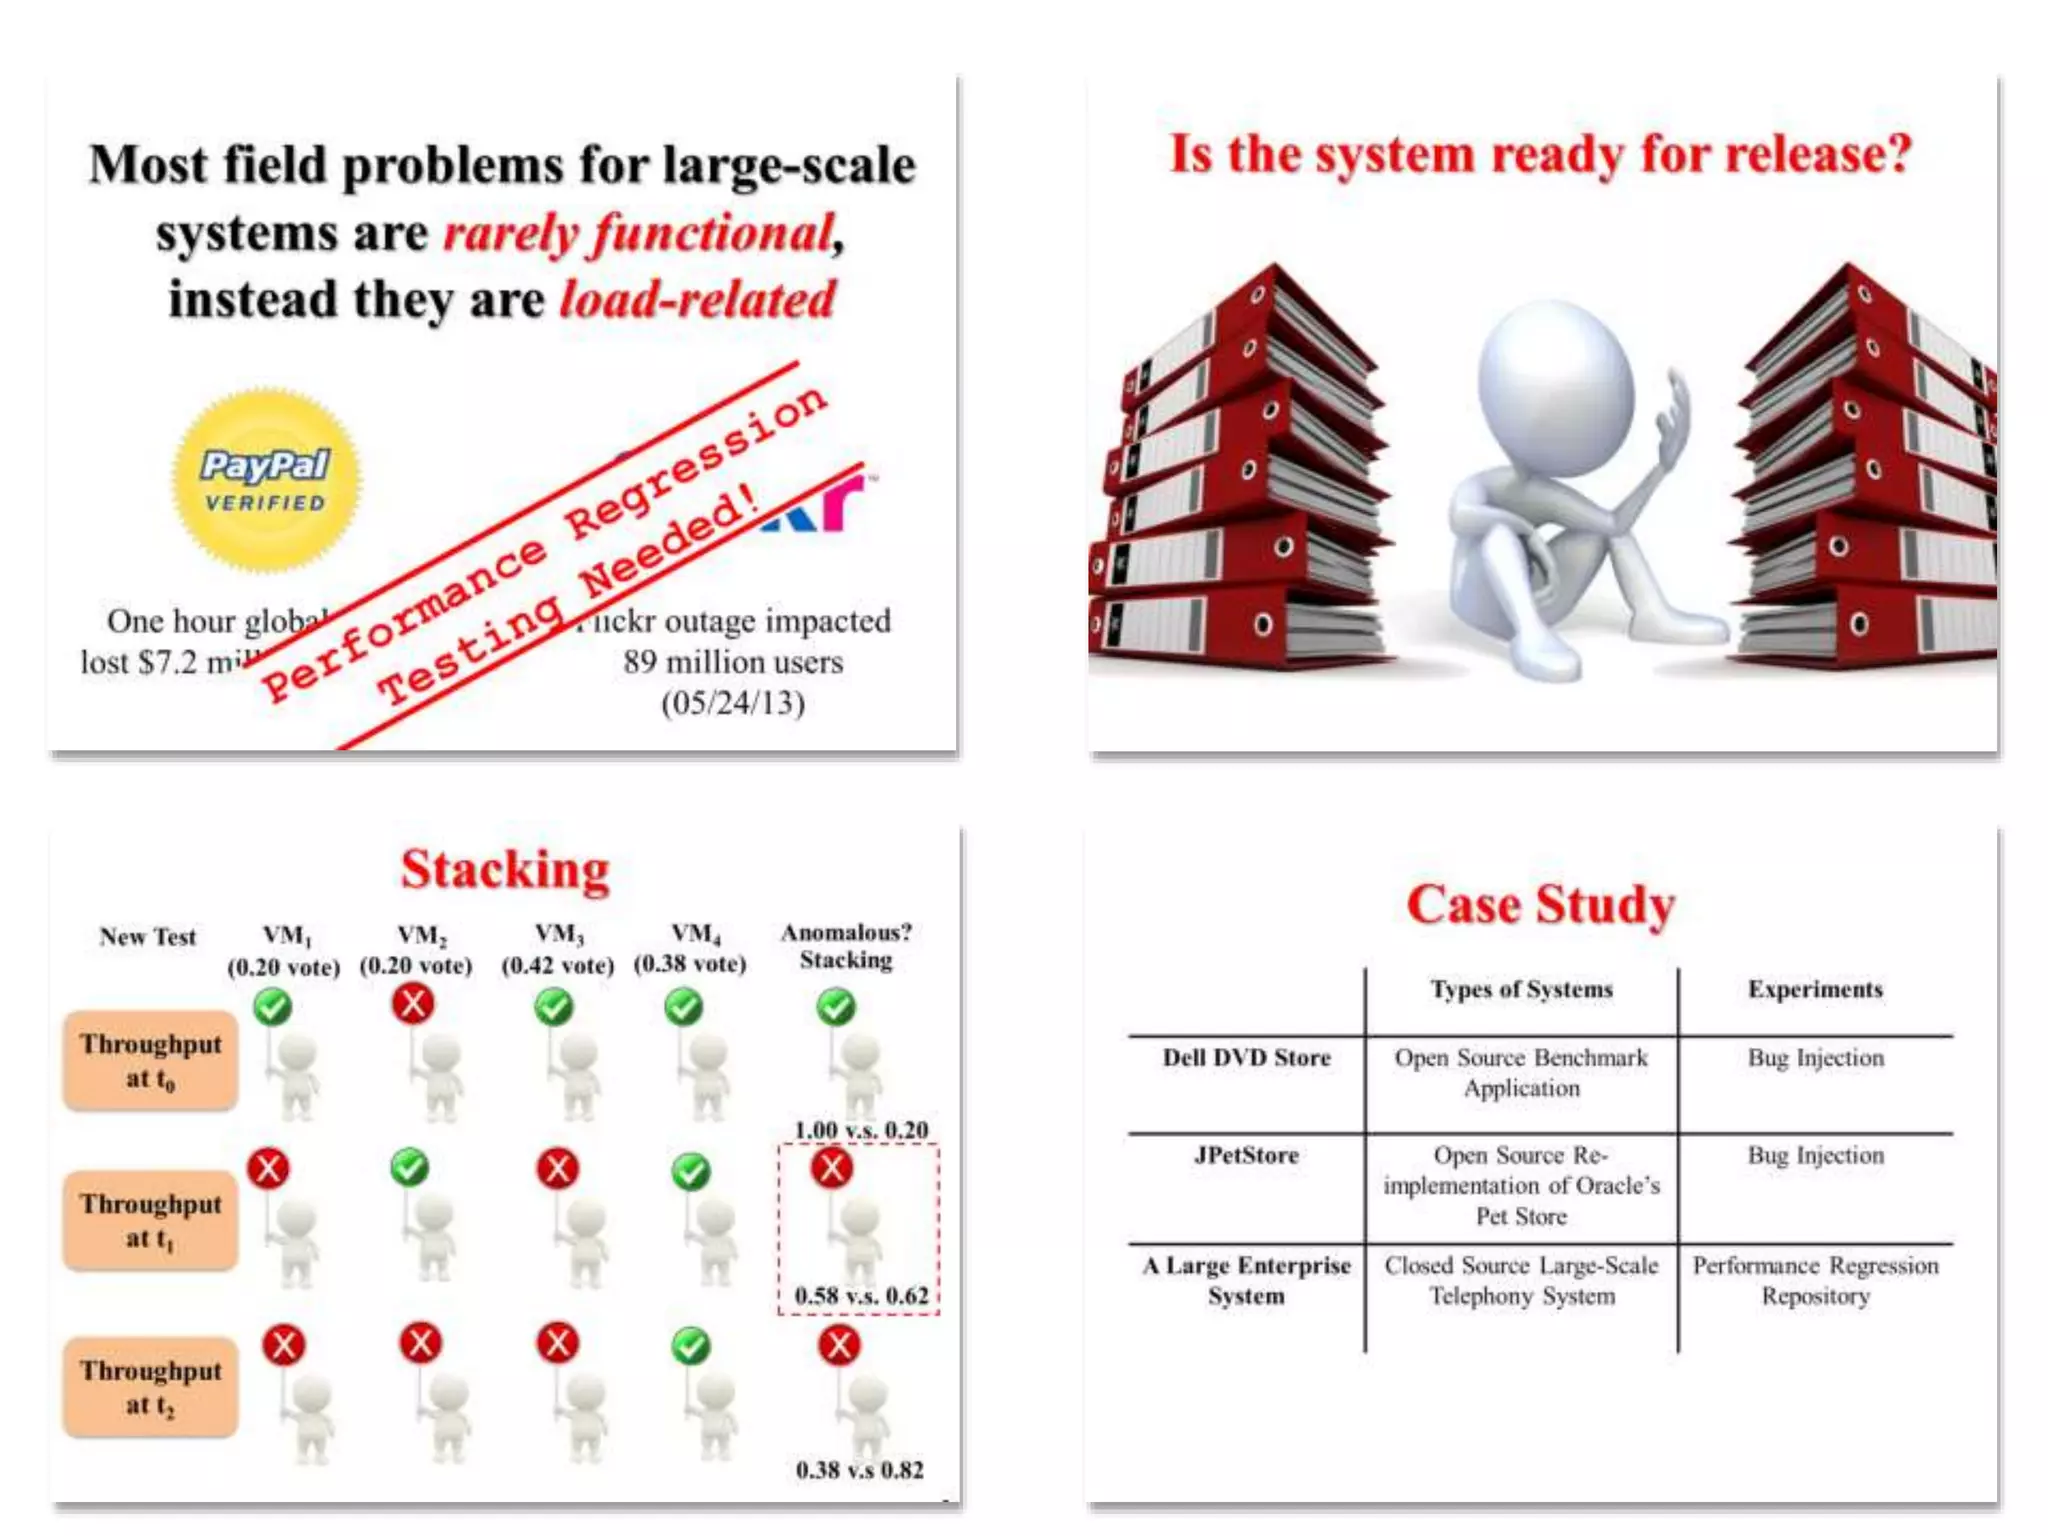
An Industrial Case Study on the Automated
Detection of Performance Regressions
in Heterogeneous Environments
Flickr outage impacted
89 million users
(05/24/13)
Most field problems for large-scale
systems are rarely functional,
instead they are load-related
One hour global outage
lost $7.2 million in revenue
(02/24/09)
Performance Regression Testing
Mimics multiple users repeatedly performing the same tasks
Take hours or even days
Produces GB/TB of data that must be analyzed
Is the system ready for release?
Performance Counters
Performance Regression Report
Initial Attempt
Test N
(tN)
Test 1
(t1)
New Test
(tnew)
.
.
.
Association
Rule Mining
Test 2
(t2)
Perf. Rules
(M)
Detecting
Violation Metric
Violated
Metric Set
(VM)
Heterogeneous Environments
v1.75 v5.10 v1.71 v5.10 v1.71 v5.50
Perf Lab A Perf Lab B Perf Lab C
Test 1 (T1) Test 2 (T2) Test 3 (T3)
Our Approach
Test N
(tN)
Test 1
(t1)
New Test
(tnew)
.
.
.
Association
Rule Mining
Test 2
(t2)
Perf. Rules
(M1)
Perf. Rules
(M2)
Perf. Rules
(MN)
.
.
.
Detecting
Violation Metric
Violated
Metric Set
(VM1)
Violated
Metric Set
(VM2)
Violated
Metric Set
(VMN)
.
.
.
Our Approach
Test N
(tN)
Test 1
(t1)
New Test
(tnew)
.
.
.
Association
Rule Mining
Test 2
(t2)
Perf. Rules
(M1)
Perf. Rules
(M2)
Perf. Rules
(MN)
.
.
.
Detecting
Violation Metric
Violated
Metric Set
(VM1)
Violated
Metric Set
(VM2)
Violated
Metric Set
(VMN)
.
.
.
Our Approach
Rules
1)
Rules
2)
Rules
N)
Detecting
Violation Metric
Violated
Metric Set
(VM1)
Violated
Metric Set
(VM2)
Violated
Metric Set
(VMN)
.
.
.
Ensemble
Learning
.
.
.
Aggregated
Violated
Metric Set
Metric
Time
Small
Medium
Large
Original
Metric
Time
Original
Metric Discretization
• Association rules mining can only operate on
data with discretized values
• Equal Width (EW) interval binning algorithm
Deriving Frequent Itemset from
Past Test # 1
Time DB read/sec Throughput Request Queue Size
10:00 Medium Medium Low
10:03 Medium Medium Low
10:06 Low Medium Medium
10:09 Medium Medium Low
10:12 Medium Medium Low
10:15 Medium Medium Low
Deriving Frequent Itemset from
Past Test # 1
Time DB read/sec Throughput Request Queue Size
10:00 Medium Medium Low
10:03 Medium Medium Low
10:06 Low Medium Medium
10:09 Medium Medium Low
10:12 Medium Medium Low
10:15 Medium Medium Low
Throughput
Medium
DB read/sec
Medium
Request
Queue size
Low
Deriving Performance Rules
from Past Test # 1
Throughput
Medium
DB read/sec
Medium
Request
Queue size
Low
Request
Queue Size
Low
DB read/sec
Medium
Throughput
Medium
Throughput
Medium
Request
Queue Size
Low
DB read/sec
Medium
Throughput
Medium
DB read/sec
Medium
Request
Queue size
Low
Pruning Performance Rules
• Rules with low support and confidence values are pruned
Throughput
Medium
DB read/sec
Medium
Request
Queue size
Low
Premise Consequence
( 0.5 , 0.9 )
(support, confidence)
Web Server
CPU
Medium
DB read/sec
Medium
Web Server
Memory
High
( 0.1 , 0.7 )
Web Server
CPU
Medium
Web Server
Memory
Medium
Throughput
High
( 0.2 , 0.2 )
Detecting Violation Metrics in the
Current Test
Time DB read/sec Throughput Request Queue Size
08:00 Medium Medium High
08:03 Medium Medium High
08:06 Low Medium Medium
08:09 Medium Medium Low
08:12 Medium Medium Low
08:15 Medium Medium High
Throughput
Medium
DB read/sec
Medium
Request
Queue size
Low
Request
Queue size
High
• Rules with significant changes in confidence values are
flagged as “anomalous”
Combining Results
Throughput
at t0
Throughput
at t1
Throughput
at t2
M1 M2 M3 M4 Anomalous?
Stacking(? vote) (? vote) (? vote) (? vote)
New Test
Heterogeneous Lab Environments
v1.71 v5.50 v1.71 v5.10 v1.71 v5.50
Perf Lab A Perf Lab B Perf Lab C
T1, T2 T3 T4
v1.71 v5.50 v1.71 v5.10 v1.71 v5.50
Perf Lab A Perf Lab B Perf Lab C
(CPU, DISK, OS, Java, MySQL)
Measuring Similarities Between Labs
(1, 1, 1, 1, 0)(0, 0, 0, 1, 0) (1, 1, 1, 1, 1)𝟏 = 1 𝟓 = 2.2 𝟒 = 2
T1, T2 T3 T4
v5.50v1.71
v1.71 v5.10v1.71 v5.50 v1.71 v5.50
Perf Lab A Perf Lab B Perf Lab C
Assigning Weights to Past Tests
1 2.2 2
𝒘 𝟏 =
𝟏
𝟏+𝟐.𝟐+𝟐
= 0.20 𝒘 𝟐 =
𝟐.𝟐
𝟏+𝟐.𝟐+𝟐
= 0.42 𝒘 𝟑 =
𝟐
𝟏+𝟐.𝟐+𝟐
= 0.38
T1, T2 T3 T4
0.20 0.42 0.38
Combining Results
Throughput
at t0
Throughput
at t1
Throughput
at t2
M1 M2 M3 M4 Anomalous?
Stacking
1.00 v.s. 0.20
0.38 v.s 0.82
(0.20 vote) (0.20 vote) (0.42 vote) (0.38 vote)
0.58 v.s. 0.62
New Test
Case Study
Types of Systems Experiments
Dell DVD Store Open Source Benchmark
Application
Bug Injection
JPetStore Open Source Re-
implementation of Oracle’s
Pet Store
Bug Injection
A Large Enterprise
System
Closed Source Large-Scale
Telephony System
Performance Regression
Repository
Performance Evaluation Metrics
𝐹𝑚𝑒𝑎𝑠𝑢𝑟𝑒 =
2 × 𝑃𝑟𝑒𝑐𝑖𝑠𝑖𝑜𝑛 × 𝑅𝑒𝑐𝑎𝑙𝑙
𝑃𝑟𝑒𝑐𝑖𝑠𝑖𝑜𝑛 + 𝑅𝑒𝑐𝑎𝑙𝑙
A Large Enterprise System
0
0.1
0.2
0.3
0.4
0.5
0.6
0.7
0.8
0.9
1
E1 E2 E3
F-measure
Single Bagging Stacking
An Industrial Case Study on the Automated Detection of Performance Regressions in Heterogeneous Environments

An Industrial Case Study on the Automated Detection of Performance Regressions in Heterogeneous Environments

  • 1.
    An Industrial CaseStudy on the Automated Detection of Performance Regressions in Heterogeneous Environments
  • 2.
    Flickr outage impacted 89million users (05/24/13) Most field problems for large-scale systems are rarely functional, instead they are load-related One hour global outage lost $7.2 million in revenue (02/24/09)
  • 3.
    Performance Regression Testing Mimicsmultiple users repeatedly performing the same tasks Take hours or even days Produces GB/TB of data that must be analyzed
  • 4.
    Is the systemready for release?
  • 7.
  • 8.
  • 9.
  • 10.
    Initial Attempt Test N (tN) Test1 (t1) New Test (tnew) . . . Association Rule Mining Test 2 (t2) Perf. Rules (M) Detecting Violation Metric Violated Metric Set (VM)
  • 11.
    Heterogeneous Environments v1.75 v5.10v1.71 v5.10 v1.71 v5.50 Perf Lab A Perf Lab B Perf Lab C Test 1 (T1) Test 2 (T2) Test 3 (T3)
  • 12.
    Our Approach Test N (tN) Test1 (t1) New Test (tnew) . . . Association Rule Mining Test 2 (t2) Perf. Rules (M1) Perf. Rules (M2) Perf. Rules (MN) . . . Detecting Violation Metric Violated Metric Set (VM1) Violated Metric Set (VM2) Violated Metric Set (VMN) . . .
  • 13.
    Our Approach Test N (tN) Test1 (t1) New Test (tnew) . . . Association Rule Mining Test 2 (t2) Perf. Rules (M1) Perf. Rules (M2) Perf. Rules (MN) . . . Detecting Violation Metric Violated Metric Set (VM1) Violated Metric Set (VM2) Violated Metric Set (VMN) . . .
  • 14.
    Our Approach Rules 1) Rules 2) Rules N) Detecting Violation Metric Violated MetricSet (VM1) Violated Metric Set (VM2) Violated Metric Set (VMN) . . . Ensemble Learning . . . Aggregated Violated Metric Set
  • 15.
    Metric Time Small Medium Large Original Metric Time Original Metric Discretization • Associationrules mining can only operate on data with discretized values • Equal Width (EW) interval binning algorithm
  • 16.
    Deriving Frequent Itemsetfrom Past Test # 1 Time DB read/sec Throughput Request Queue Size 10:00 Medium Medium Low 10:03 Medium Medium Low 10:06 Low Medium Medium 10:09 Medium Medium Low 10:12 Medium Medium Low 10:15 Medium Medium Low
  • 17.
    Deriving Frequent Itemsetfrom Past Test # 1 Time DB read/sec Throughput Request Queue Size 10:00 Medium Medium Low 10:03 Medium Medium Low 10:06 Low Medium Medium 10:09 Medium Medium Low 10:12 Medium Medium Low 10:15 Medium Medium Low Throughput Medium DB read/sec Medium Request Queue size Low
  • 18.
    Deriving Performance Rules fromPast Test # 1 Throughput Medium DB read/sec Medium Request Queue size Low Request Queue Size Low DB read/sec Medium Throughput Medium Throughput Medium Request Queue Size Low DB read/sec Medium Throughput Medium DB read/sec Medium Request Queue size Low
  • 19.
    Pruning Performance Rules •Rules with low support and confidence values are pruned Throughput Medium DB read/sec Medium Request Queue size Low Premise Consequence ( 0.5 , 0.9 ) (support, confidence) Web Server CPU Medium DB read/sec Medium Web Server Memory High ( 0.1 , 0.7 ) Web Server CPU Medium Web Server Memory Medium Throughput High ( 0.2 , 0.2 )
  • 20.
    Detecting Violation Metricsin the Current Test Time DB read/sec Throughput Request Queue Size 08:00 Medium Medium High 08:03 Medium Medium High 08:06 Low Medium Medium 08:09 Medium Medium Low 08:12 Medium Medium Low 08:15 Medium Medium High Throughput Medium DB read/sec Medium Request Queue size Low
  • 21.
    Detecting Violation Metricsin the Current Test Time DB read/sec Throughput Request Queue Size 08:00 Medium Medium High 08:03 Medium Medium High 08:06 Low Medium Medium 08:09 Medium Medium Low 08:12 Medium Medium Low 08:15 Medium Medium High Throughput Medium DB read/sec Medium Request Queue size Low Request Queue size High • Rules with significant changes in confidence values are flagged as “anomalous”
  • 22.
    Combining Results Throughput at t0 Throughput att1 Throughput at t2 M1 M2 M3 M4 Anomalous? Stacking(? vote) (? vote) (? vote) (? vote) New Test
  • 23.
    Heterogeneous Lab Environments v1.71v5.50 v1.71 v5.10 v1.71 v5.50 Perf Lab A Perf Lab B Perf Lab C T1, T2 T3 T4
  • 24.
    v1.71 v5.50 v1.71v5.10 v1.71 v5.50 Perf Lab A Perf Lab B Perf Lab C (CPU, DISK, OS, Java, MySQL) Measuring Similarities Between Labs (1, 1, 1, 1, 0)(0, 0, 0, 1, 0) (1, 1, 1, 1, 1)𝟏 = 1 𝟓 = 2.2 𝟒 = 2 T1, T2 T3 T4 v5.50v1.71
  • 25.
    v1.71 v5.10v1.71 v5.50v1.71 v5.50 Perf Lab A Perf Lab B Perf Lab C Assigning Weights to Past Tests 1 2.2 2 𝒘 𝟏 = 𝟏 𝟏+𝟐.𝟐+𝟐 = 0.20 𝒘 𝟐 = 𝟐.𝟐 𝟏+𝟐.𝟐+𝟐 = 0.42 𝒘 𝟑 = 𝟐 𝟏+𝟐.𝟐+𝟐 = 0.38 T1, T2 T3 T4 0.20 0.42 0.38
  • 26.
    Combining Results Throughput at t0 Throughput att1 Throughput at t2 M1 M2 M3 M4 Anomalous? Stacking 1.00 v.s. 0.20 0.38 v.s 0.82 (0.20 vote) (0.20 vote) (0.42 vote) (0.38 vote) 0.58 v.s. 0.62 New Test
  • 27.
    Case Study Types ofSystems Experiments Dell DVD Store Open Source Benchmark Application Bug Injection JPetStore Open Source Re- implementation of Oracle’s Pet Store Bug Injection A Large Enterprise System Closed Source Large-Scale Telephony System Performance Regression Repository
  • 28.
    Performance Evaluation Metrics 𝐹𝑚𝑒𝑎𝑠𝑢𝑟𝑒= 2 × 𝑃𝑟𝑒𝑐𝑖𝑠𝑖𝑜𝑛 × 𝑅𝑒𝑐𝑎𝑙𝑙 𝑃𝑟𝑒𝑐𝑖𝑠𝑖𝑜𝑛 + 𝑅𝑒𝑐𝑎𝑙𝑙
  • 29.
    A Large EnterpriseSystem 0 0.1 0.2 0.3 0.4 0.5 0.6 0.7 0.8 0.9 1 E1 E2 E3 F-measure Single Bagging Stacking

Editor's Notes

  • #3 If a system suffers from load-related failures, usually the consequence would result in huge financial losses and impacts large amount of users. Here we show two examples. http://highscalability.com/latency-everywhere-and-it-costs-you-sales-how-crush-it http://www.infoworld.com/slideshow/107783/the-worst-cloud-outages-of-2013-so-far-221831 http://techcrunch.com/2013/05/24/flickr-suffers-outage-four-days-after-major-revamp/
  • #4 Load testing in general assess the system behavior under load to detect load-related problems. This figure illustrates a typical setup of a load test …
  • #5 The question facing load testing professionals every day is: “So is the system ready for release”? How do we dig through these data to find out problems?
  • #6 Mention NO TEST ORACLE! Current practices is ad-hoc and involve many high-level checks Why costly? (many human hours for manually checking the data) Mainly reply on manual (time consuming and error-prone) approaches for analyzing performance regression tests Relay mainly on domain knowledge and the results of prior test runs to manually look for large deviations of counter values (e.g., high CPU) Organizations currently maintain different lab environments to execute performance There are benchmarks for CPU (e.g., SPEC) to map and compare CPU utilizations among different configurations. But not for other types of resources
  • #7 Can we automate these kind of manual analysis or maybe even perform deeper analysis? As one of my colleagues always said, “let the machines work harder, so that our humans don’t”
  • #8 Typically a timer series like data (periodically sampling data: can be a snapshot, can be an average, or can aggregate [e.g. total number of packets received]) They are usually resource usage or system level metrics (e.g., # of input/output requests). Lots of counters and follows different trend over time
  • #9 We had come up with an approach which mines previous past data to flag anomalous performance behavior in the current test. This is an example of the resulting perf regression report. This kind of report are interactive html files, which can be zipped and sent to developers for future investigation. Severity is marked by # of violation periods
  • #12 To make matters worse, some of these differences could be unintentional (e.g., due to automated updates in software systems). Hence, some of these changes can be unnoticed.
  • #16 Before discretization, we also need to do normalization Machines in different labs have different names, leading to variations of metric names: \\DB1\Process(_Total)\%Processor Time \\DB2\Process(_Total)\%Processor Time These variations are normalized: \\DB\Process(_Total)\%Processor Time
  • #19 The probability with which an association rule holds can be characterized by its support and confidence measures. Support measures the ratio of times the rule holds (i.e., counters in the premise and consequent are observed together with the specified values). Low support means that the association rules may have been found simply due to chance. Confidence measures the probability that the rule’s premise leads to the consequent (i.e., how often the consequent holds when the premise does). Min support = 0.3 Confidence = 0.9
  • #20 The probability with which an association rule holds can be characterized by its support and confidence measures. Support measures the ratio of times the rule holds (i.e., counters in the premise and consequent are observed together with the specified values). Low support means that the association rules may have been found simply due to chance. Confidence measures the probability that the rule’s premise leads to the consequent (i.e., how often the consequent holds when the premise does). Min support = 0.3 Confidence = 0.9
  • #23 Stacking Similar to bagging but uses Weighted Majority Voting The weight of each rule set is defined by how similar the prior test that is used to generate the particular rule set is to the new test in terms of software and hardware configurations. The closer the configurations, the heavier the weight will be for a particular rule set
  • #24 SIW System Information for Windows (SIWInfo) is the tool for getting all the software and hardware configuration information
  • #25 SIW System Information for Windows (SIWInfo) is the tool for getting all the software and hardware configuration information
  • #26 SIW System Information for Windows (SIWInfo) is the tool for getting all the software and hardware configuration information
  • #27 Stacking Similar to bagging but uses Weighted Majority Voting The weight of each rule set is defined by how similar the prior test that is used to generate the particular rule set is to the new test in terms of software and hardware configurations. The closer the configurations, the heavier the weight will be for a particular rule set
  • #30 Each of these are 8-hrs long with more than 2000 counters collected. => Some of the analysts issues are good comments. They might have wrong comments or missing issues. In E1, we have found that total 13 counters (out of 2000) has issues, which are not flagged by performance analysts. Our original approach flags 6 counters (6/13). Bagging shows 18 counters (13/18). Stacking flags 13 counters (7 common with original, 2 are false positive) => 11/13 For E2, we have flagged 15 unique counters with true performance regressions. Original 6/7 flagged counters are good. Bagging has flagged 15/20 flagged counters are good (rest of 15 are all good). Stacking flagged 14 counters, 13/14 are good. For E3, the DB transaction rate is within the historical rate. Hence, we did not consider this as a problem. Both single and stacking shows that there is no problem. However, bagging flags 8 counters, which are all bad (e.g., slightly higher workload, but within historical ranges)
  • #38 Q/A: Why not VMs? VMs’ performance can fluctuate due to “noisy neighbors”. Swipe recently moved from Amzon’s EC2 to real-hardware due to its headache. http://highscalability.com/blog/2015/3/16/how-and-why-swiftype-moved-from-ec2-to-real-hardware.html