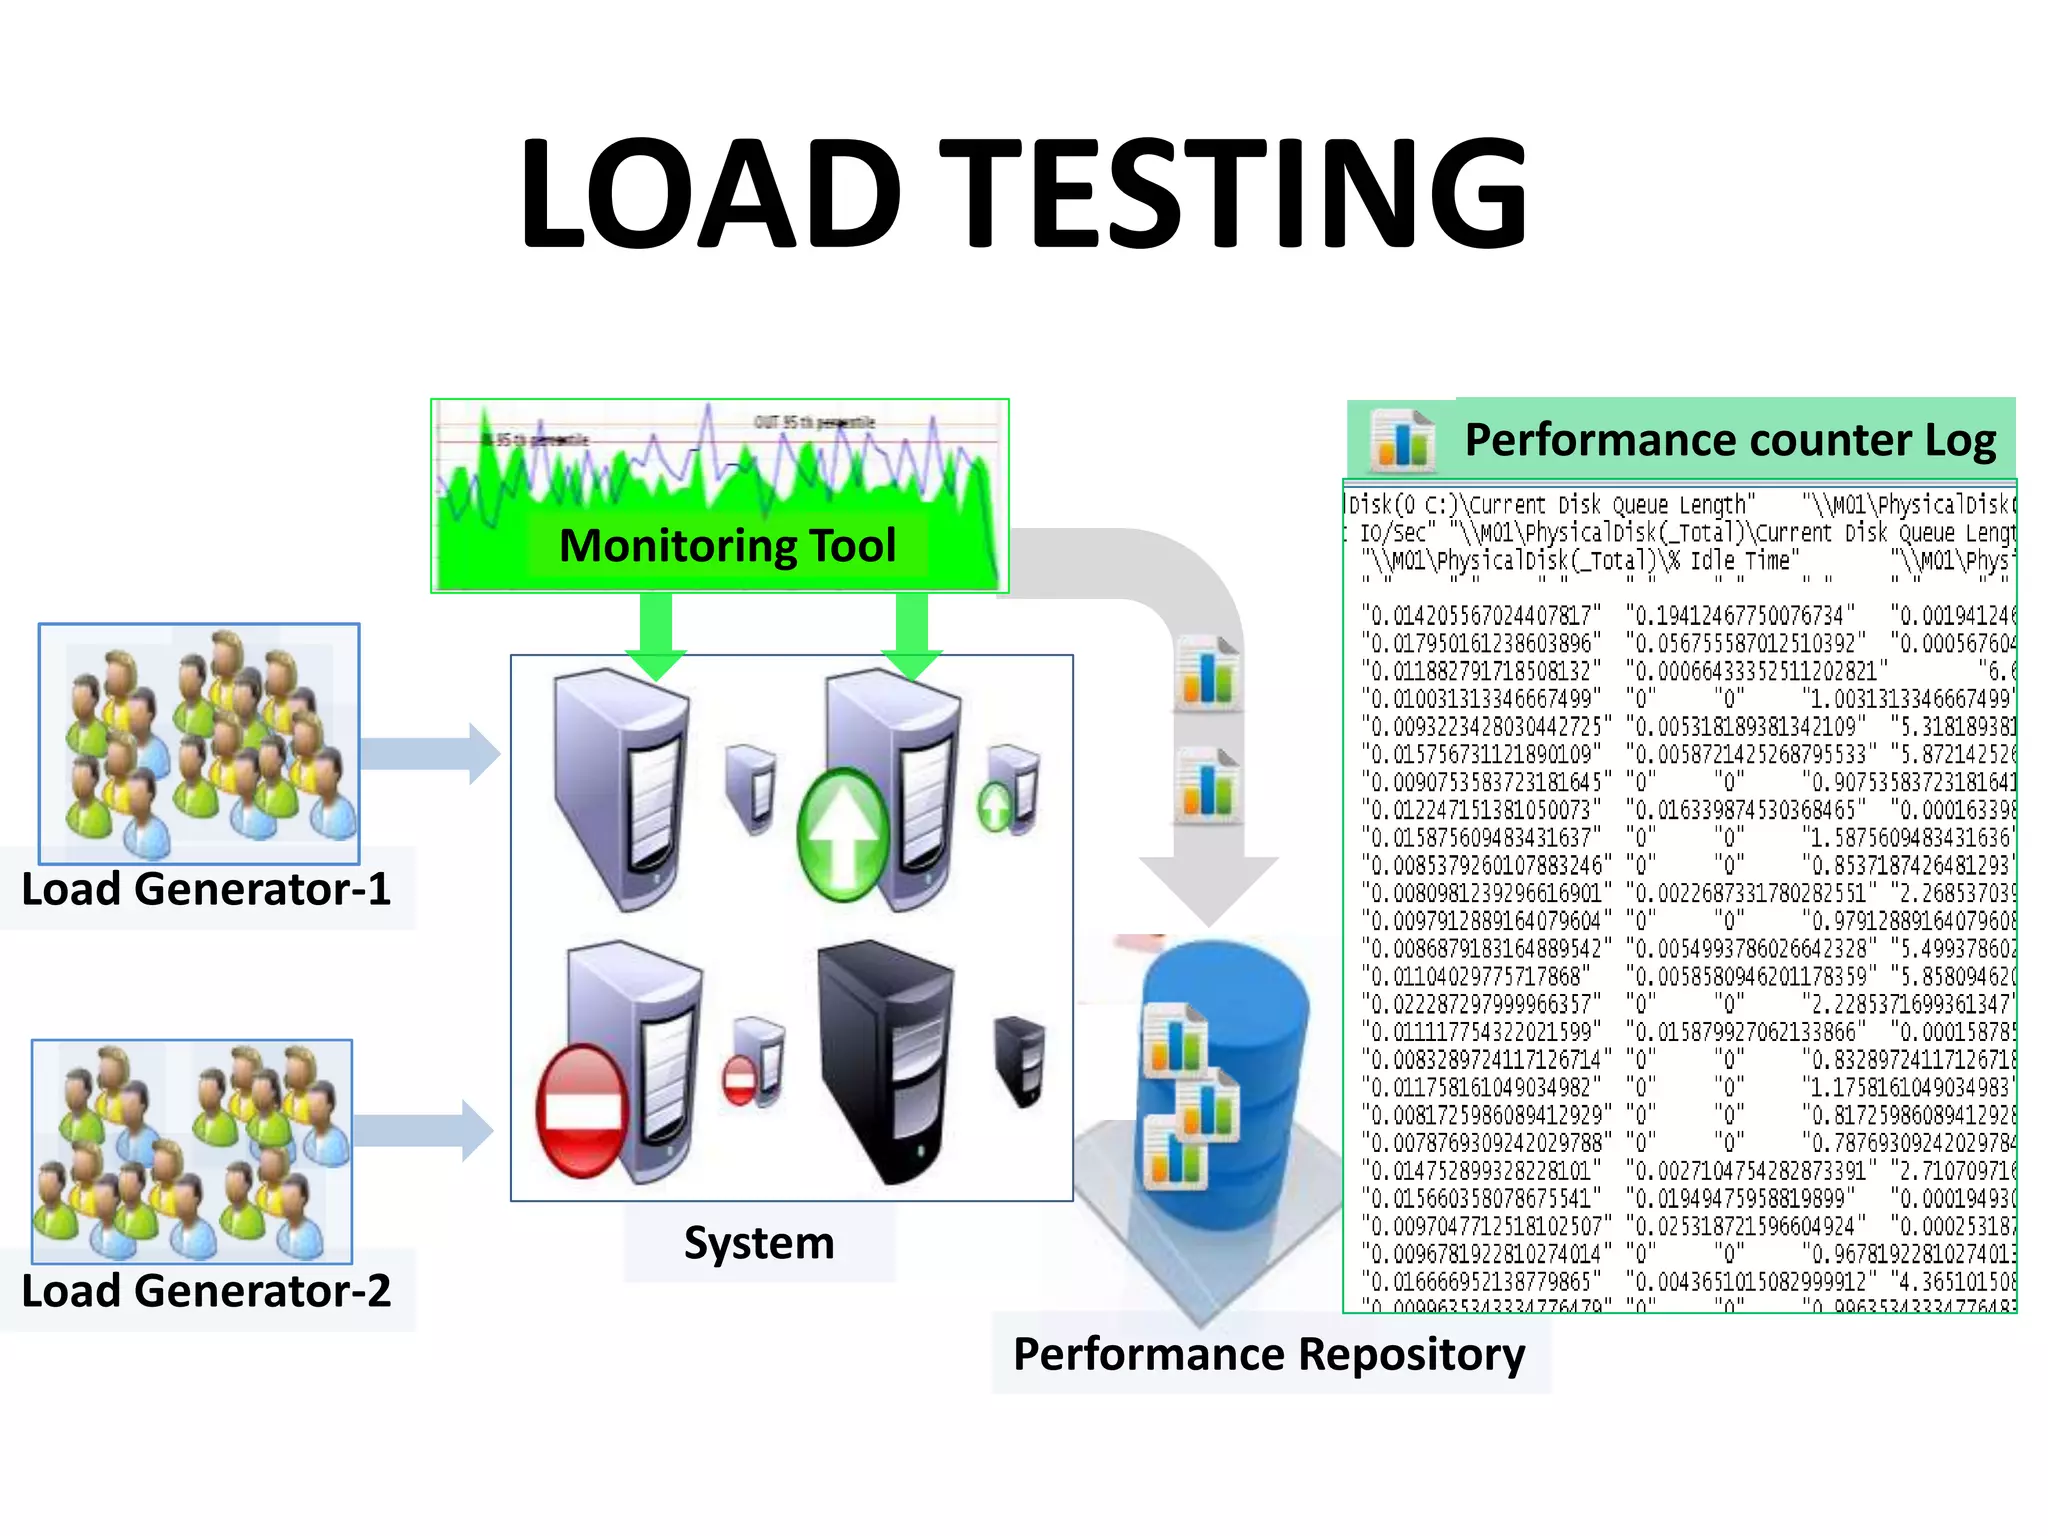
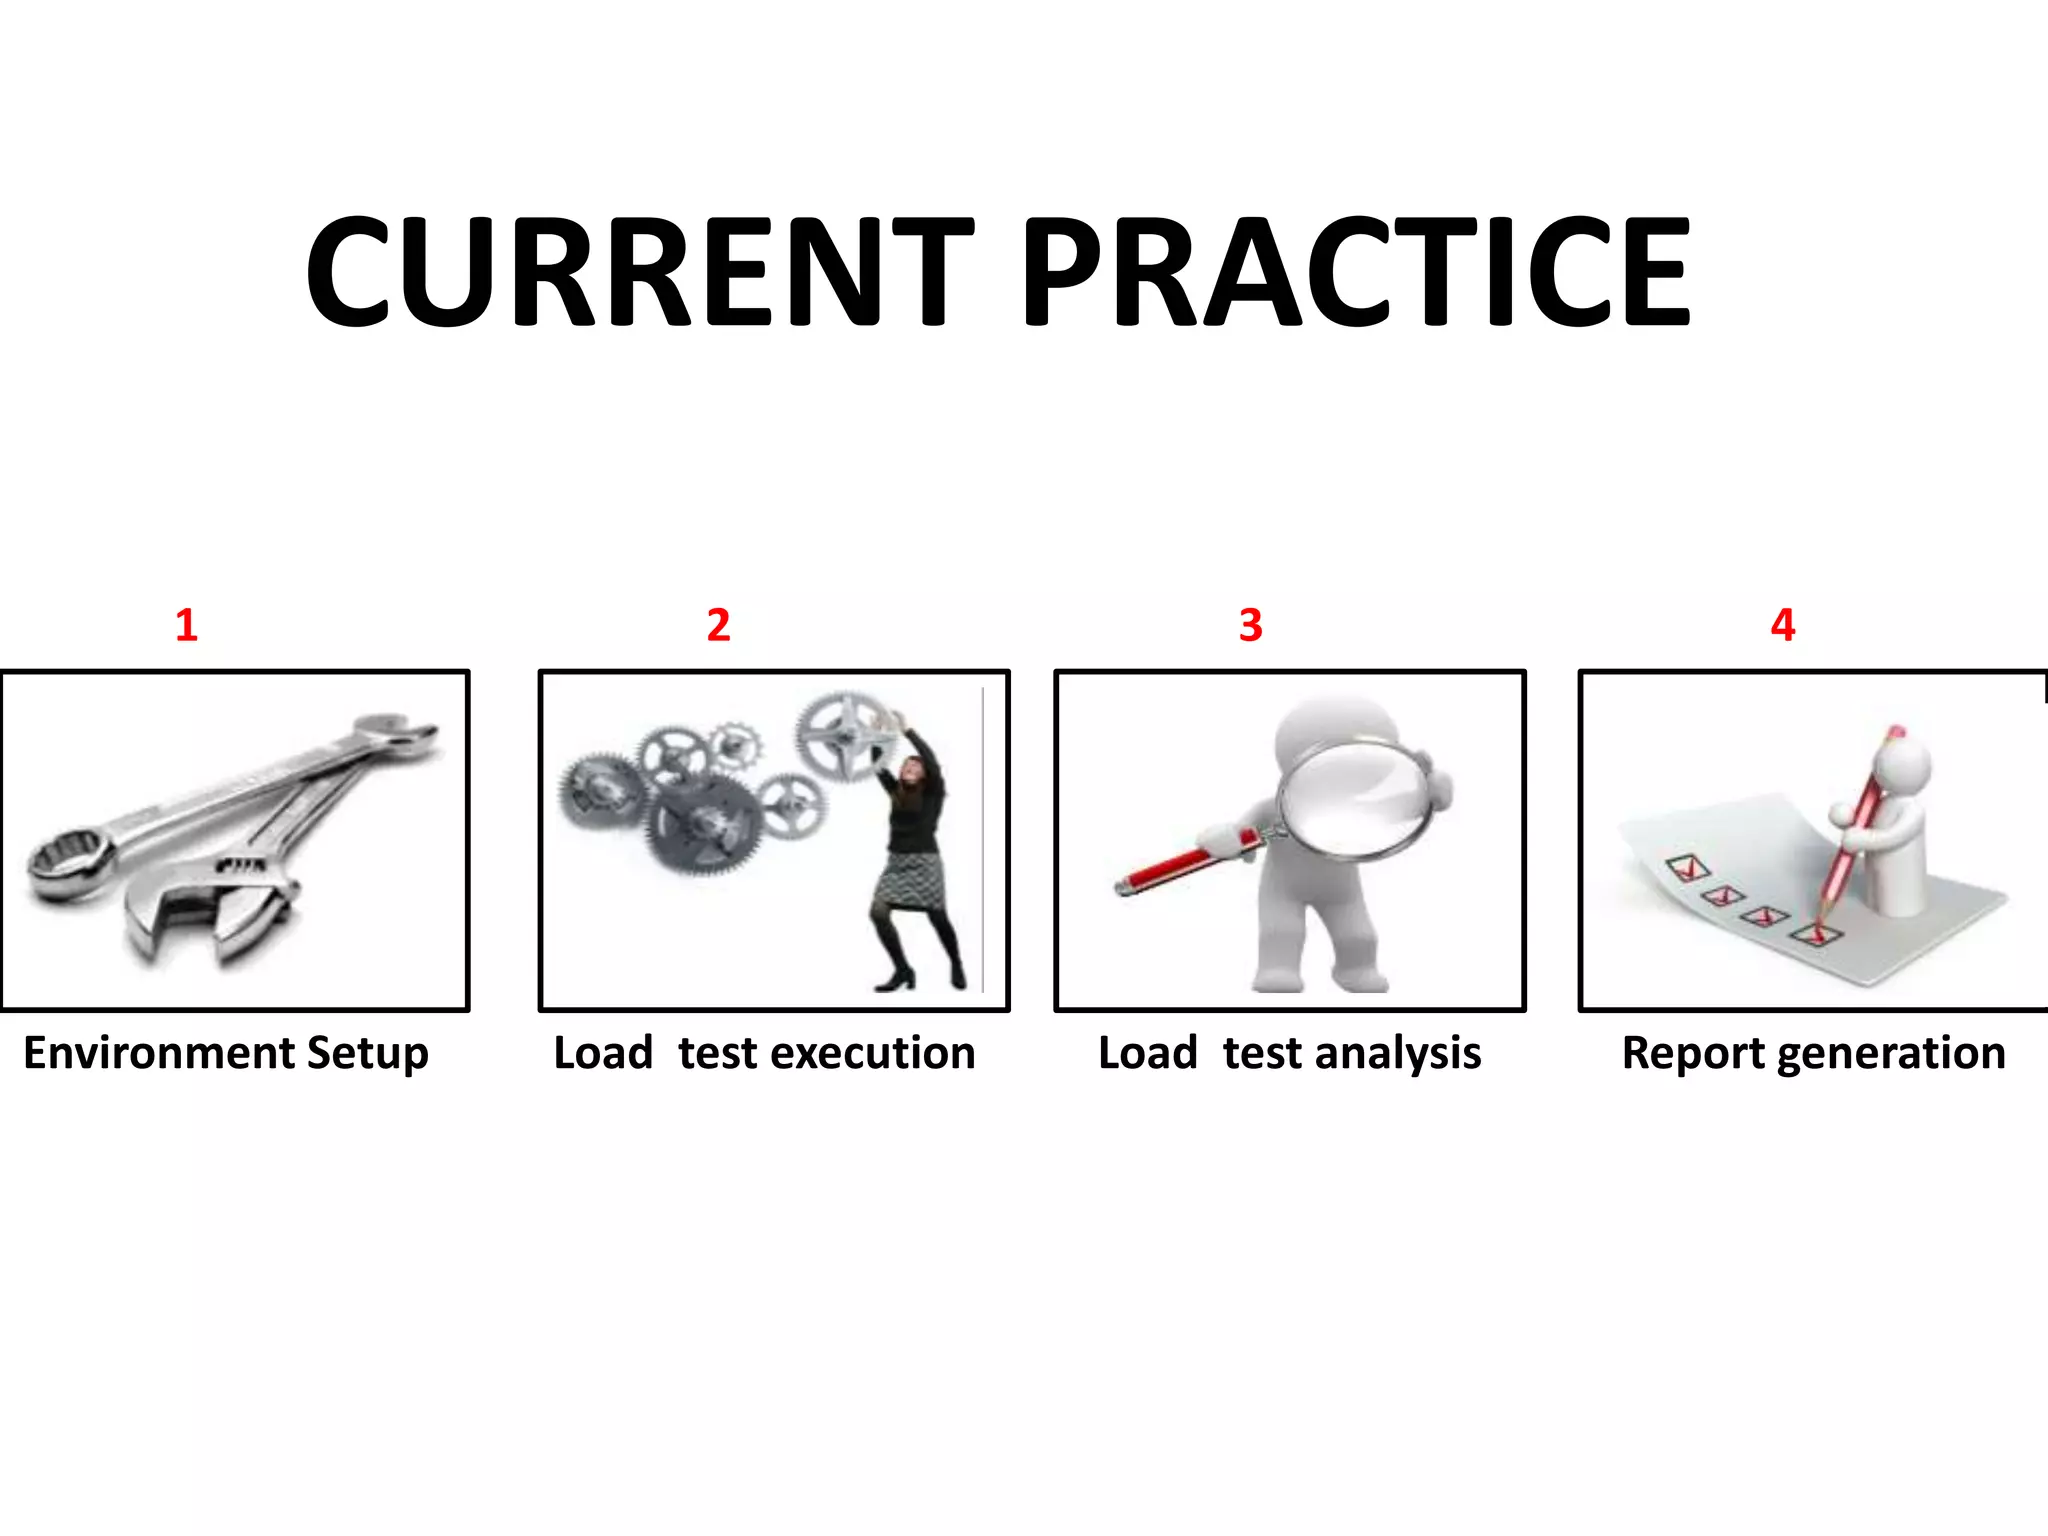
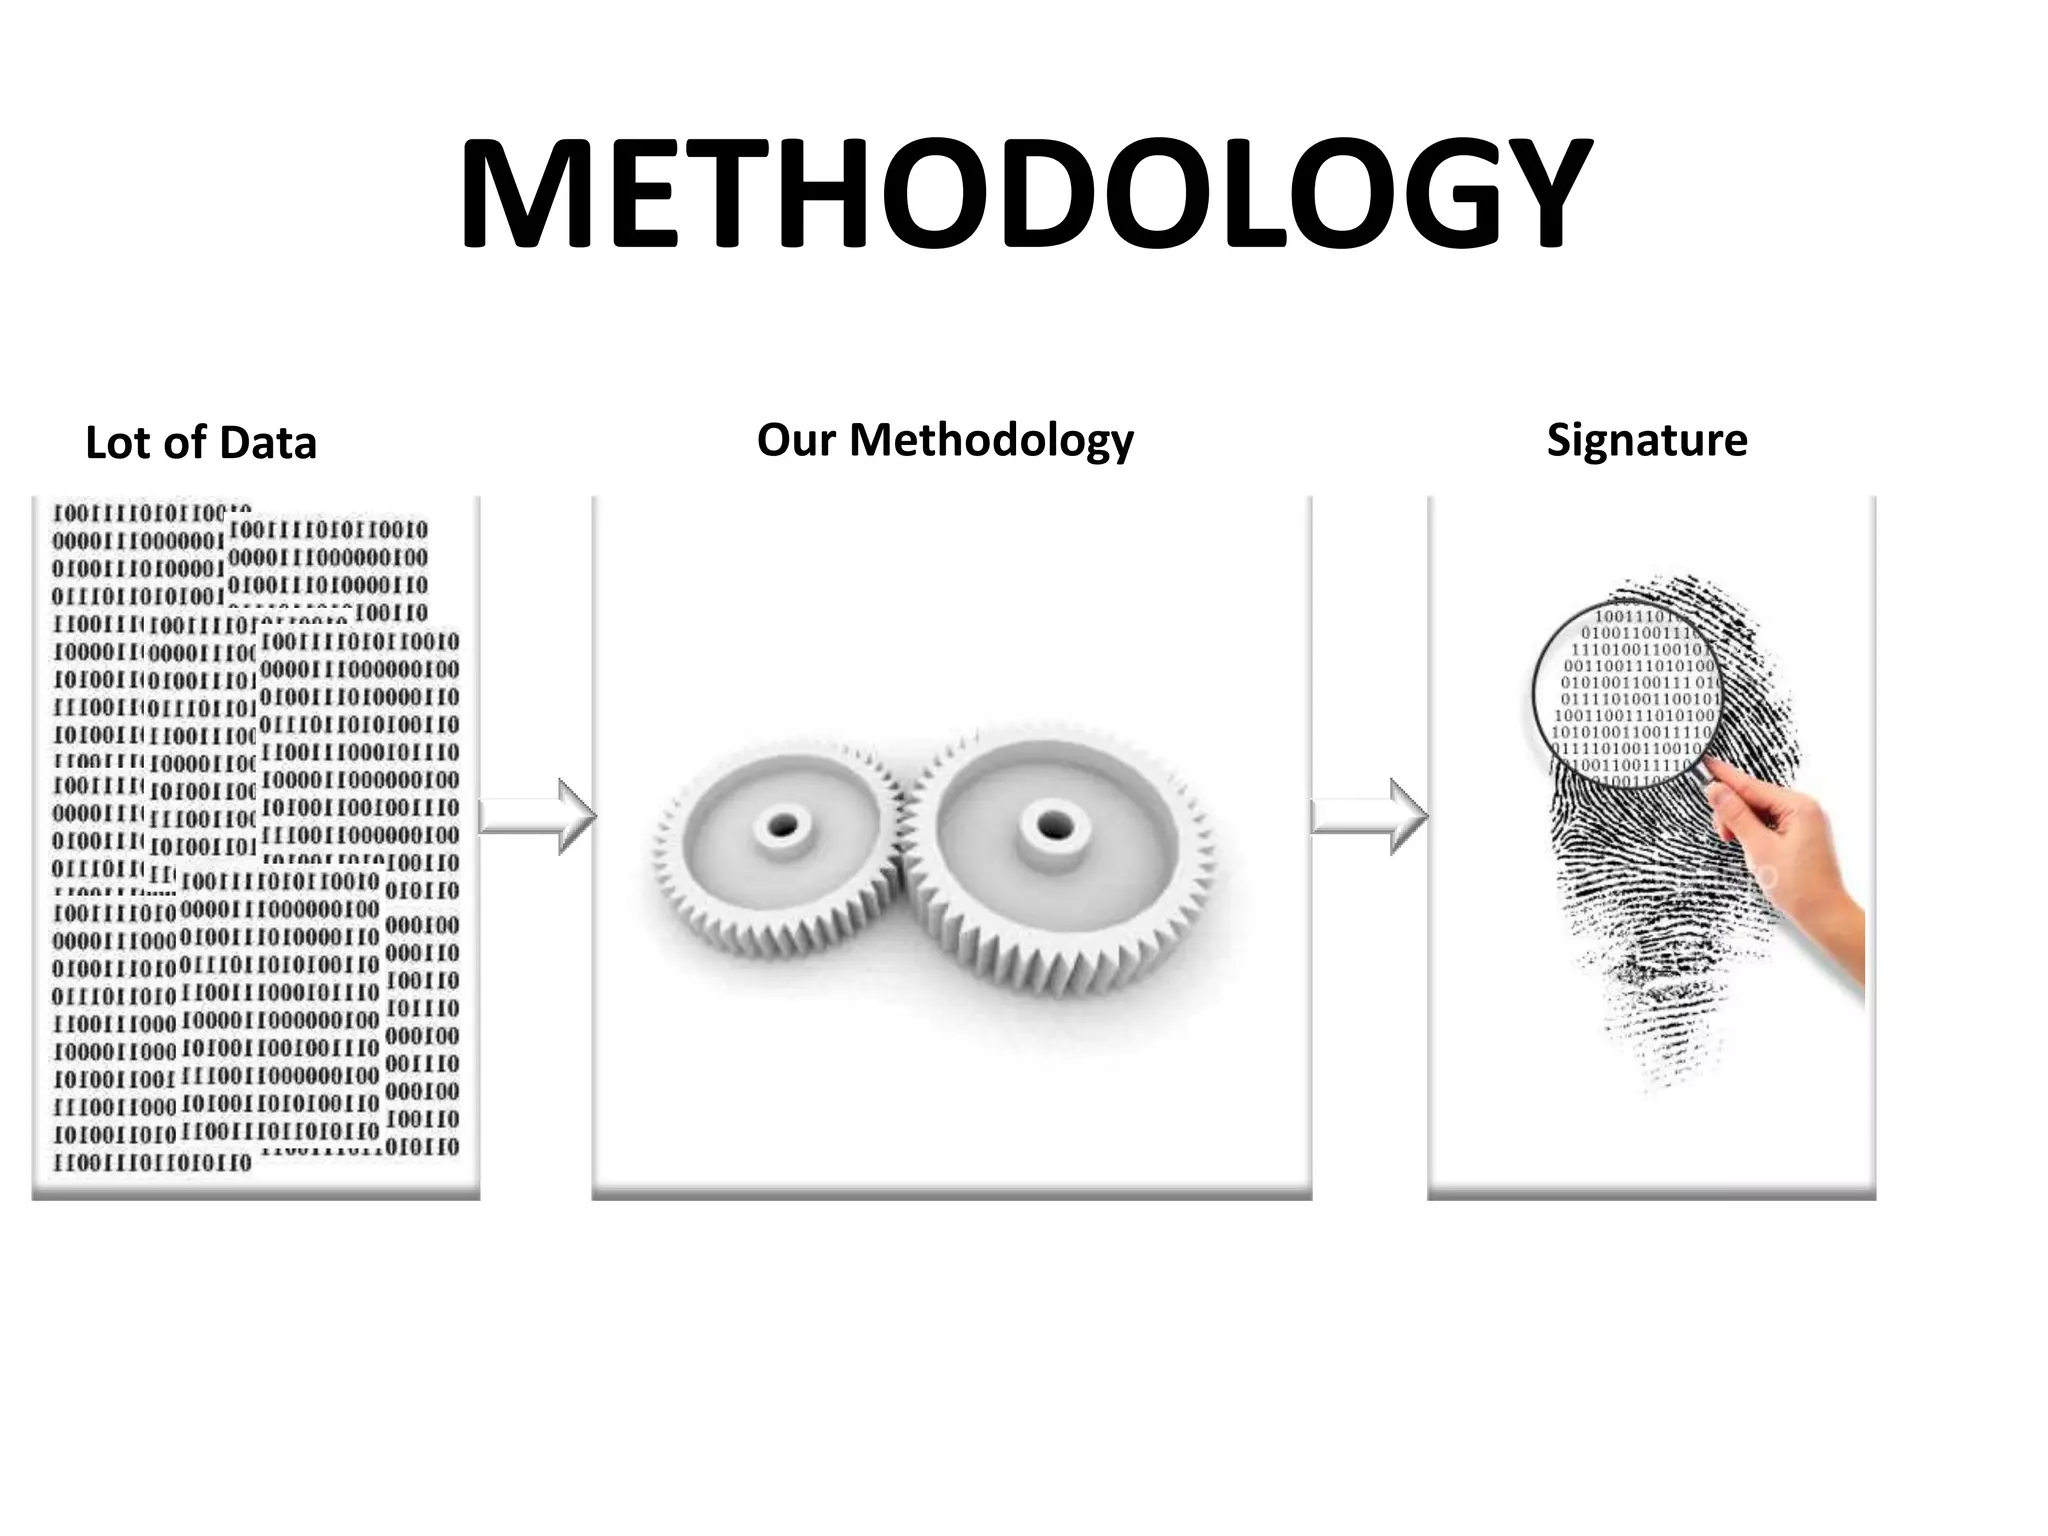
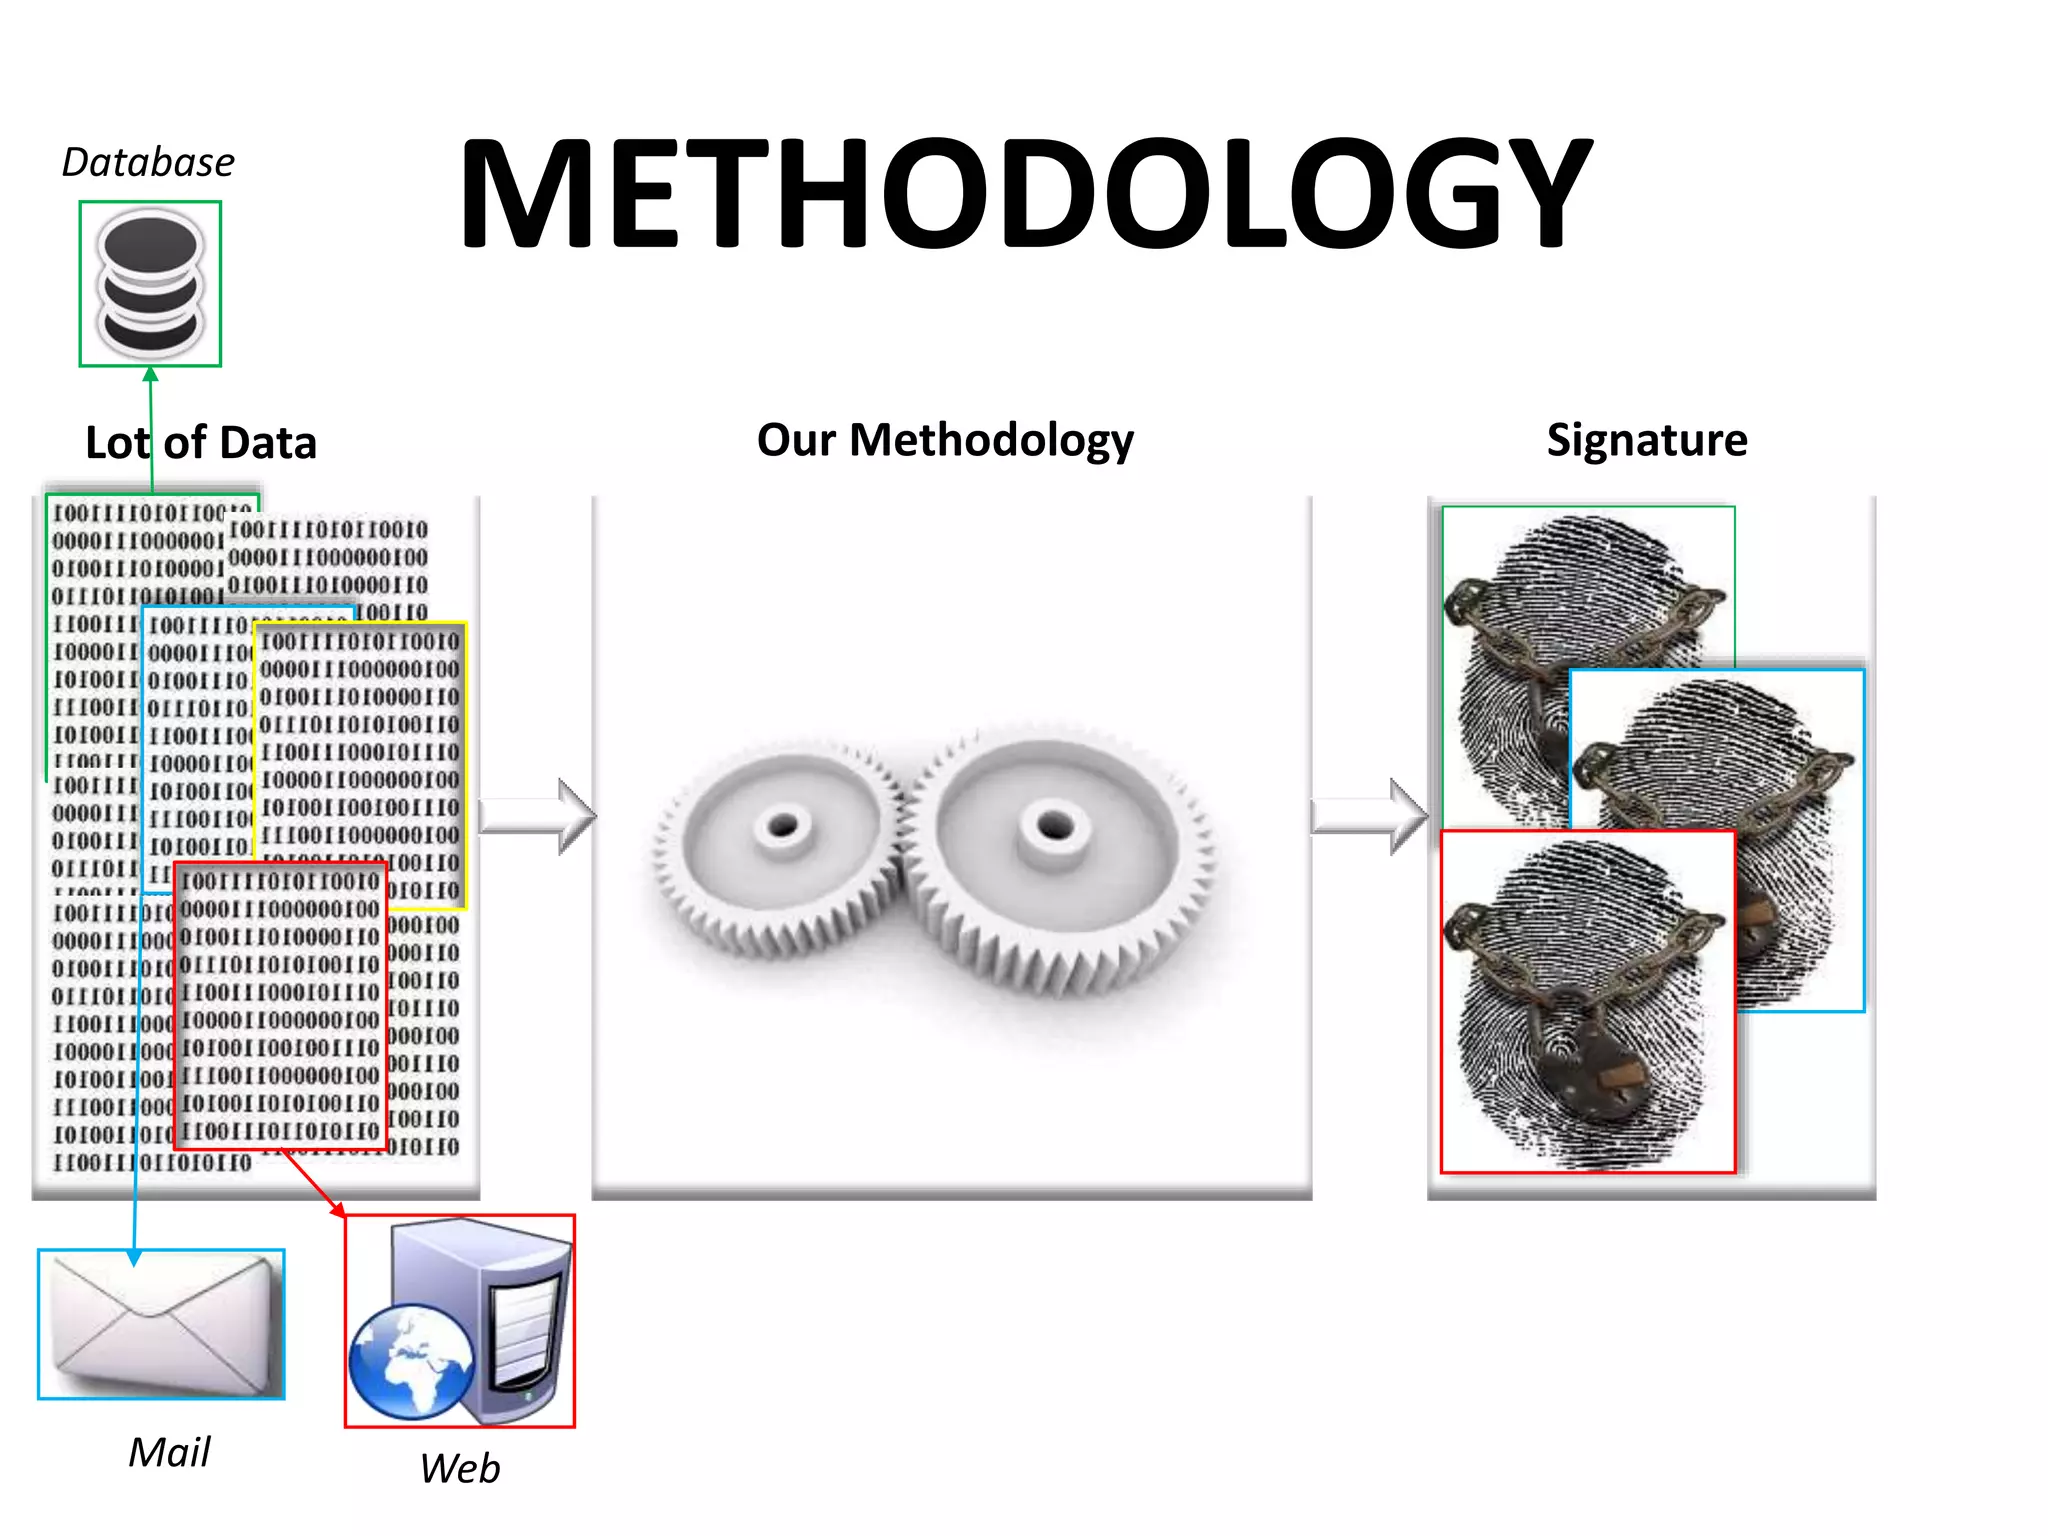
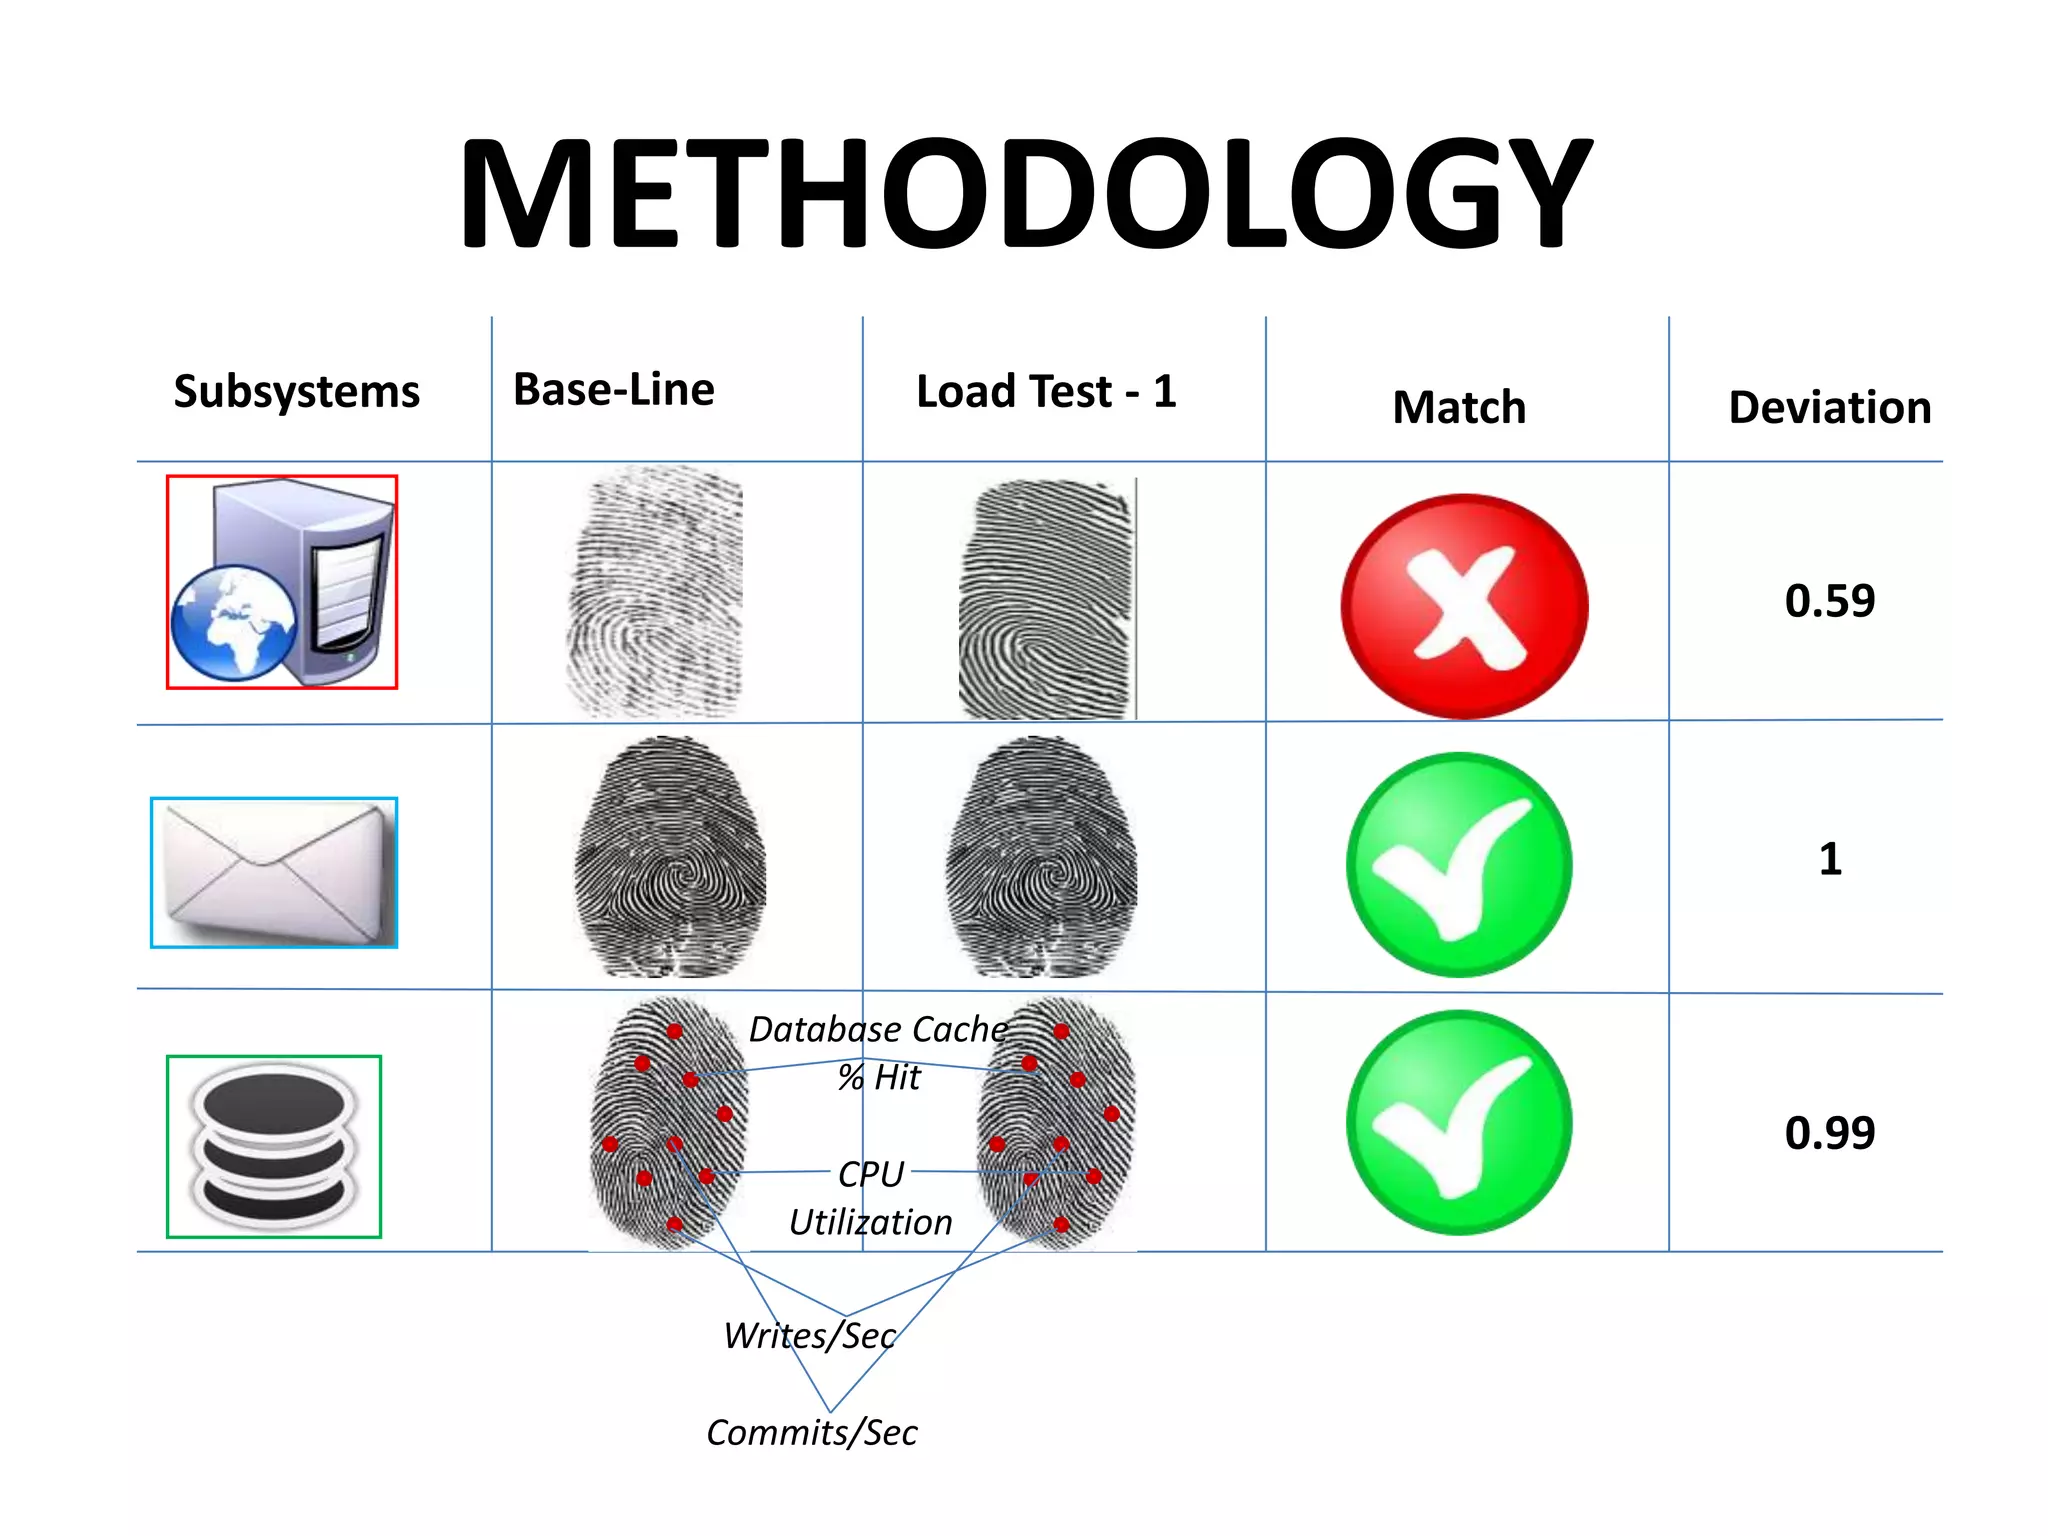
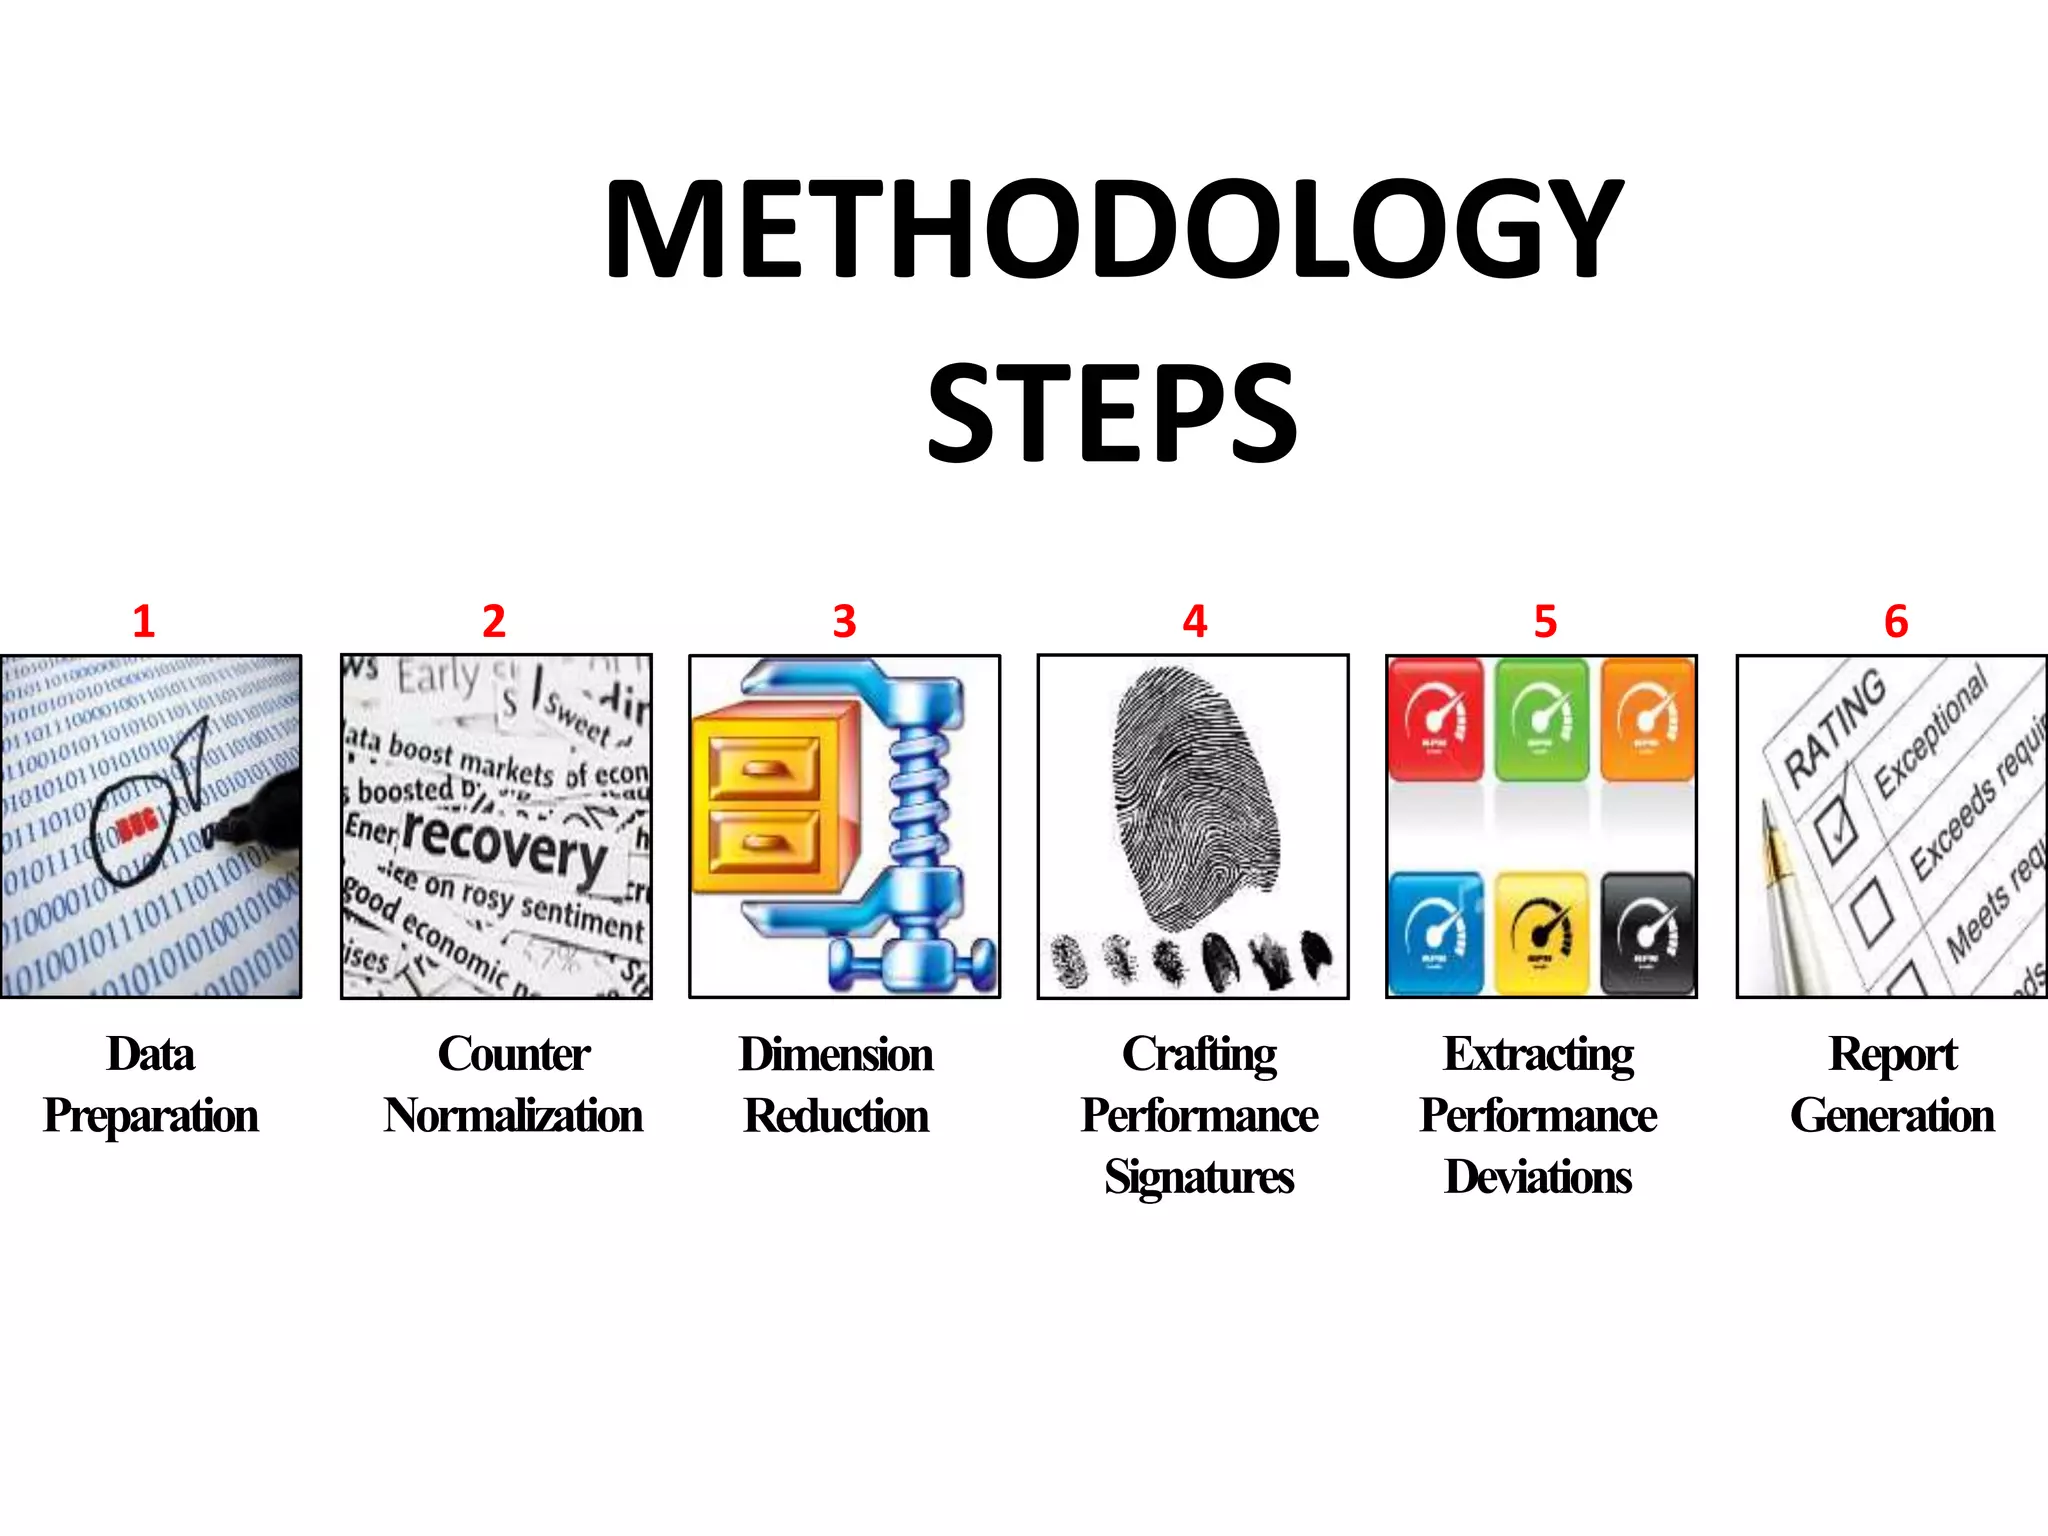
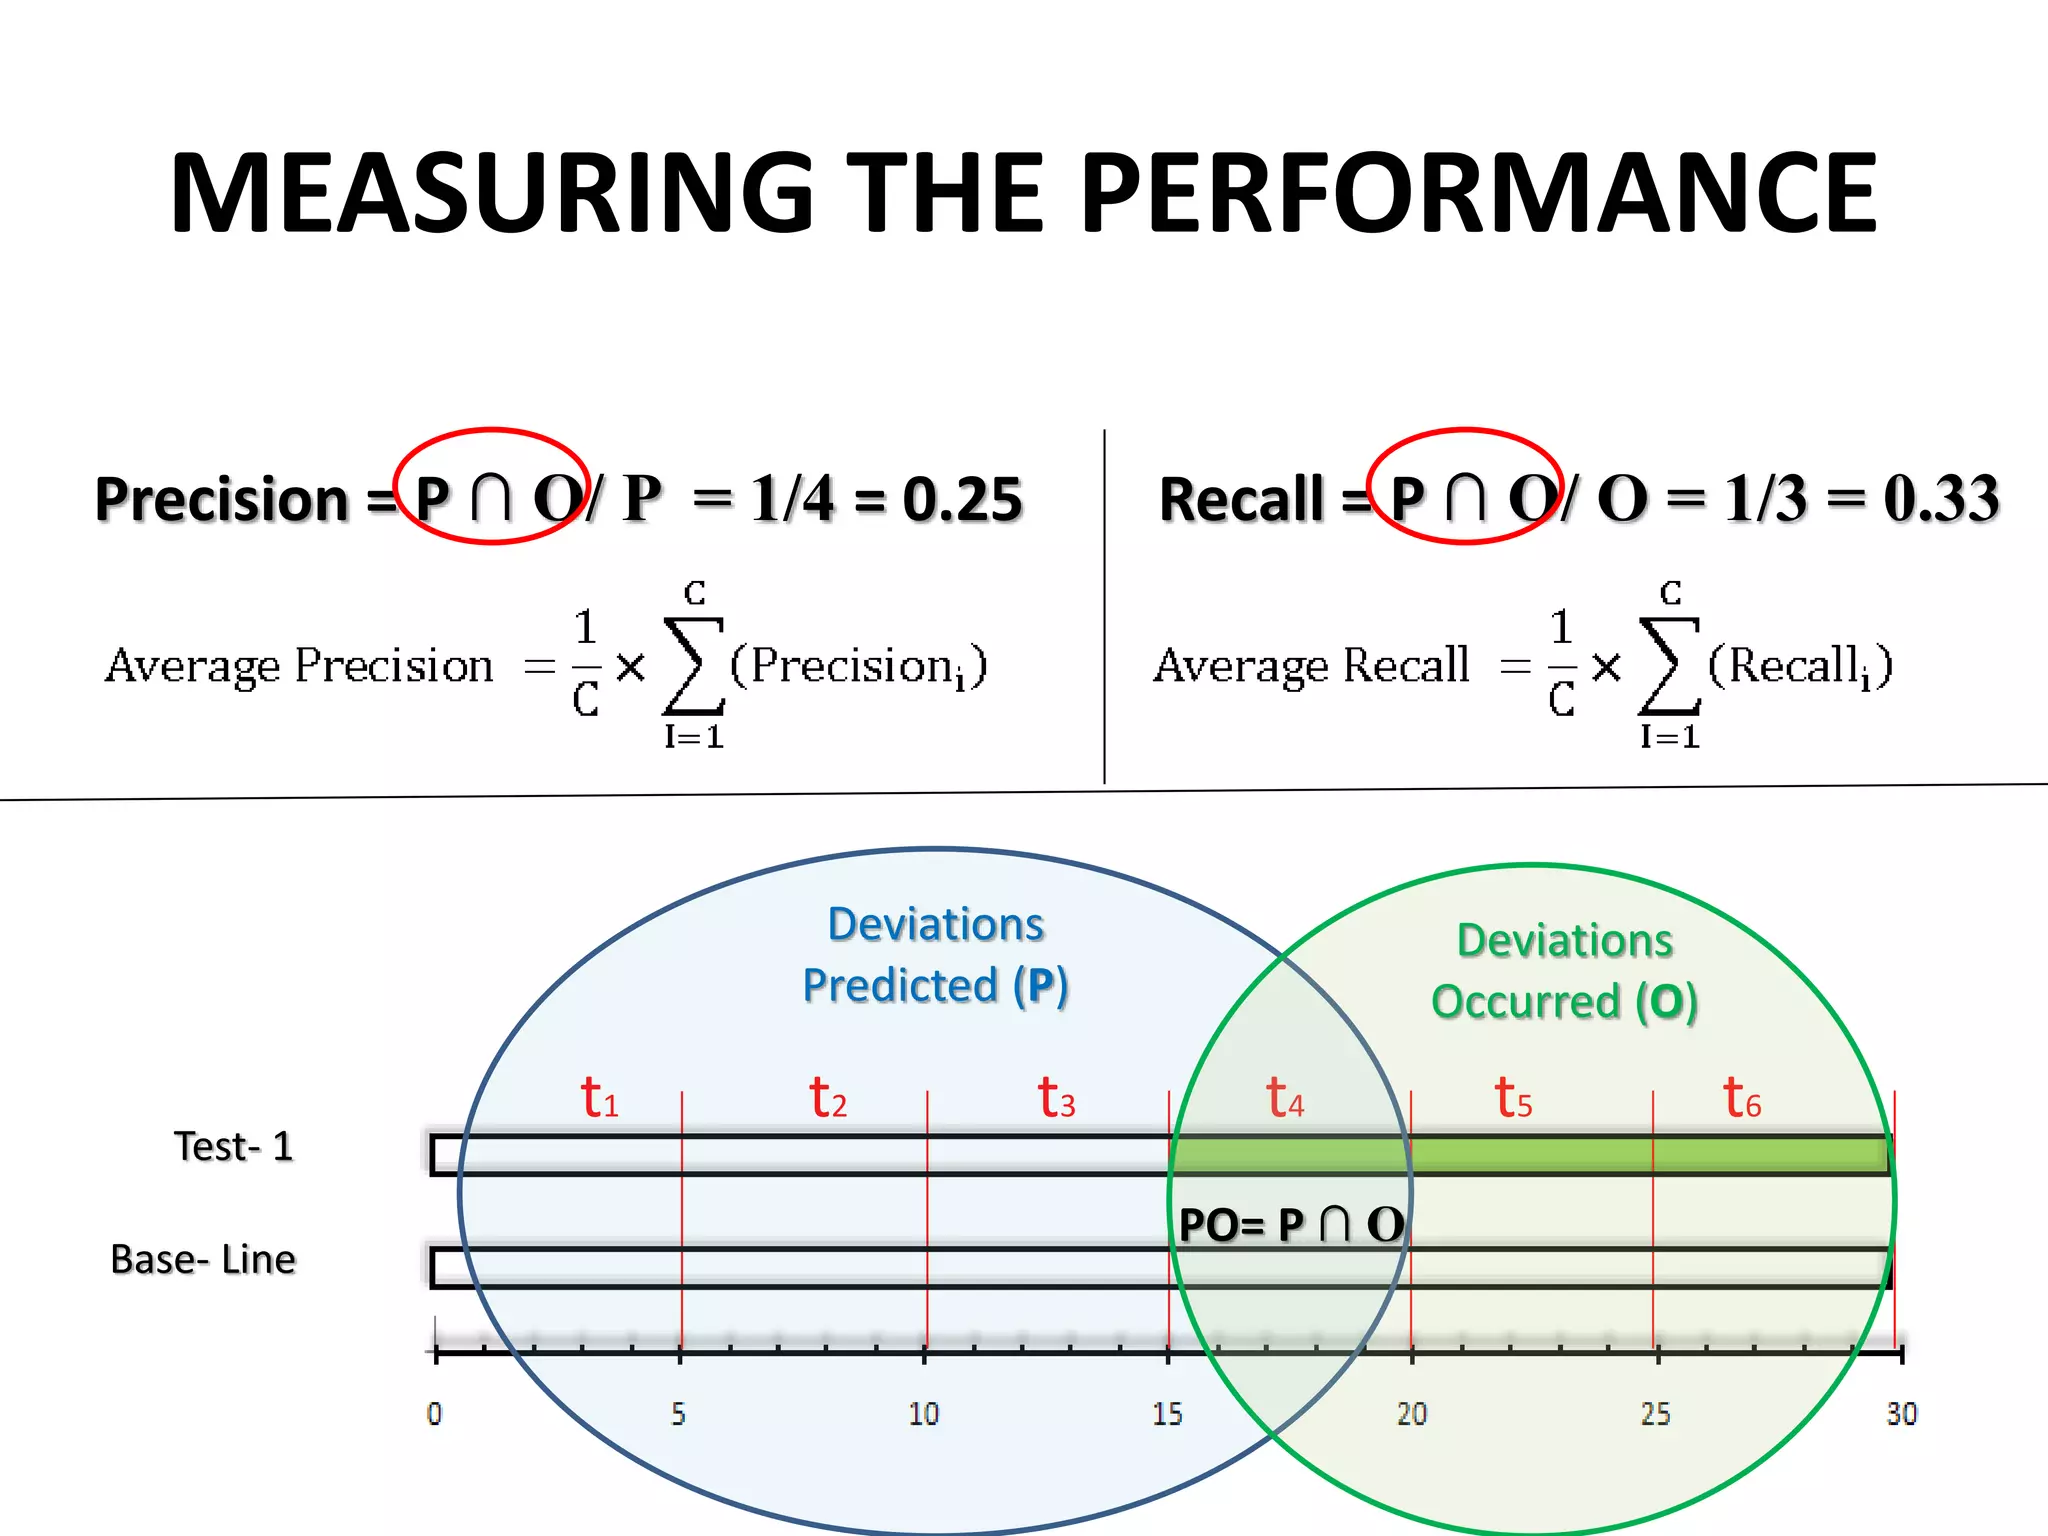
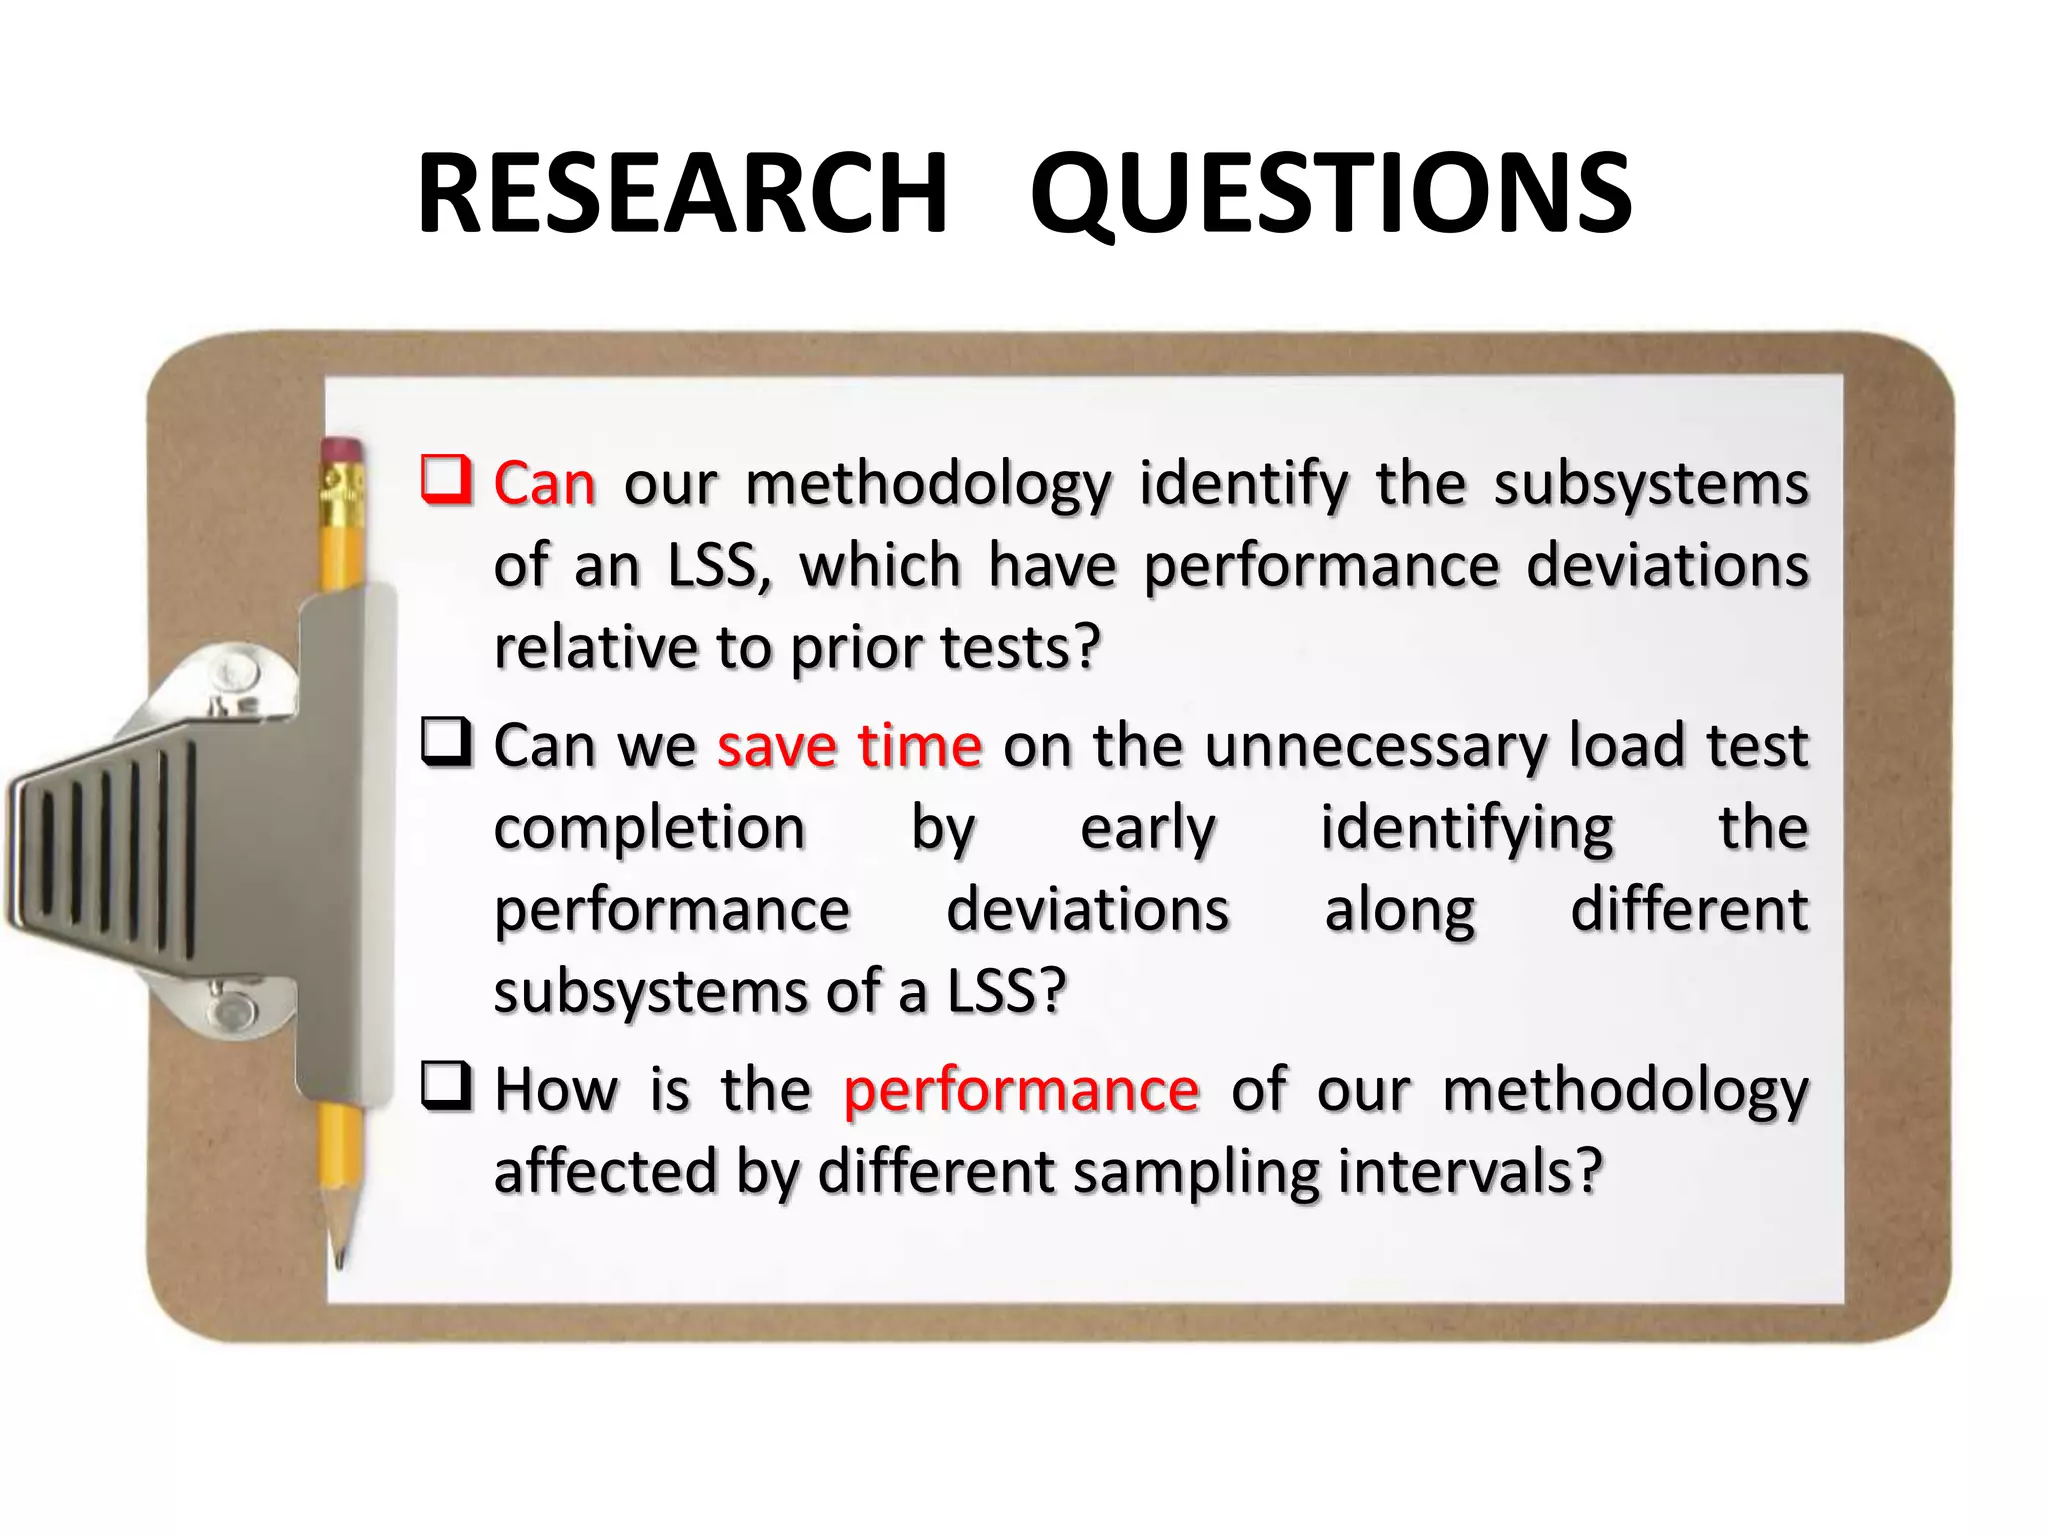
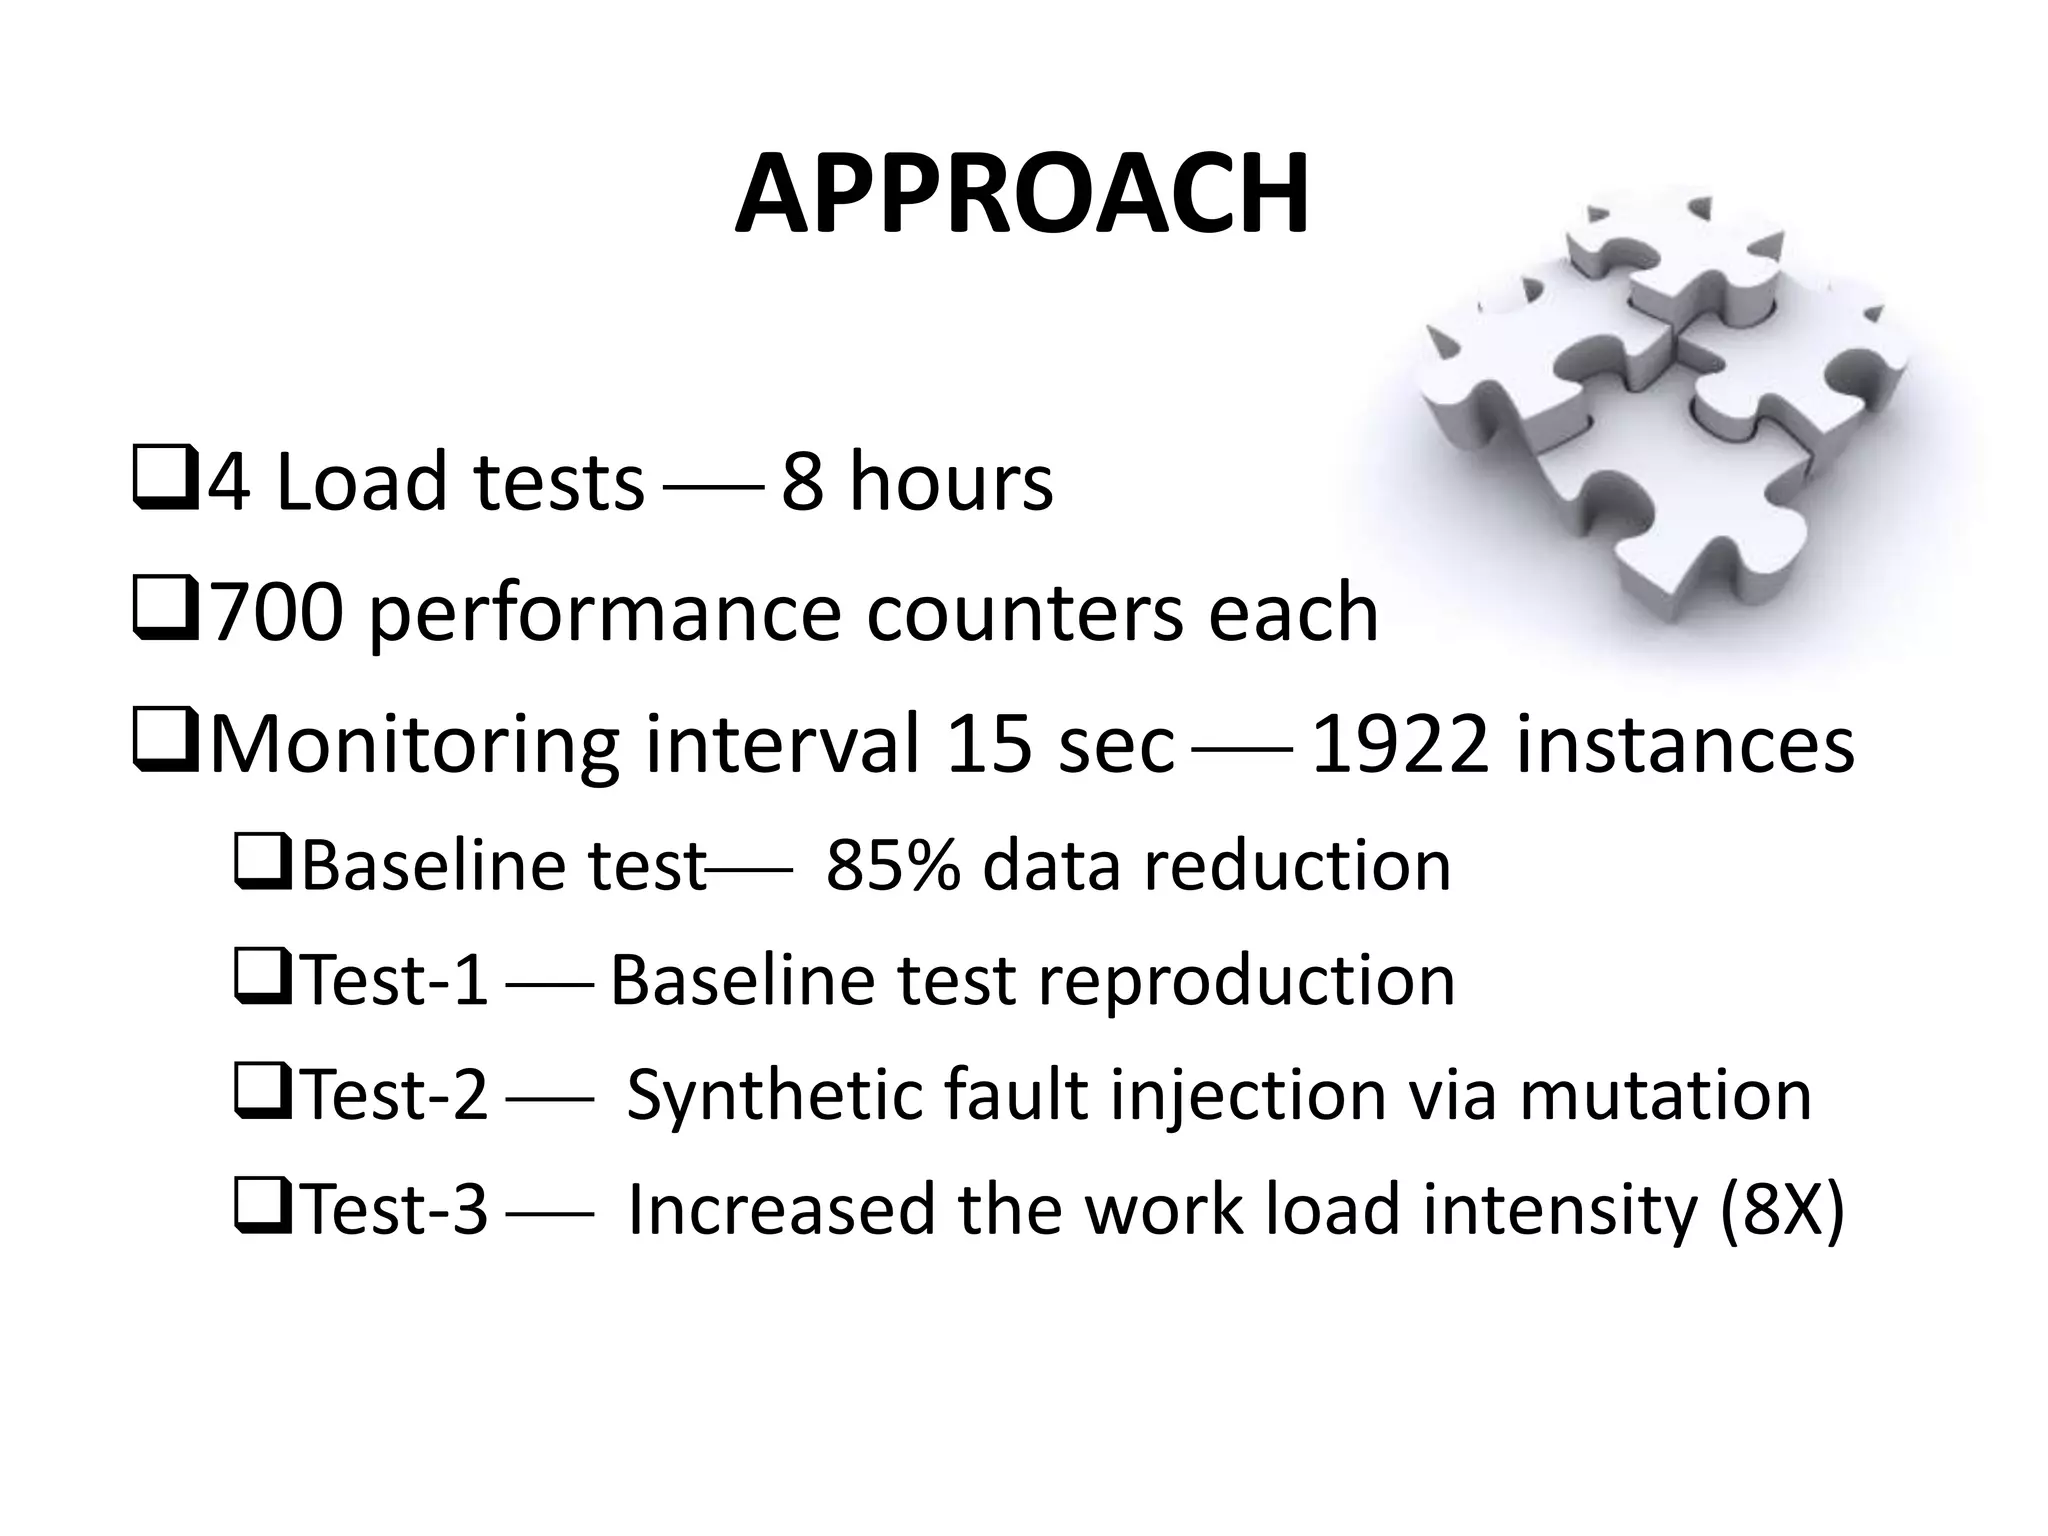
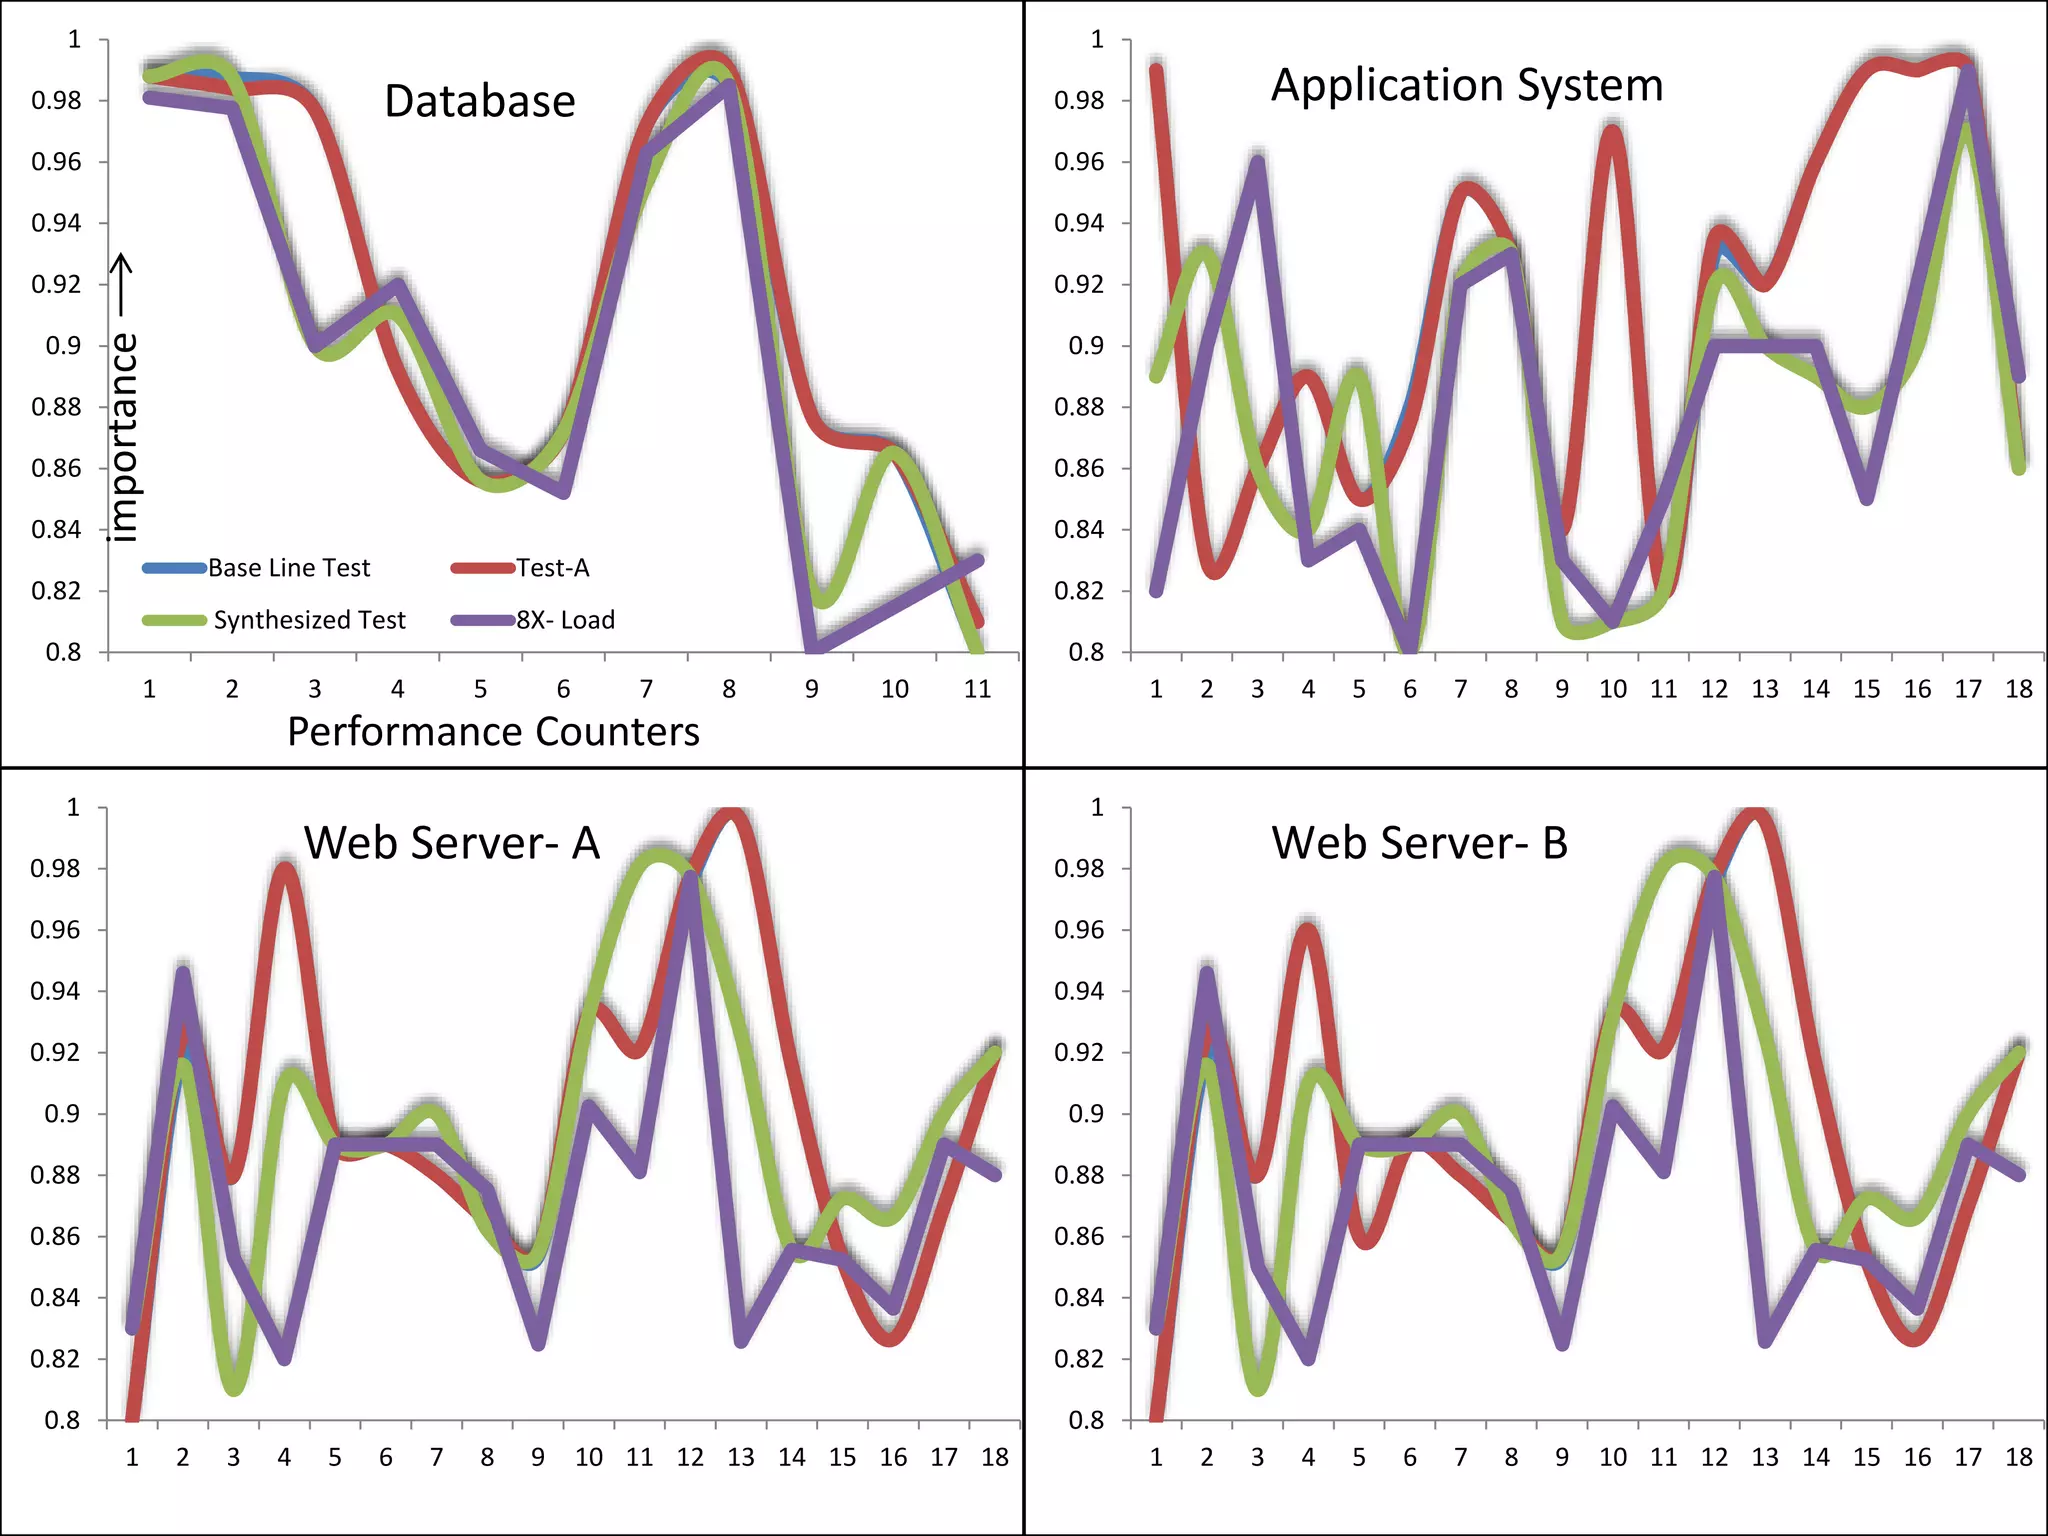
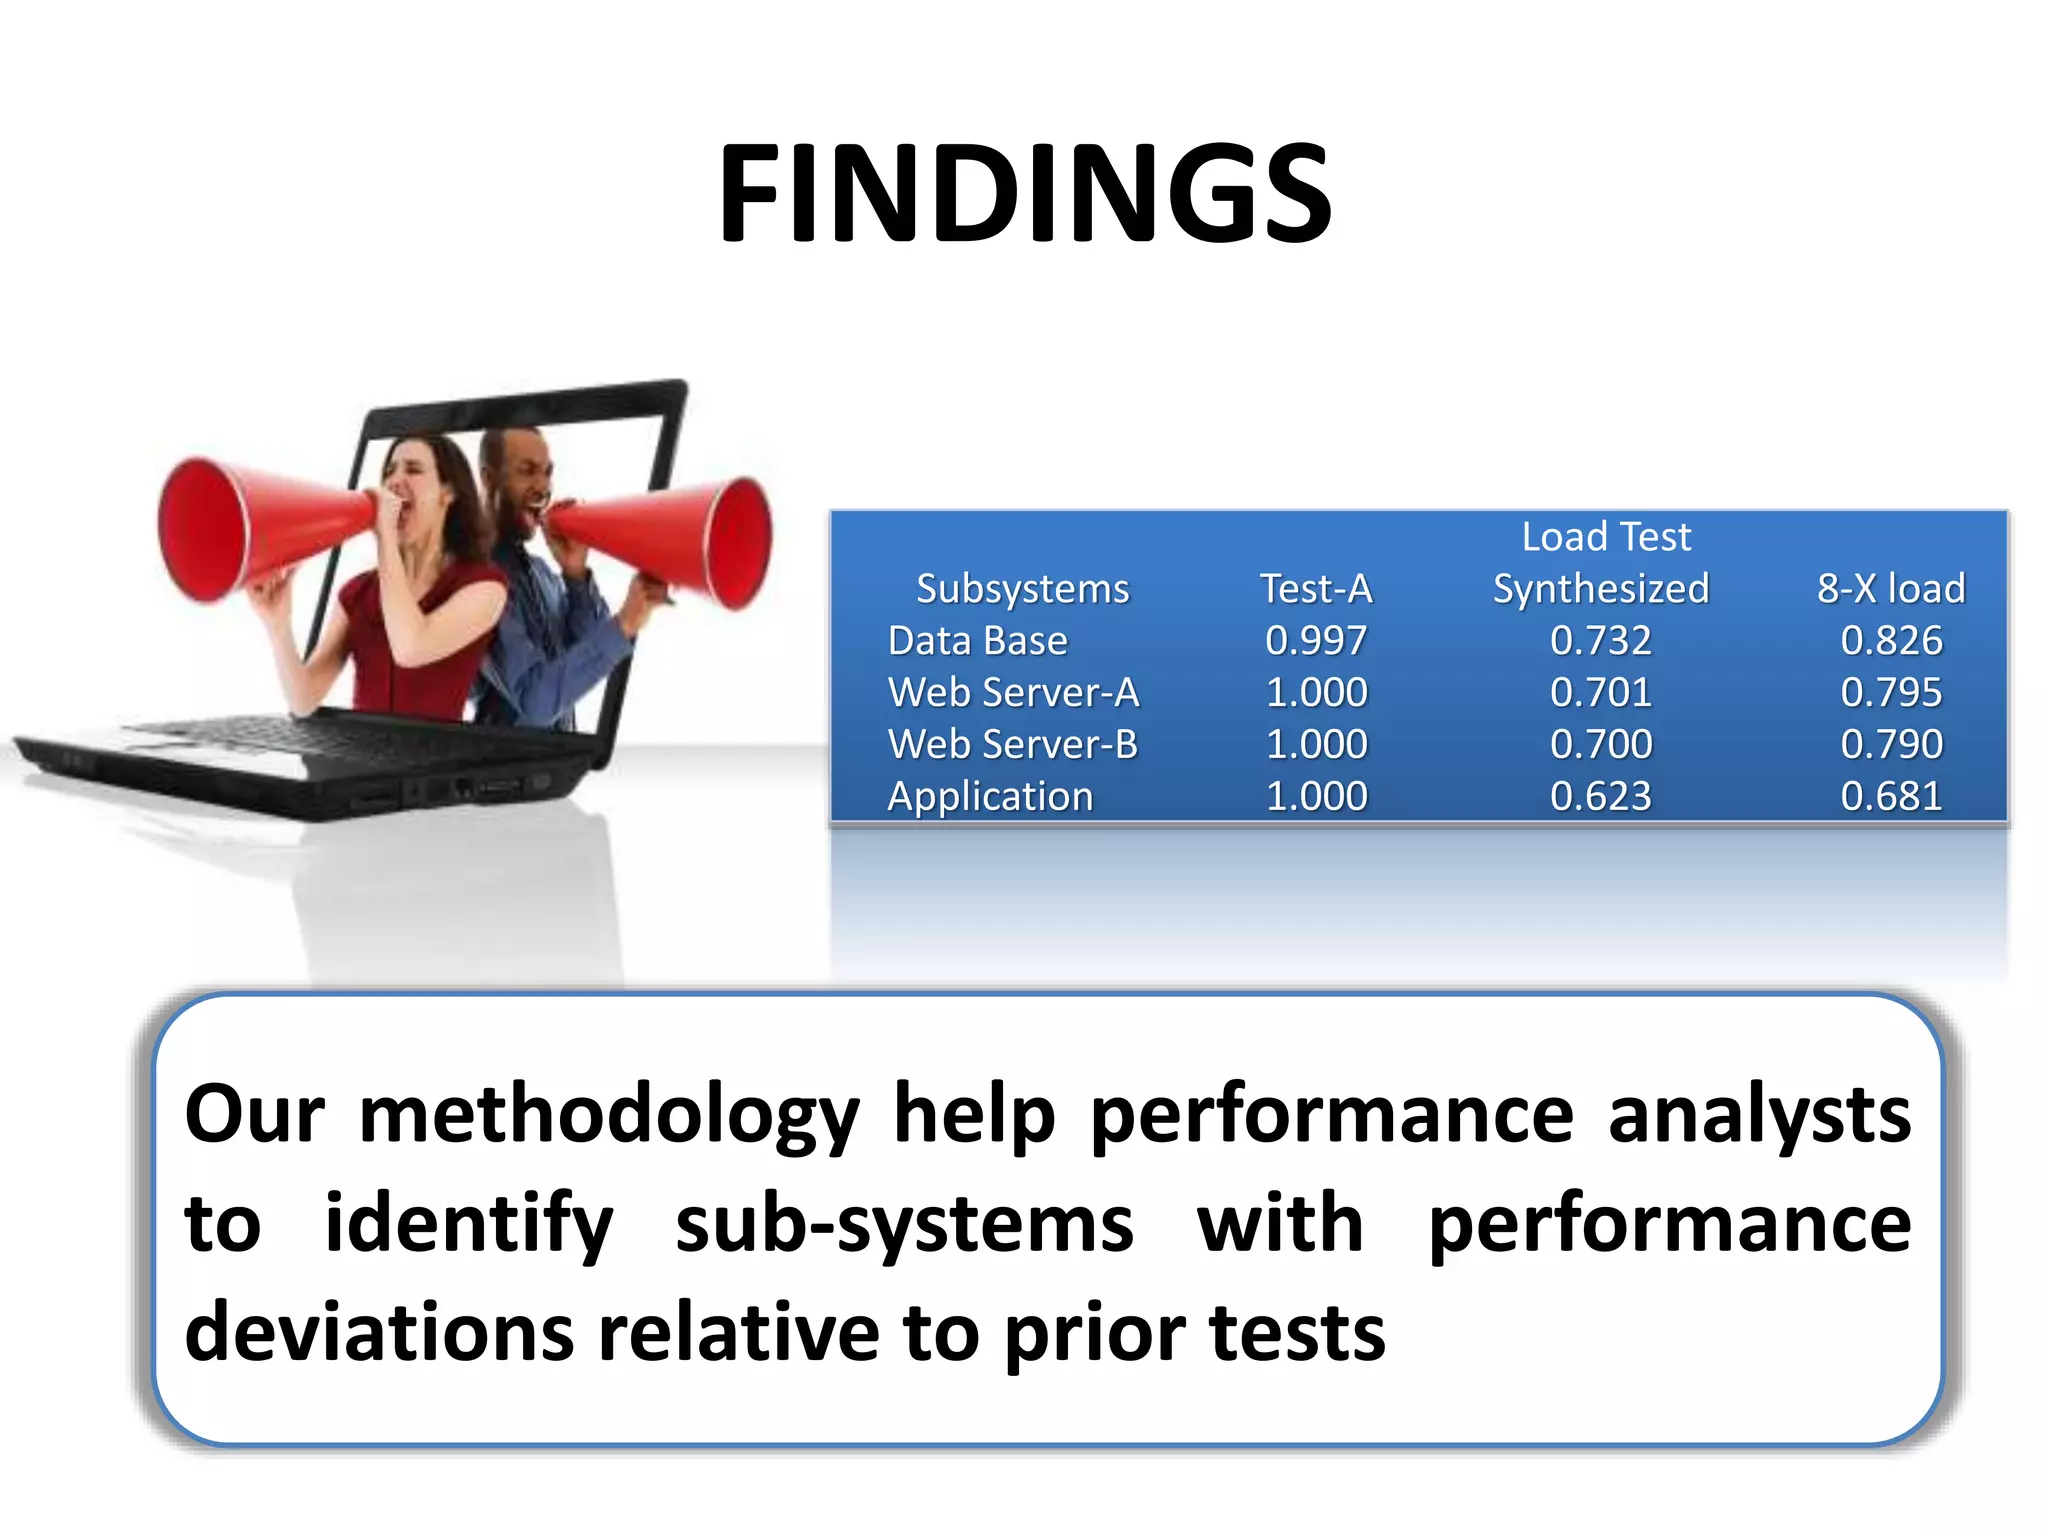
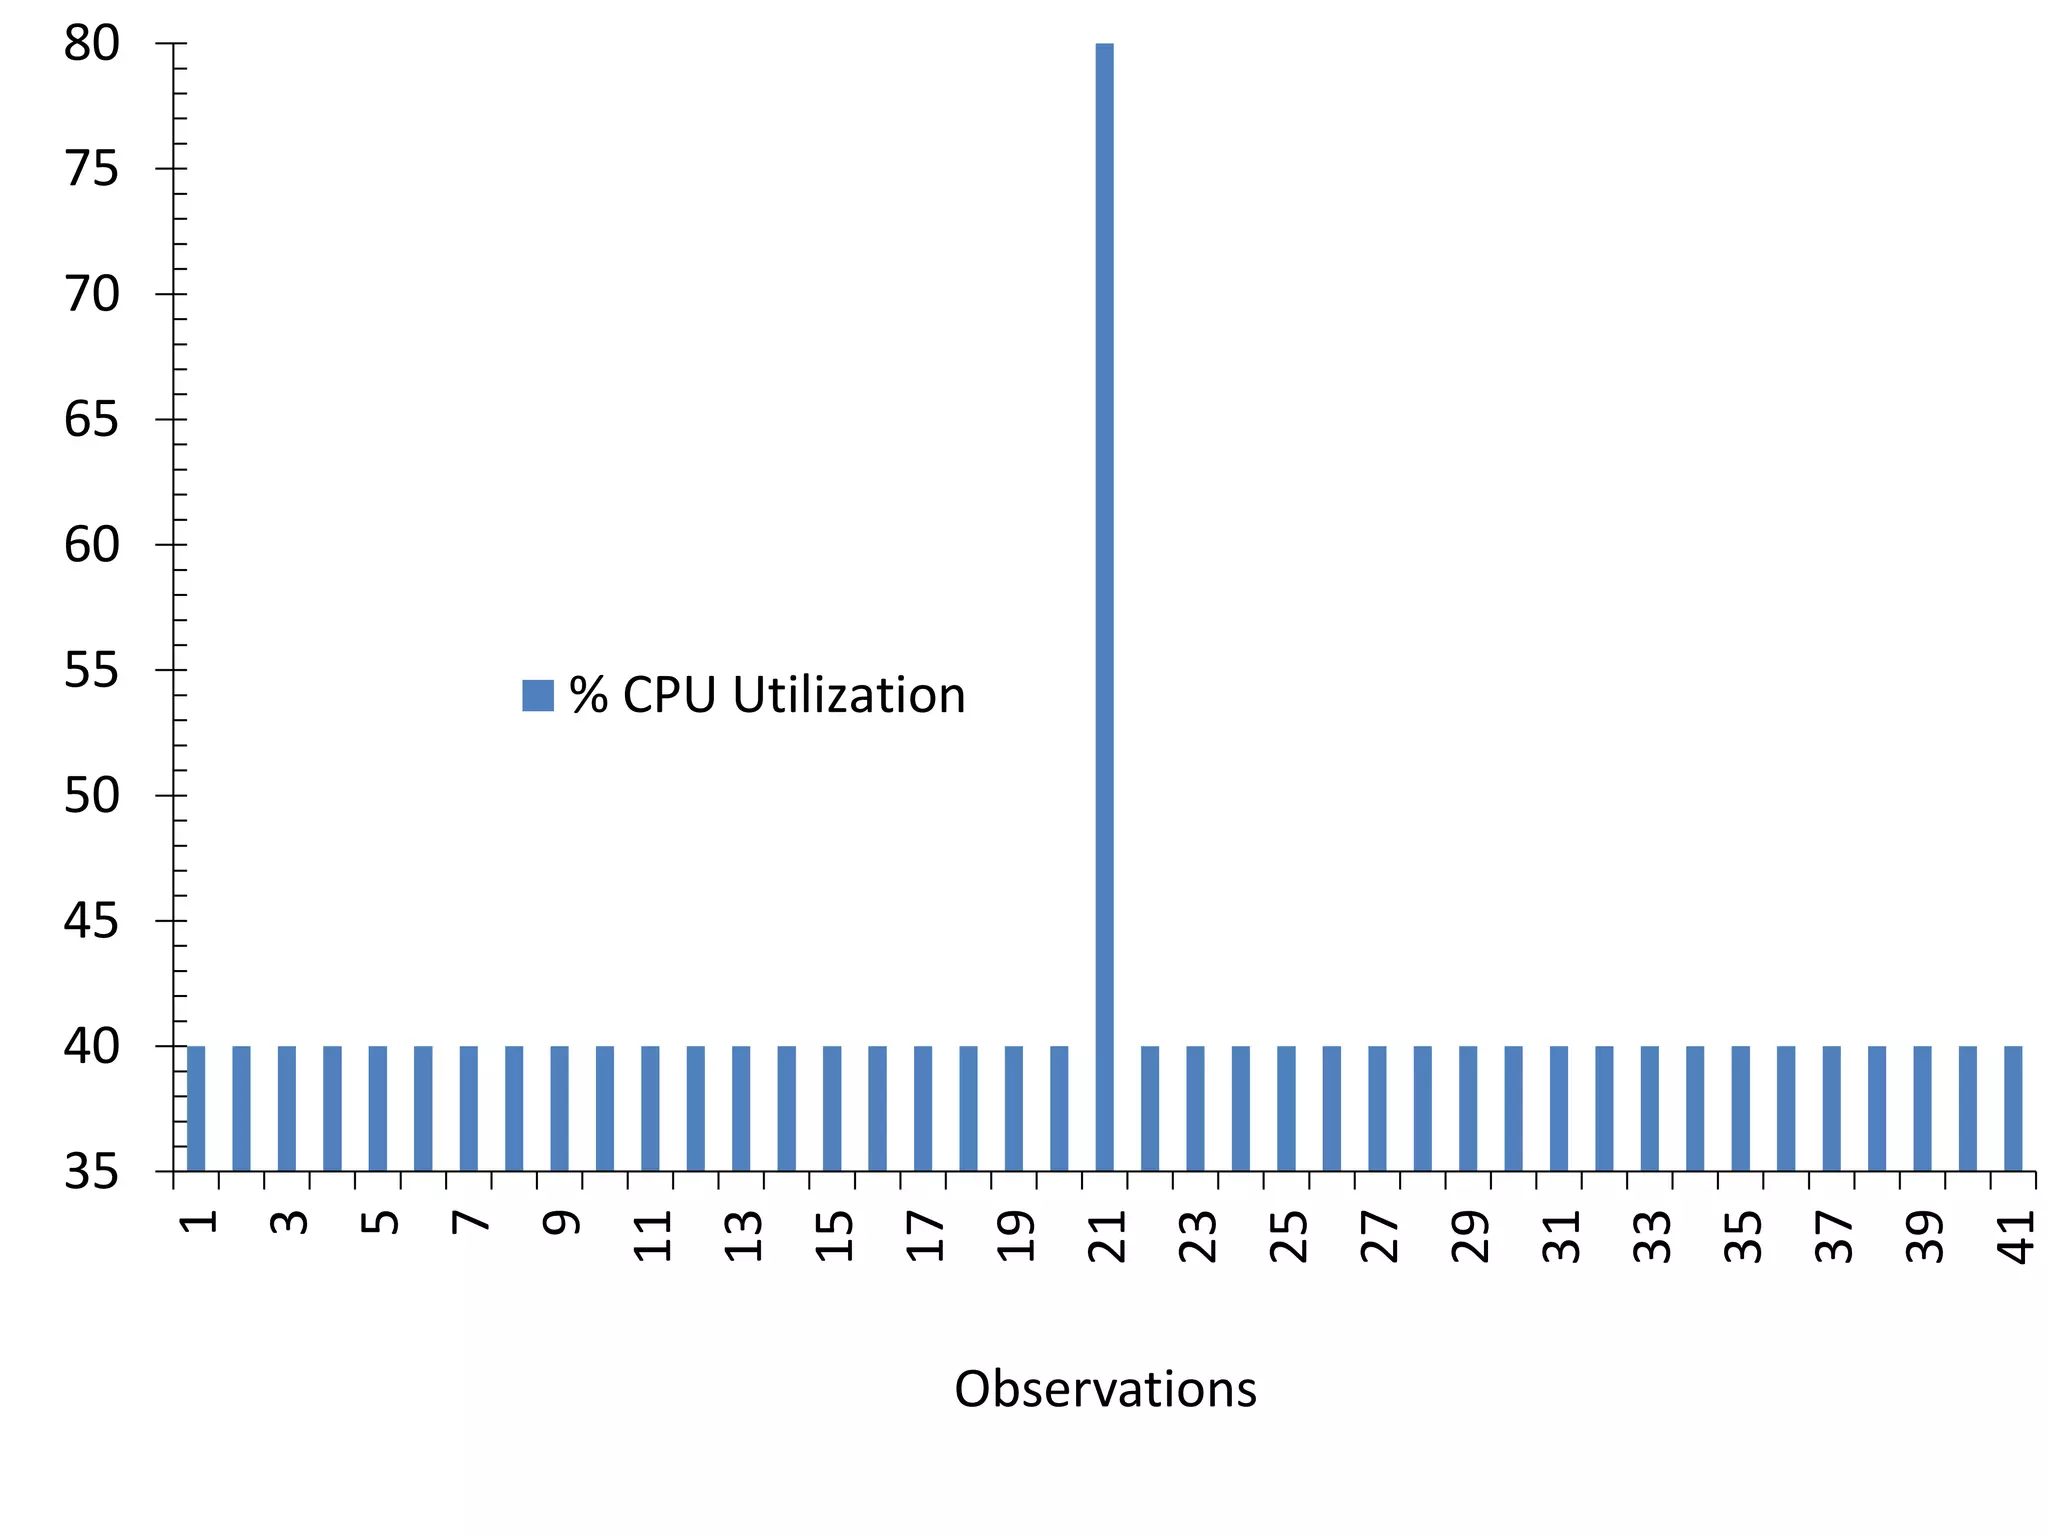
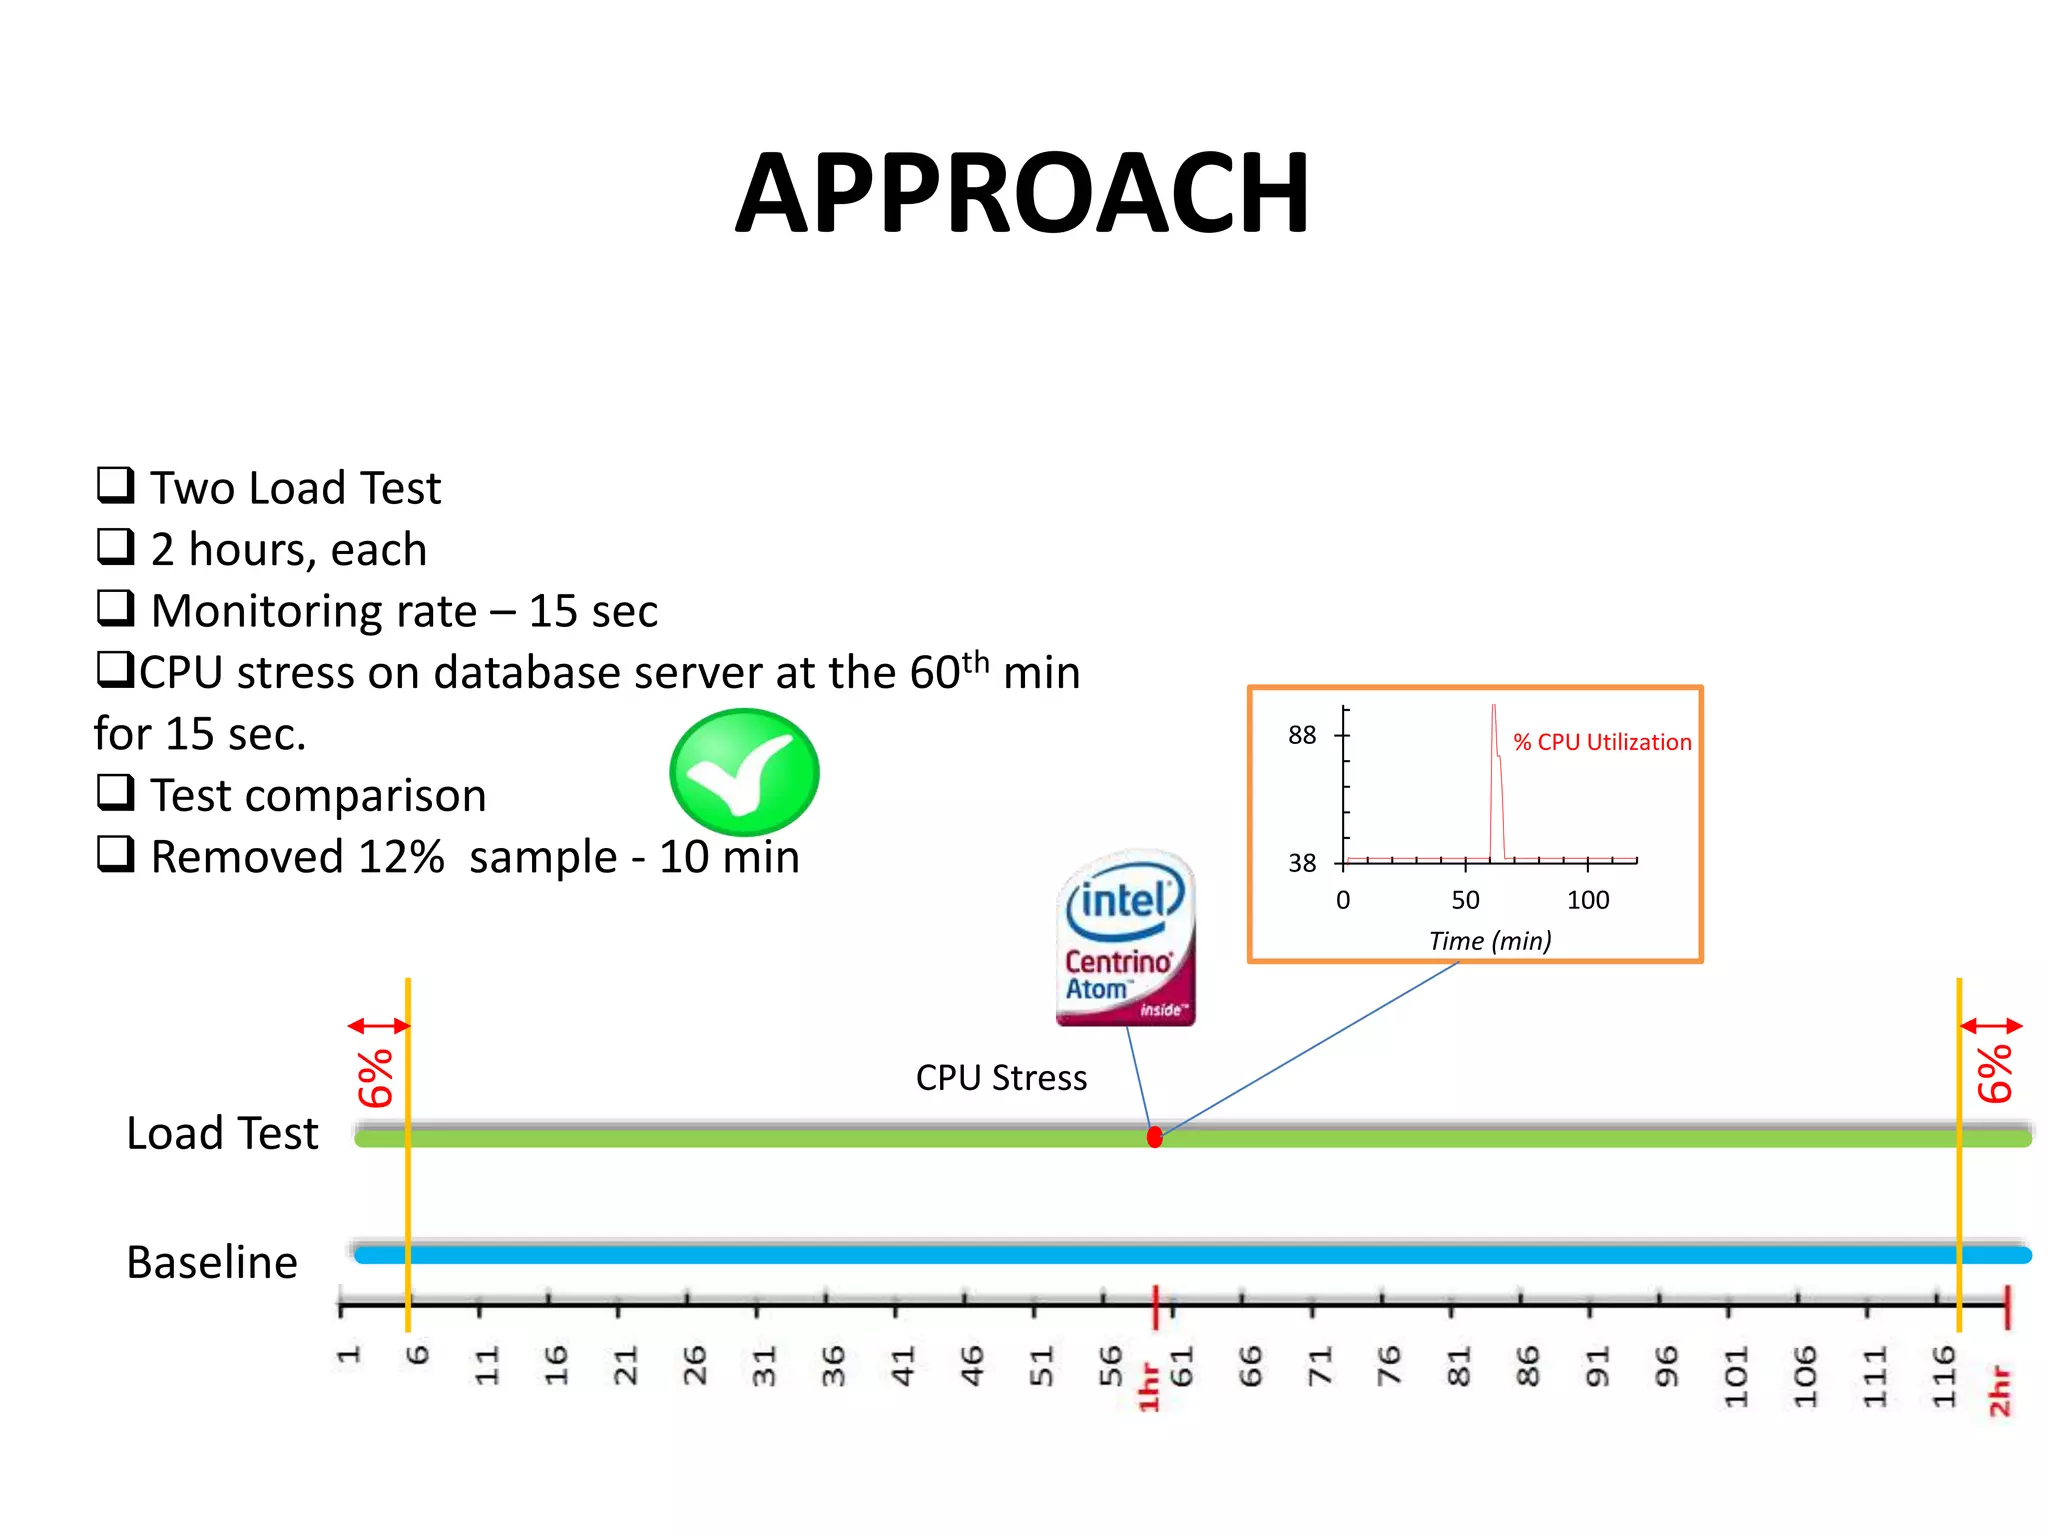
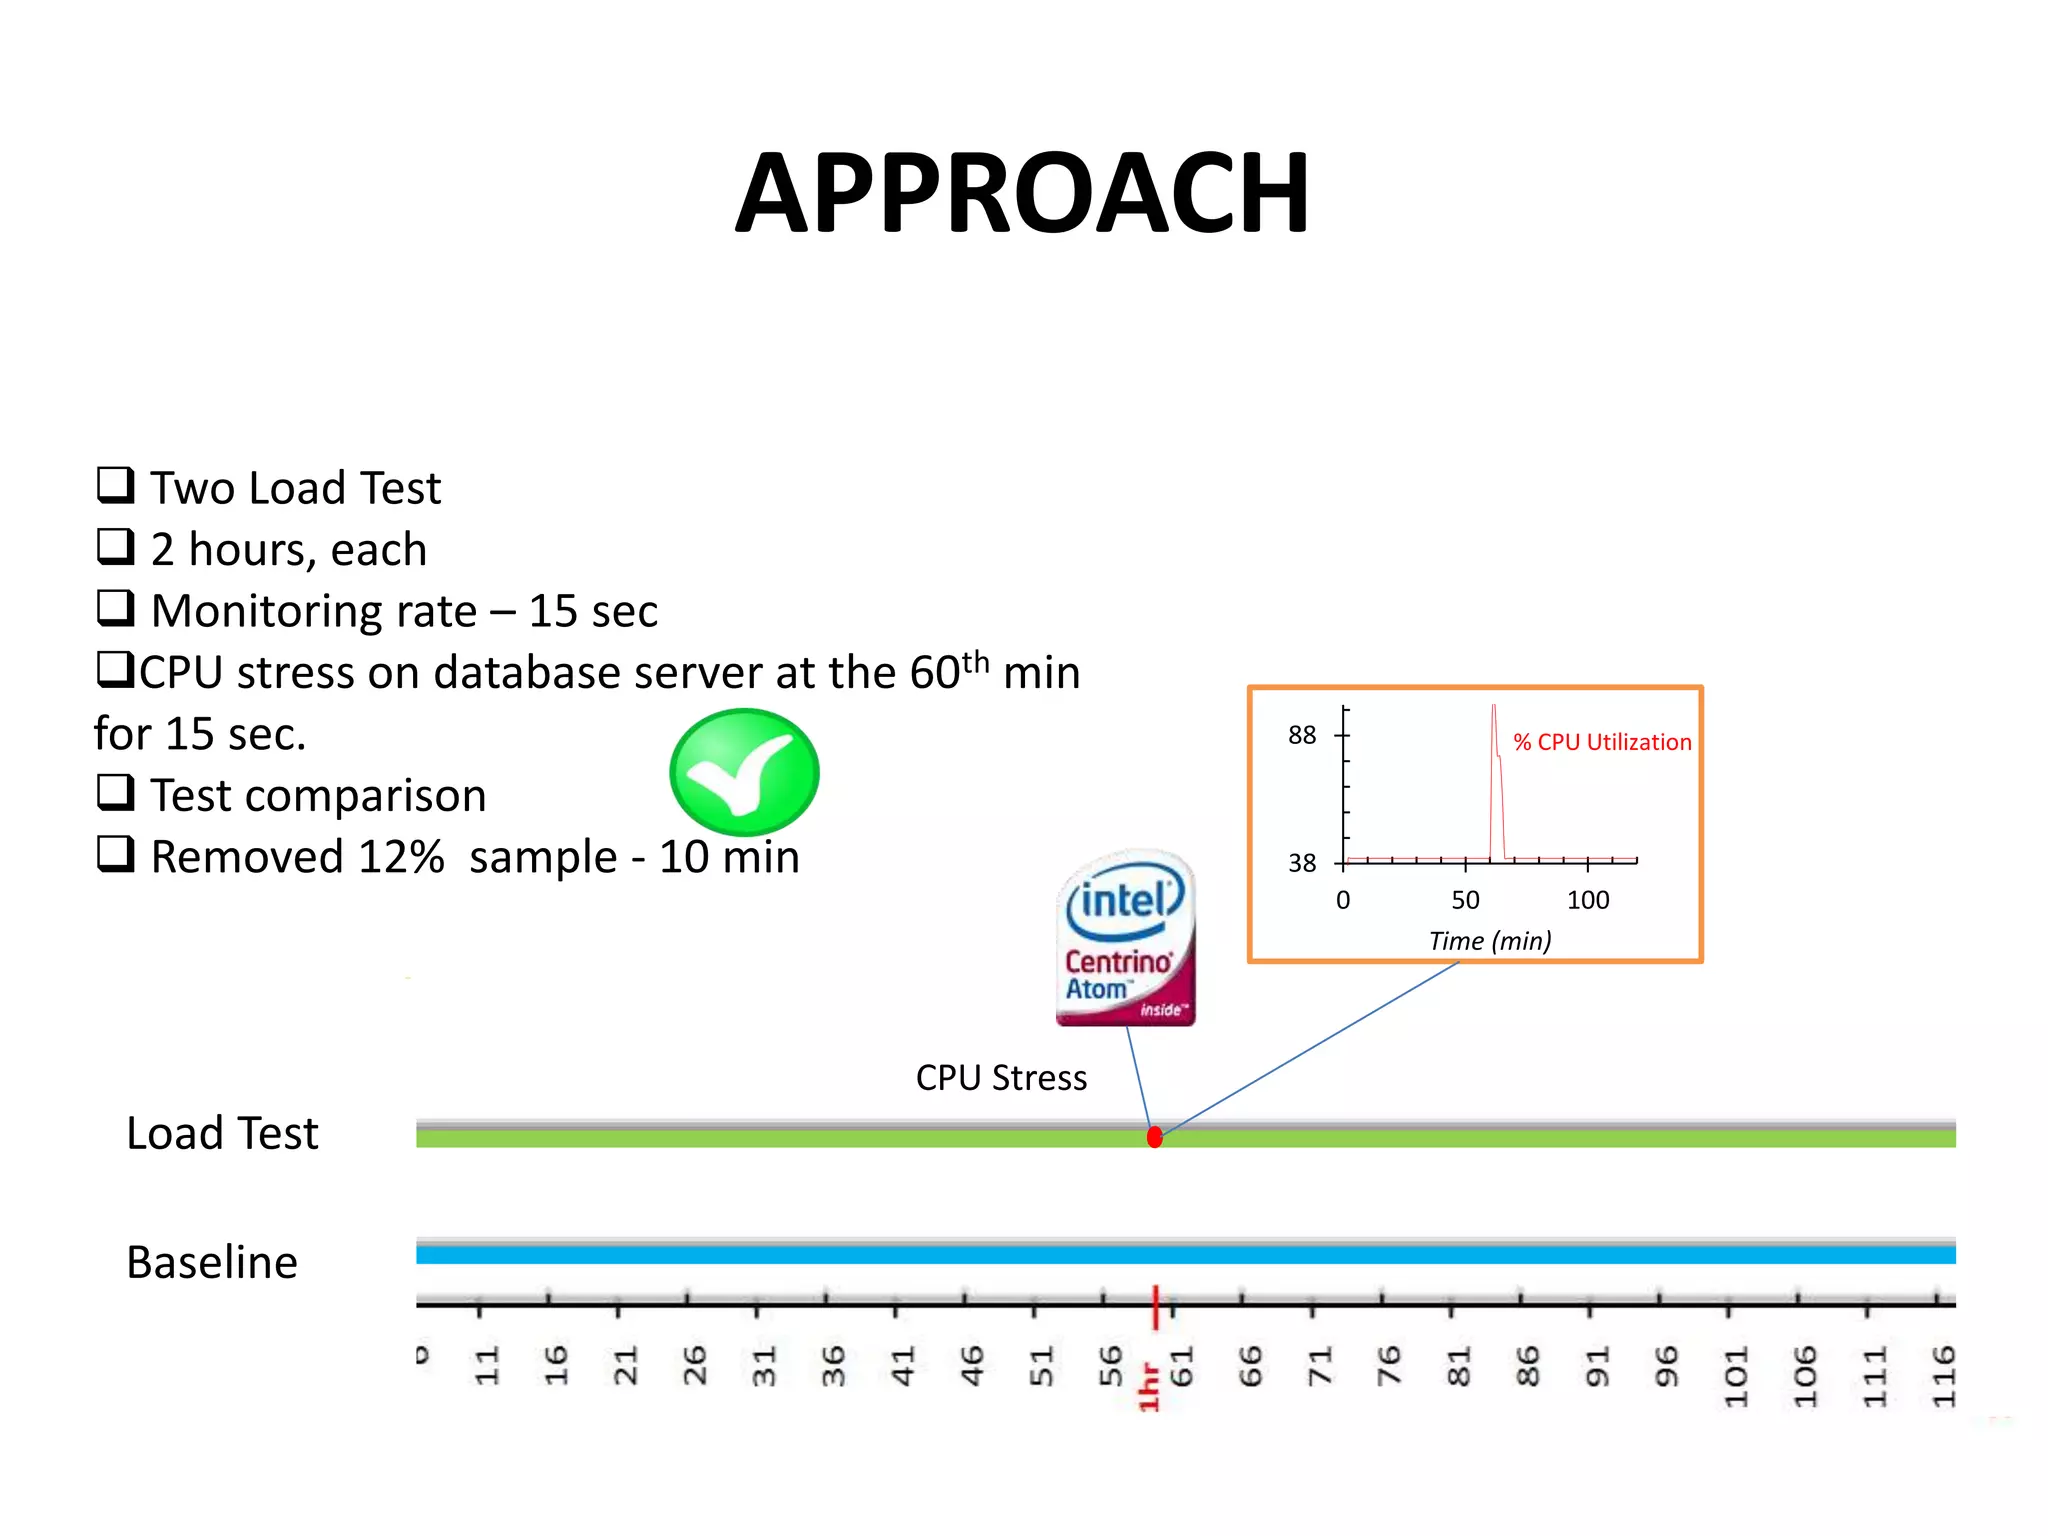
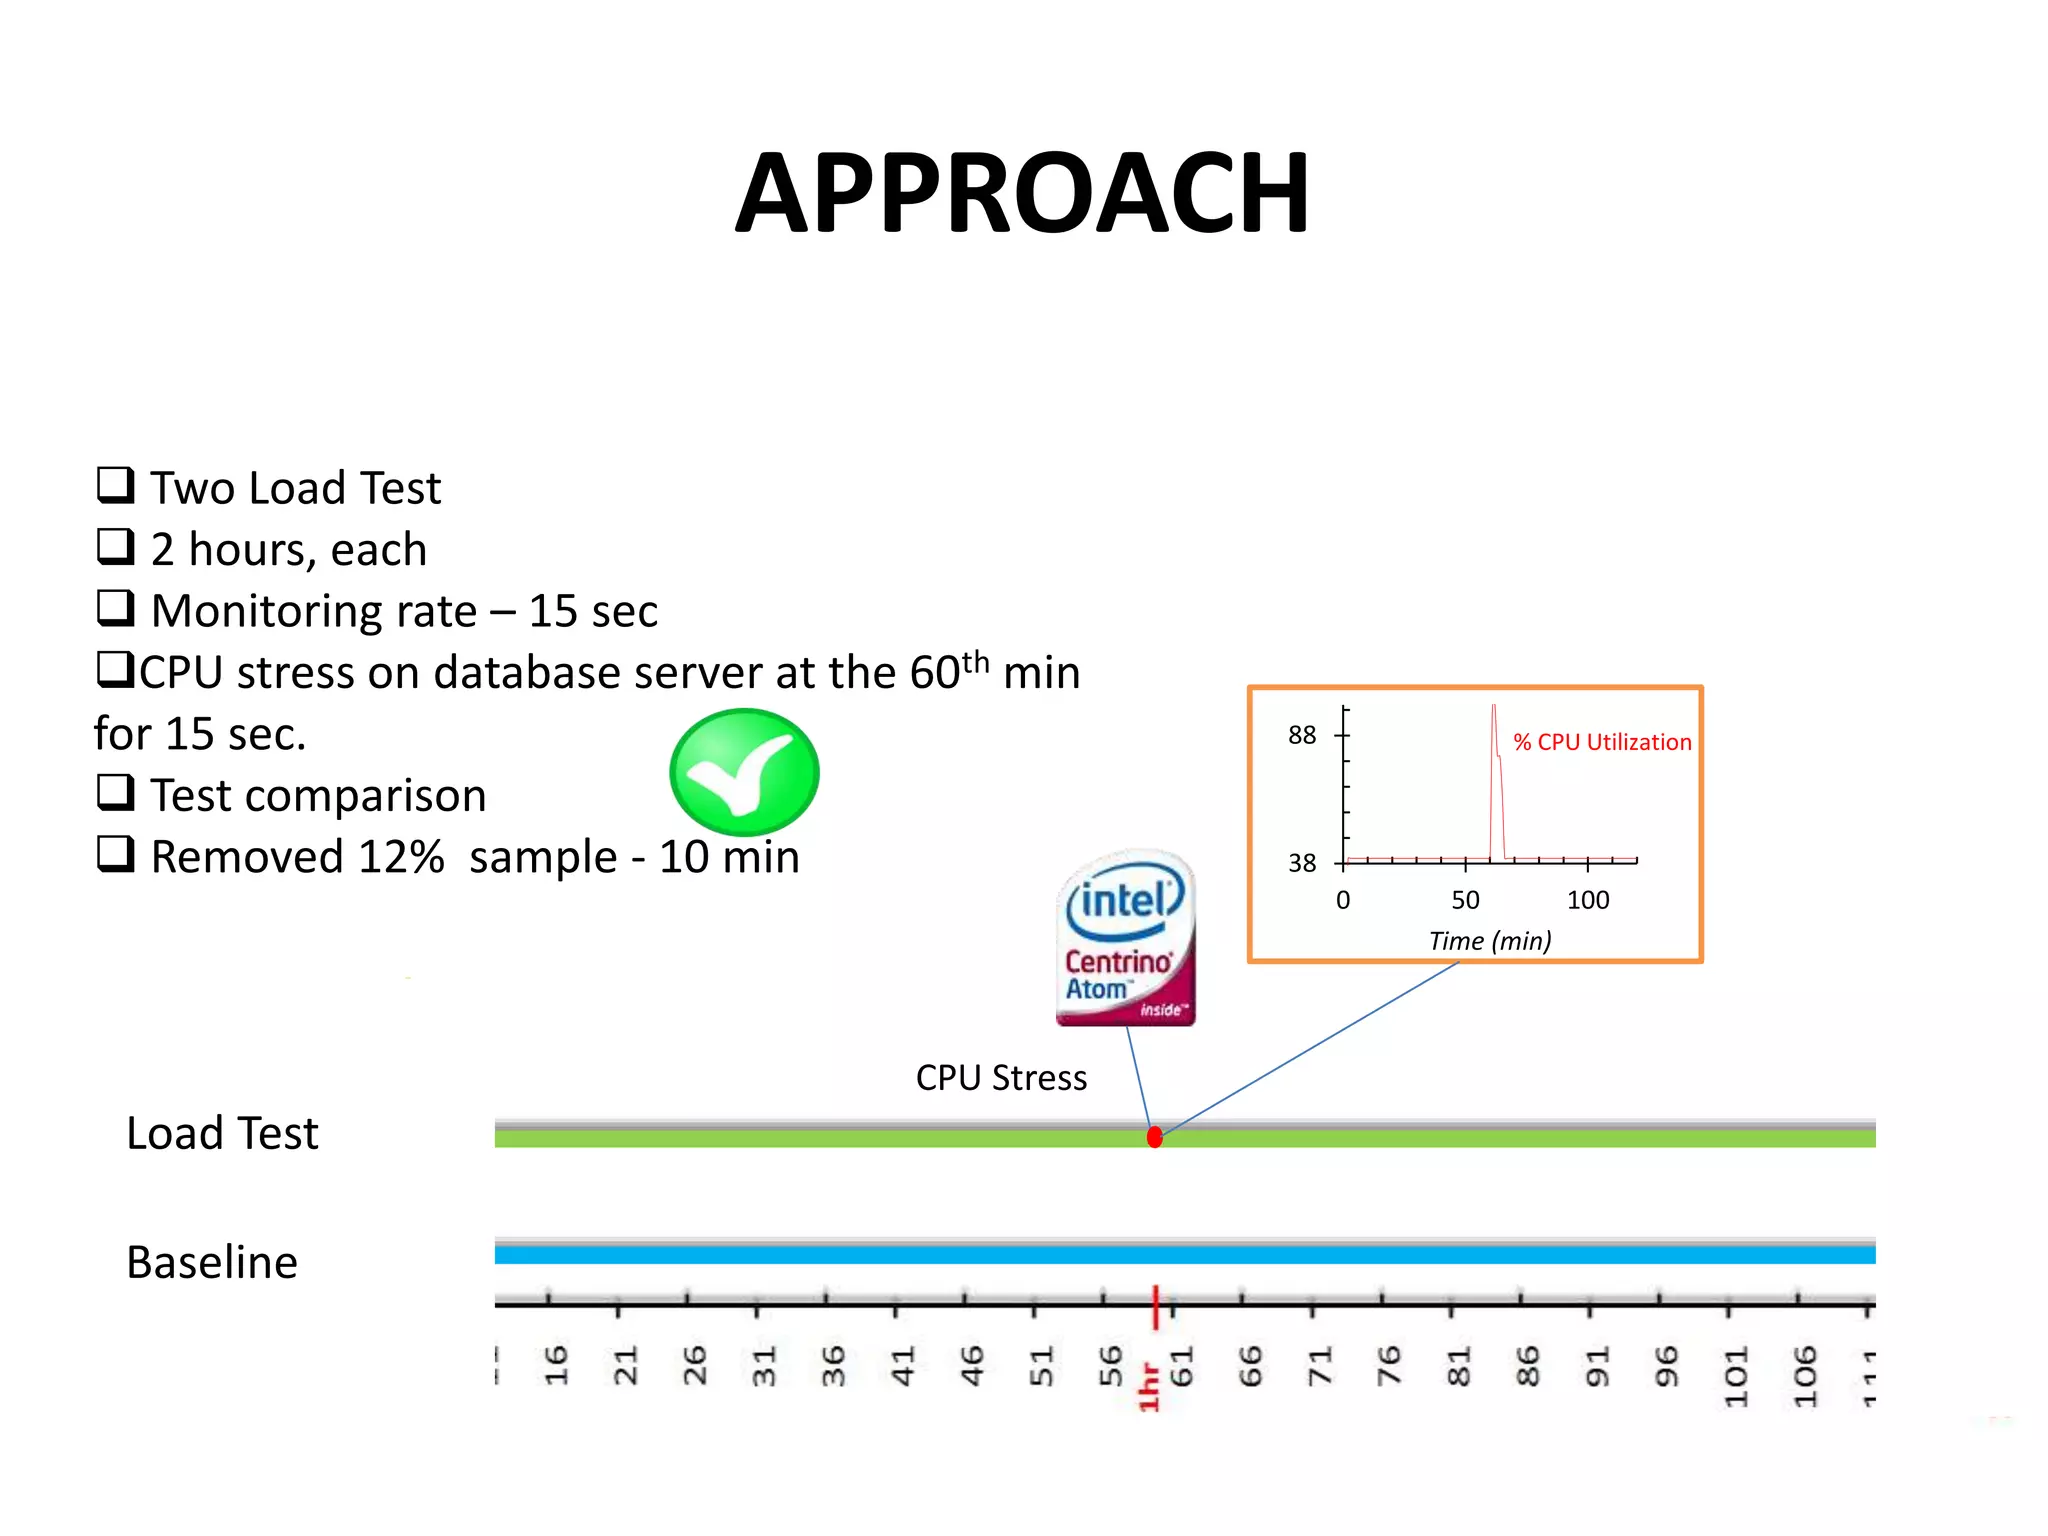
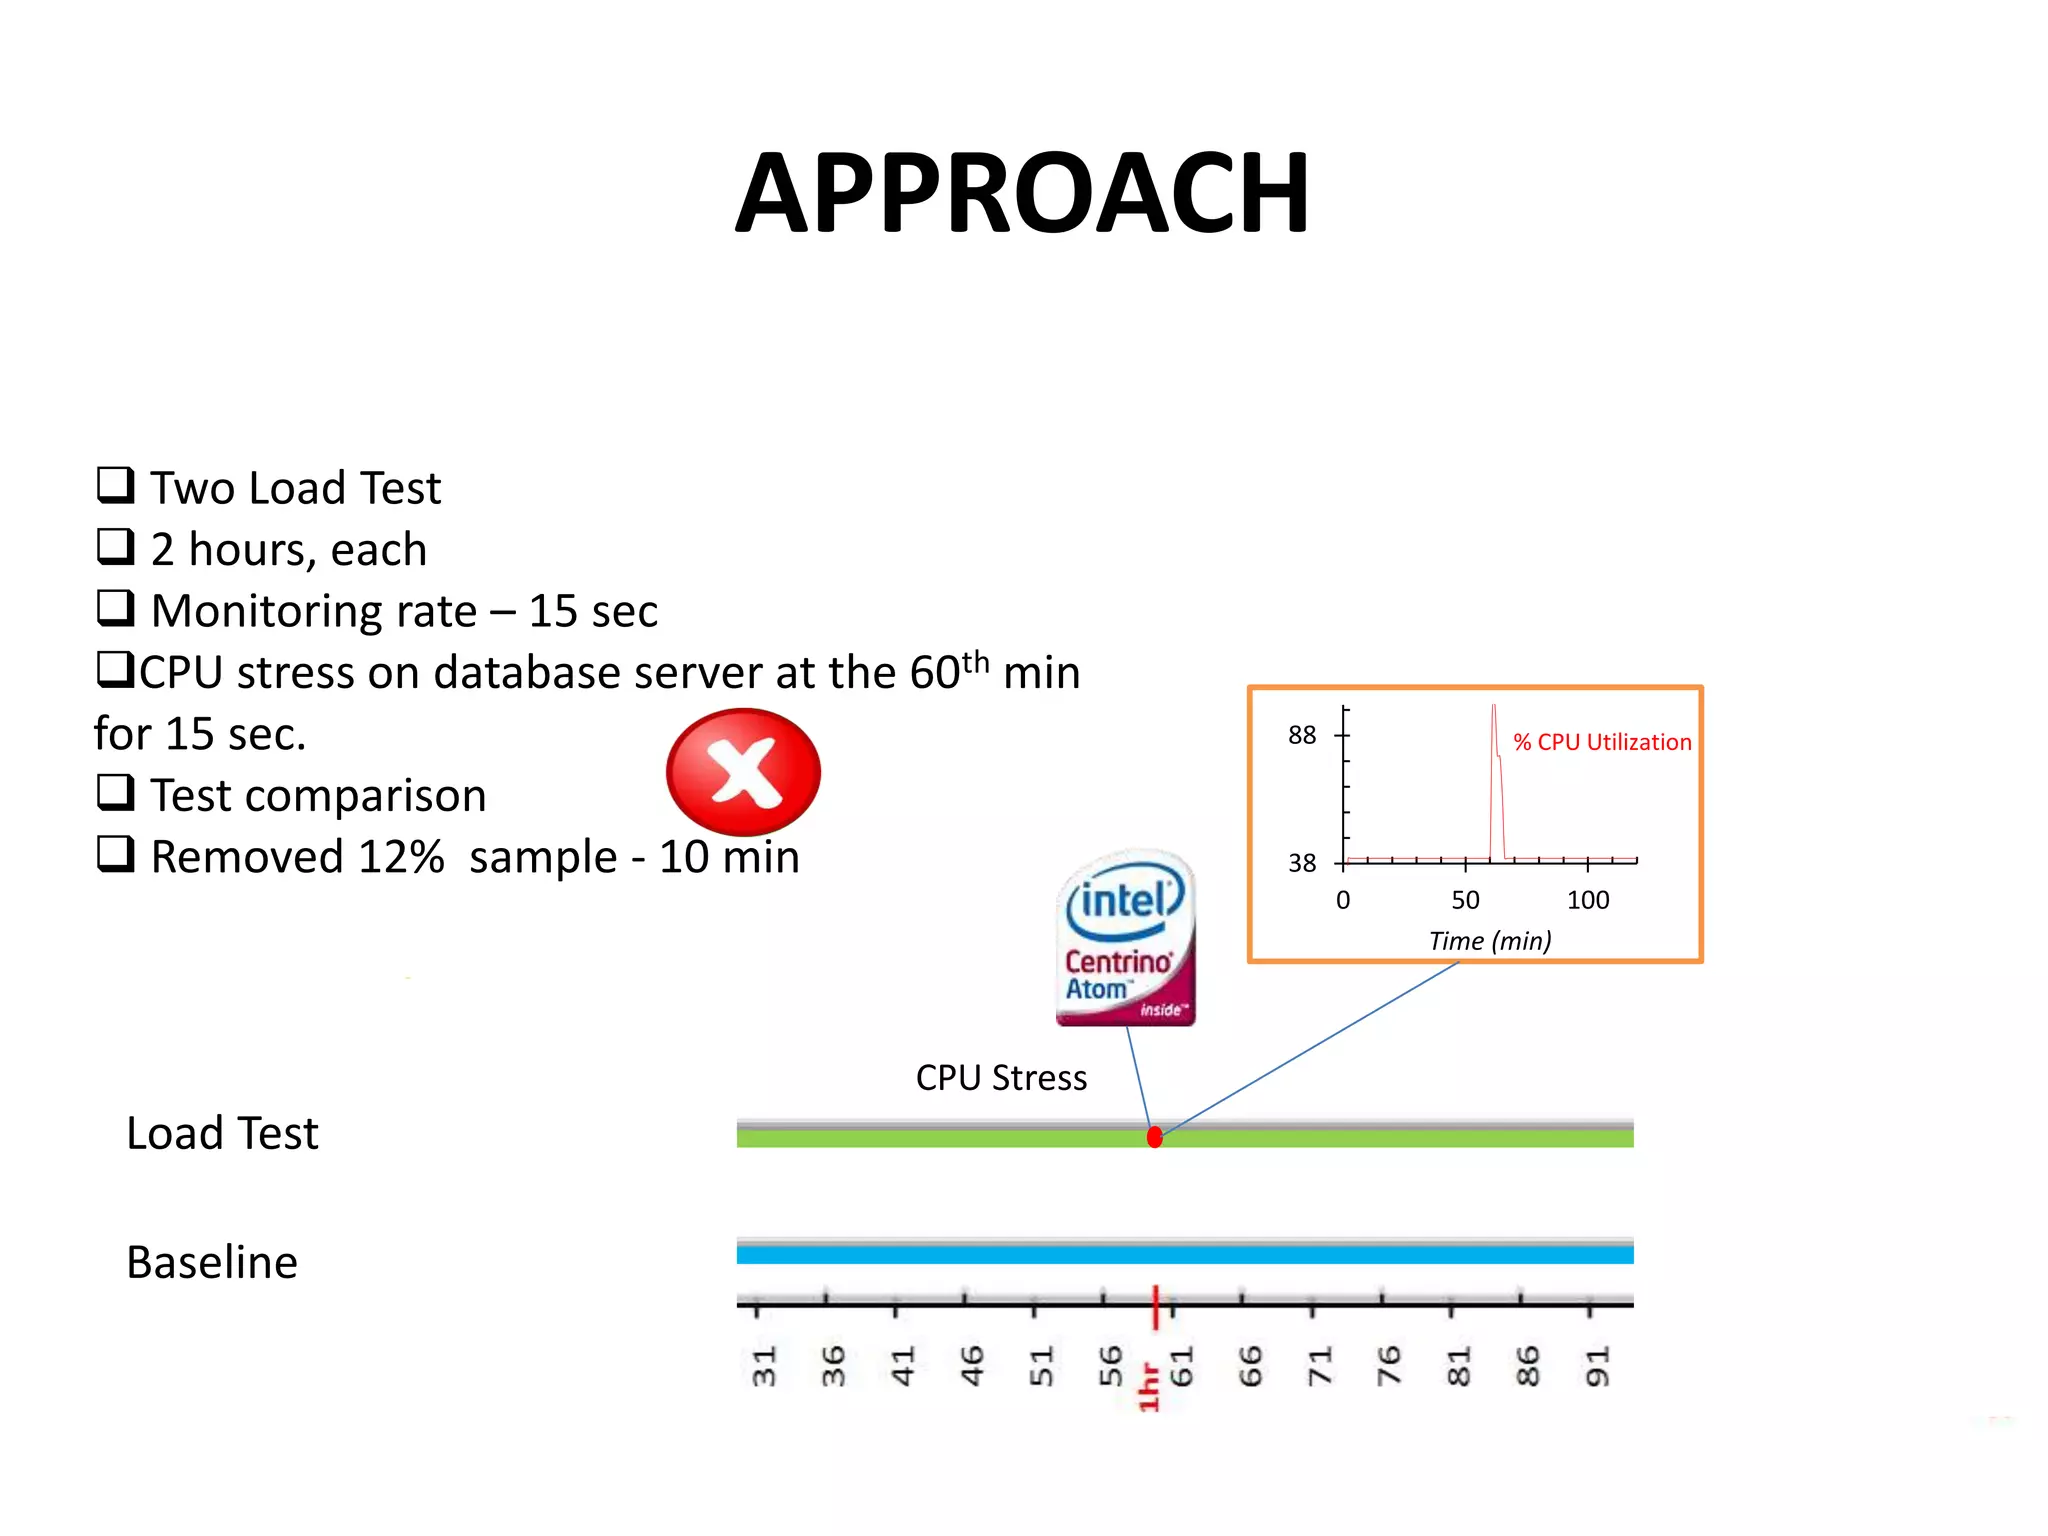
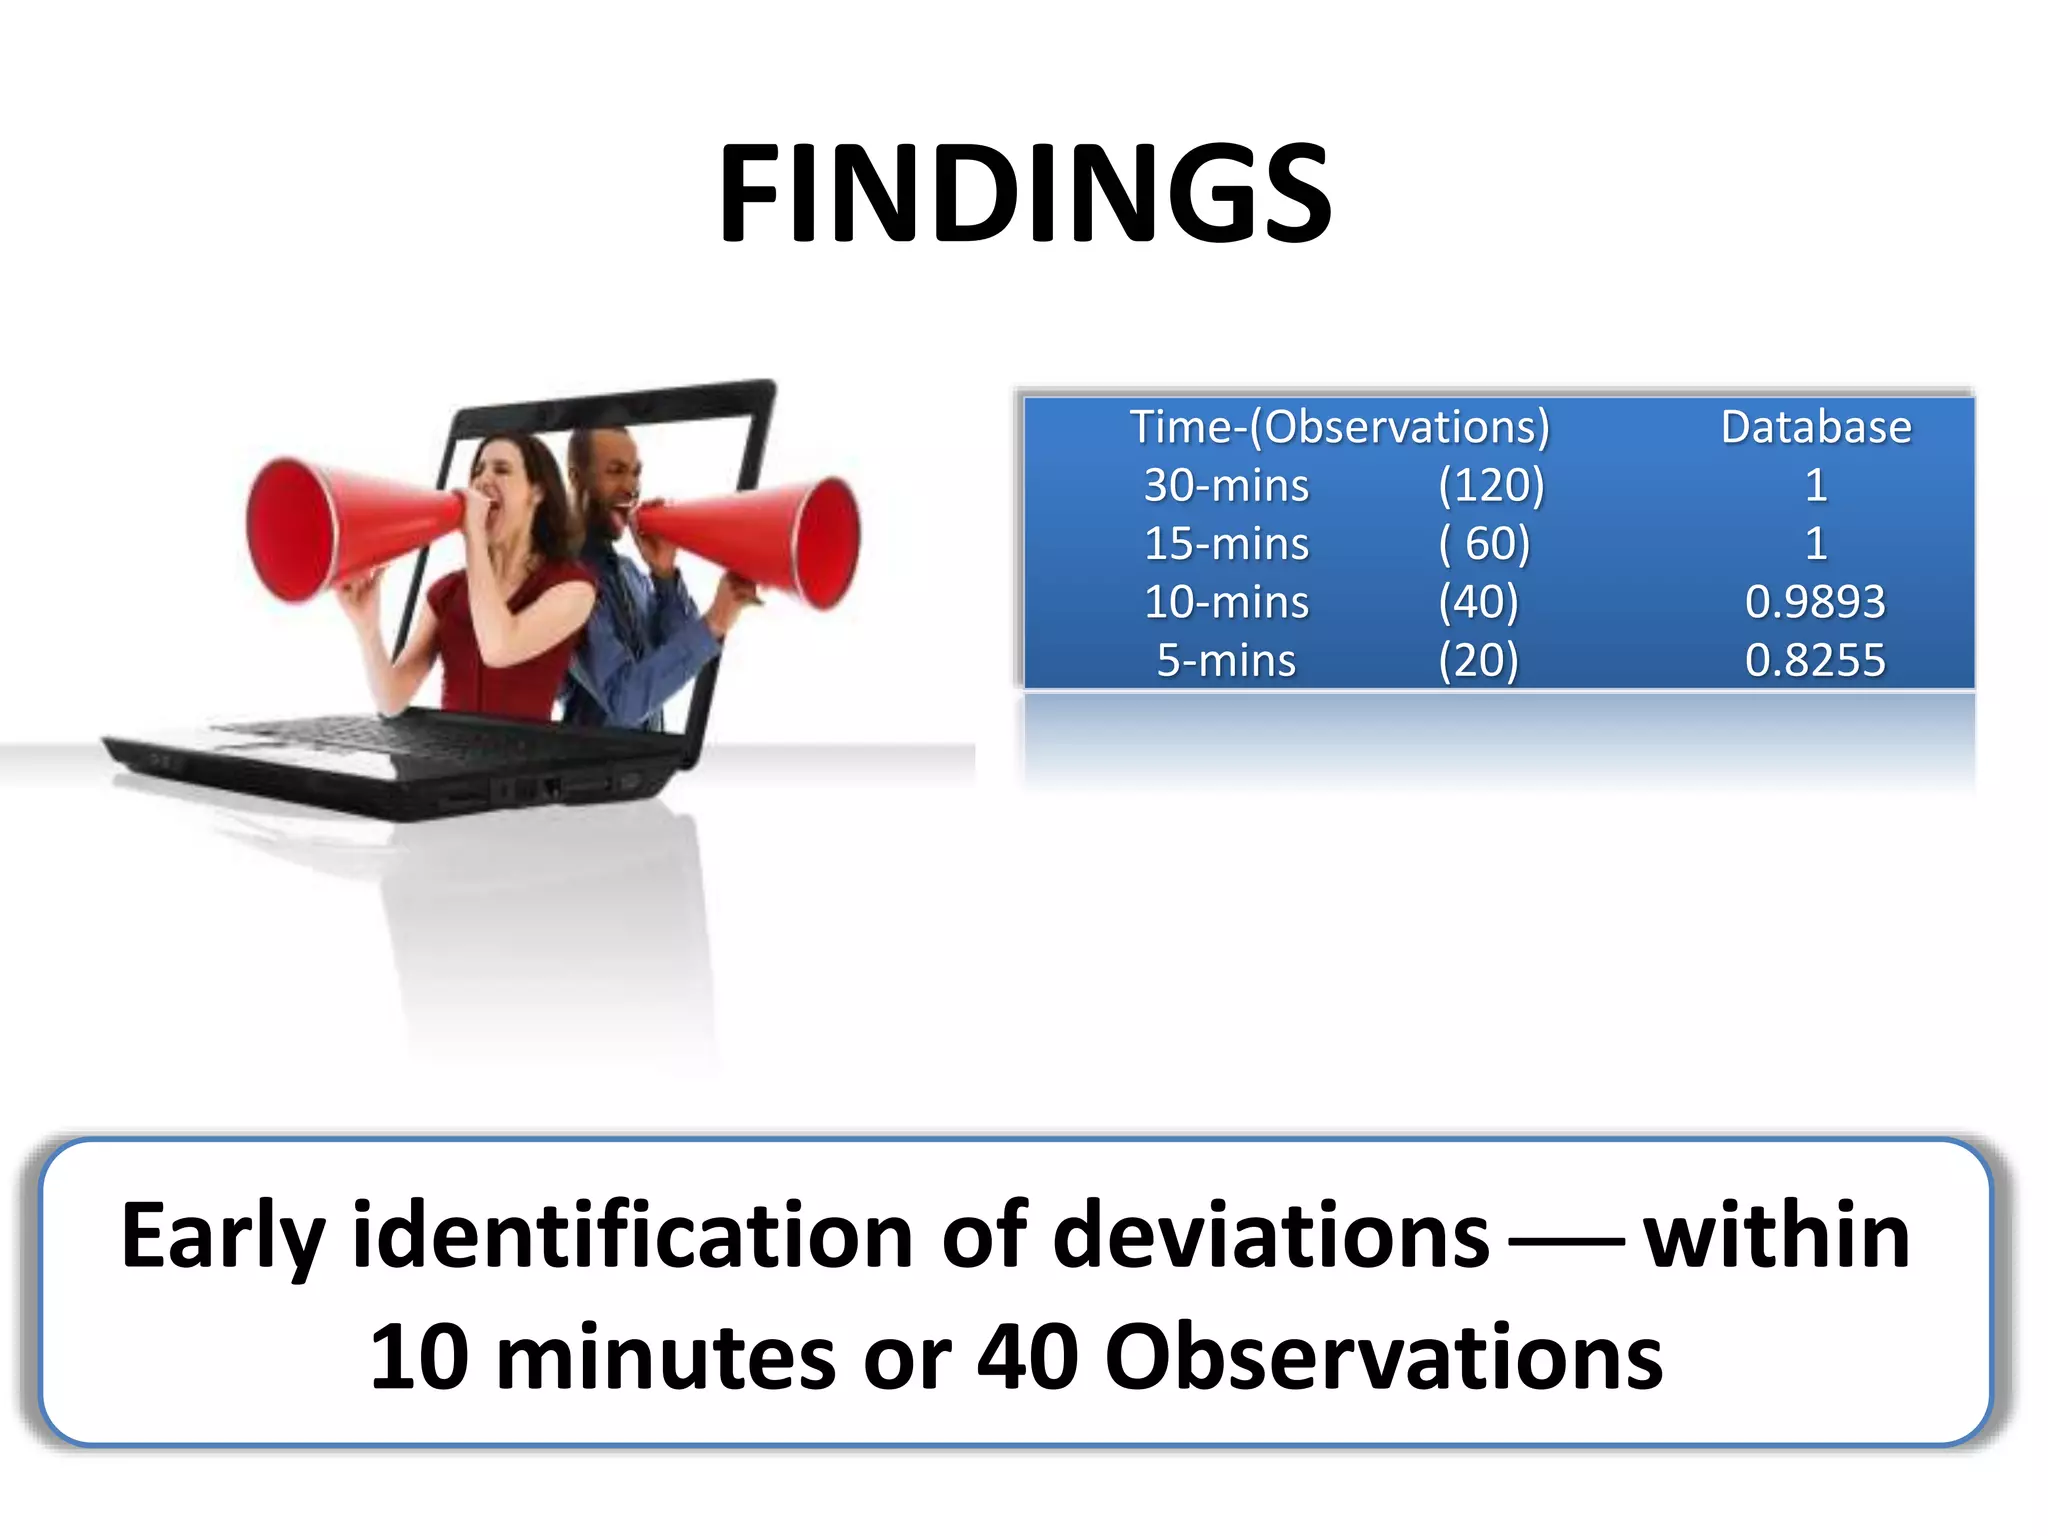
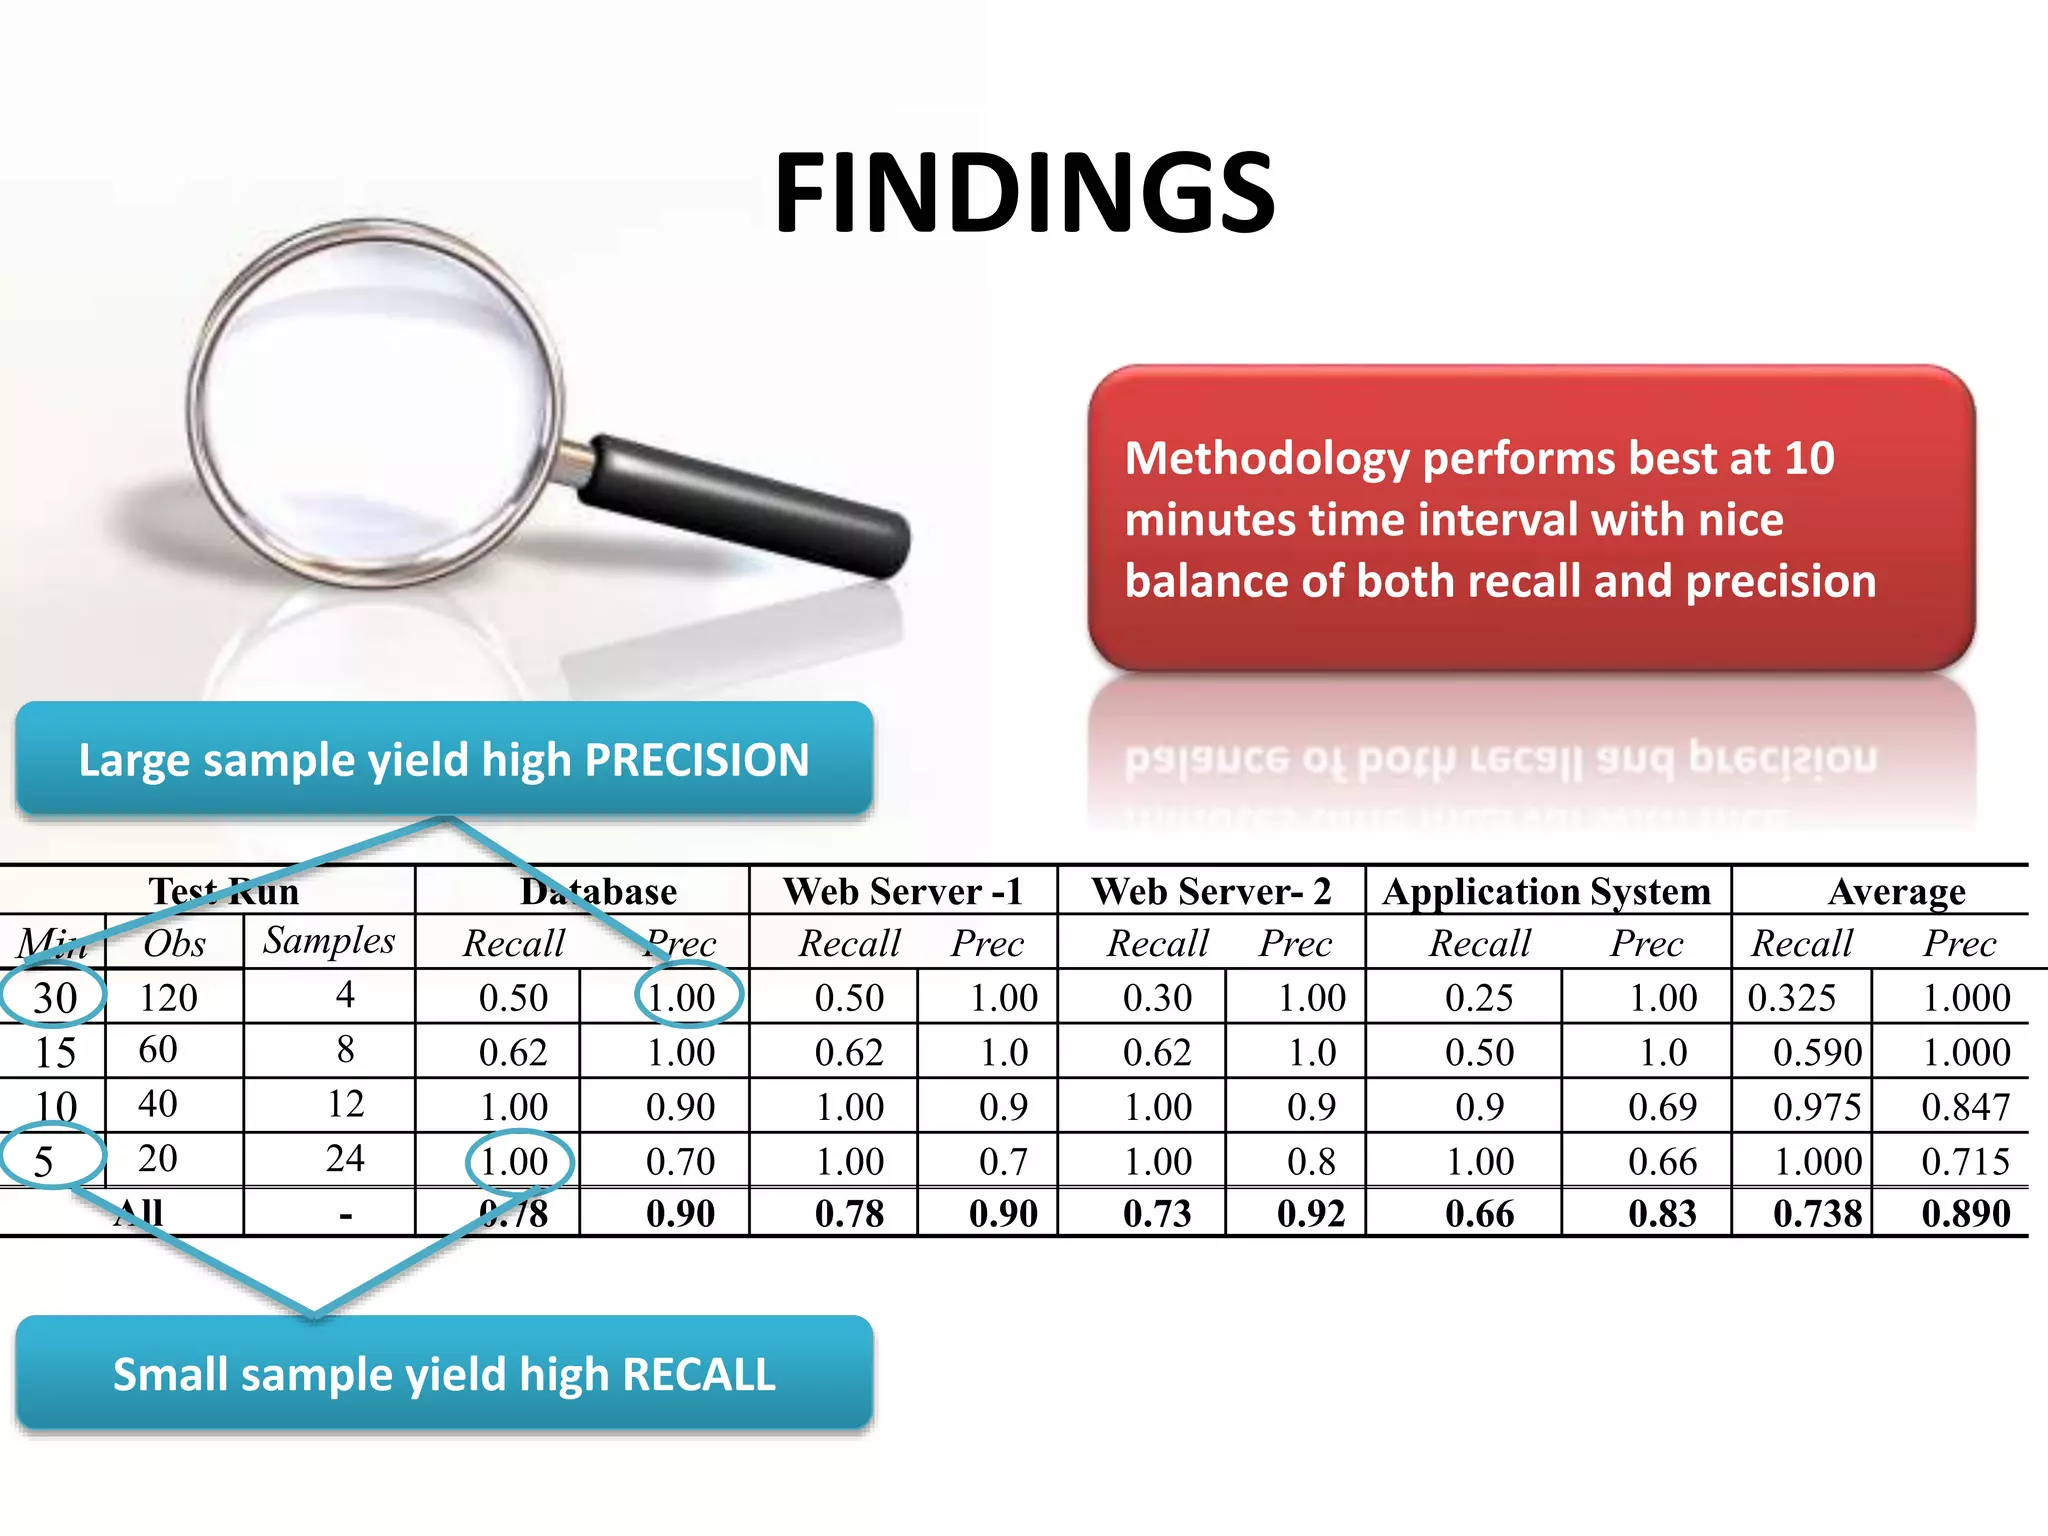
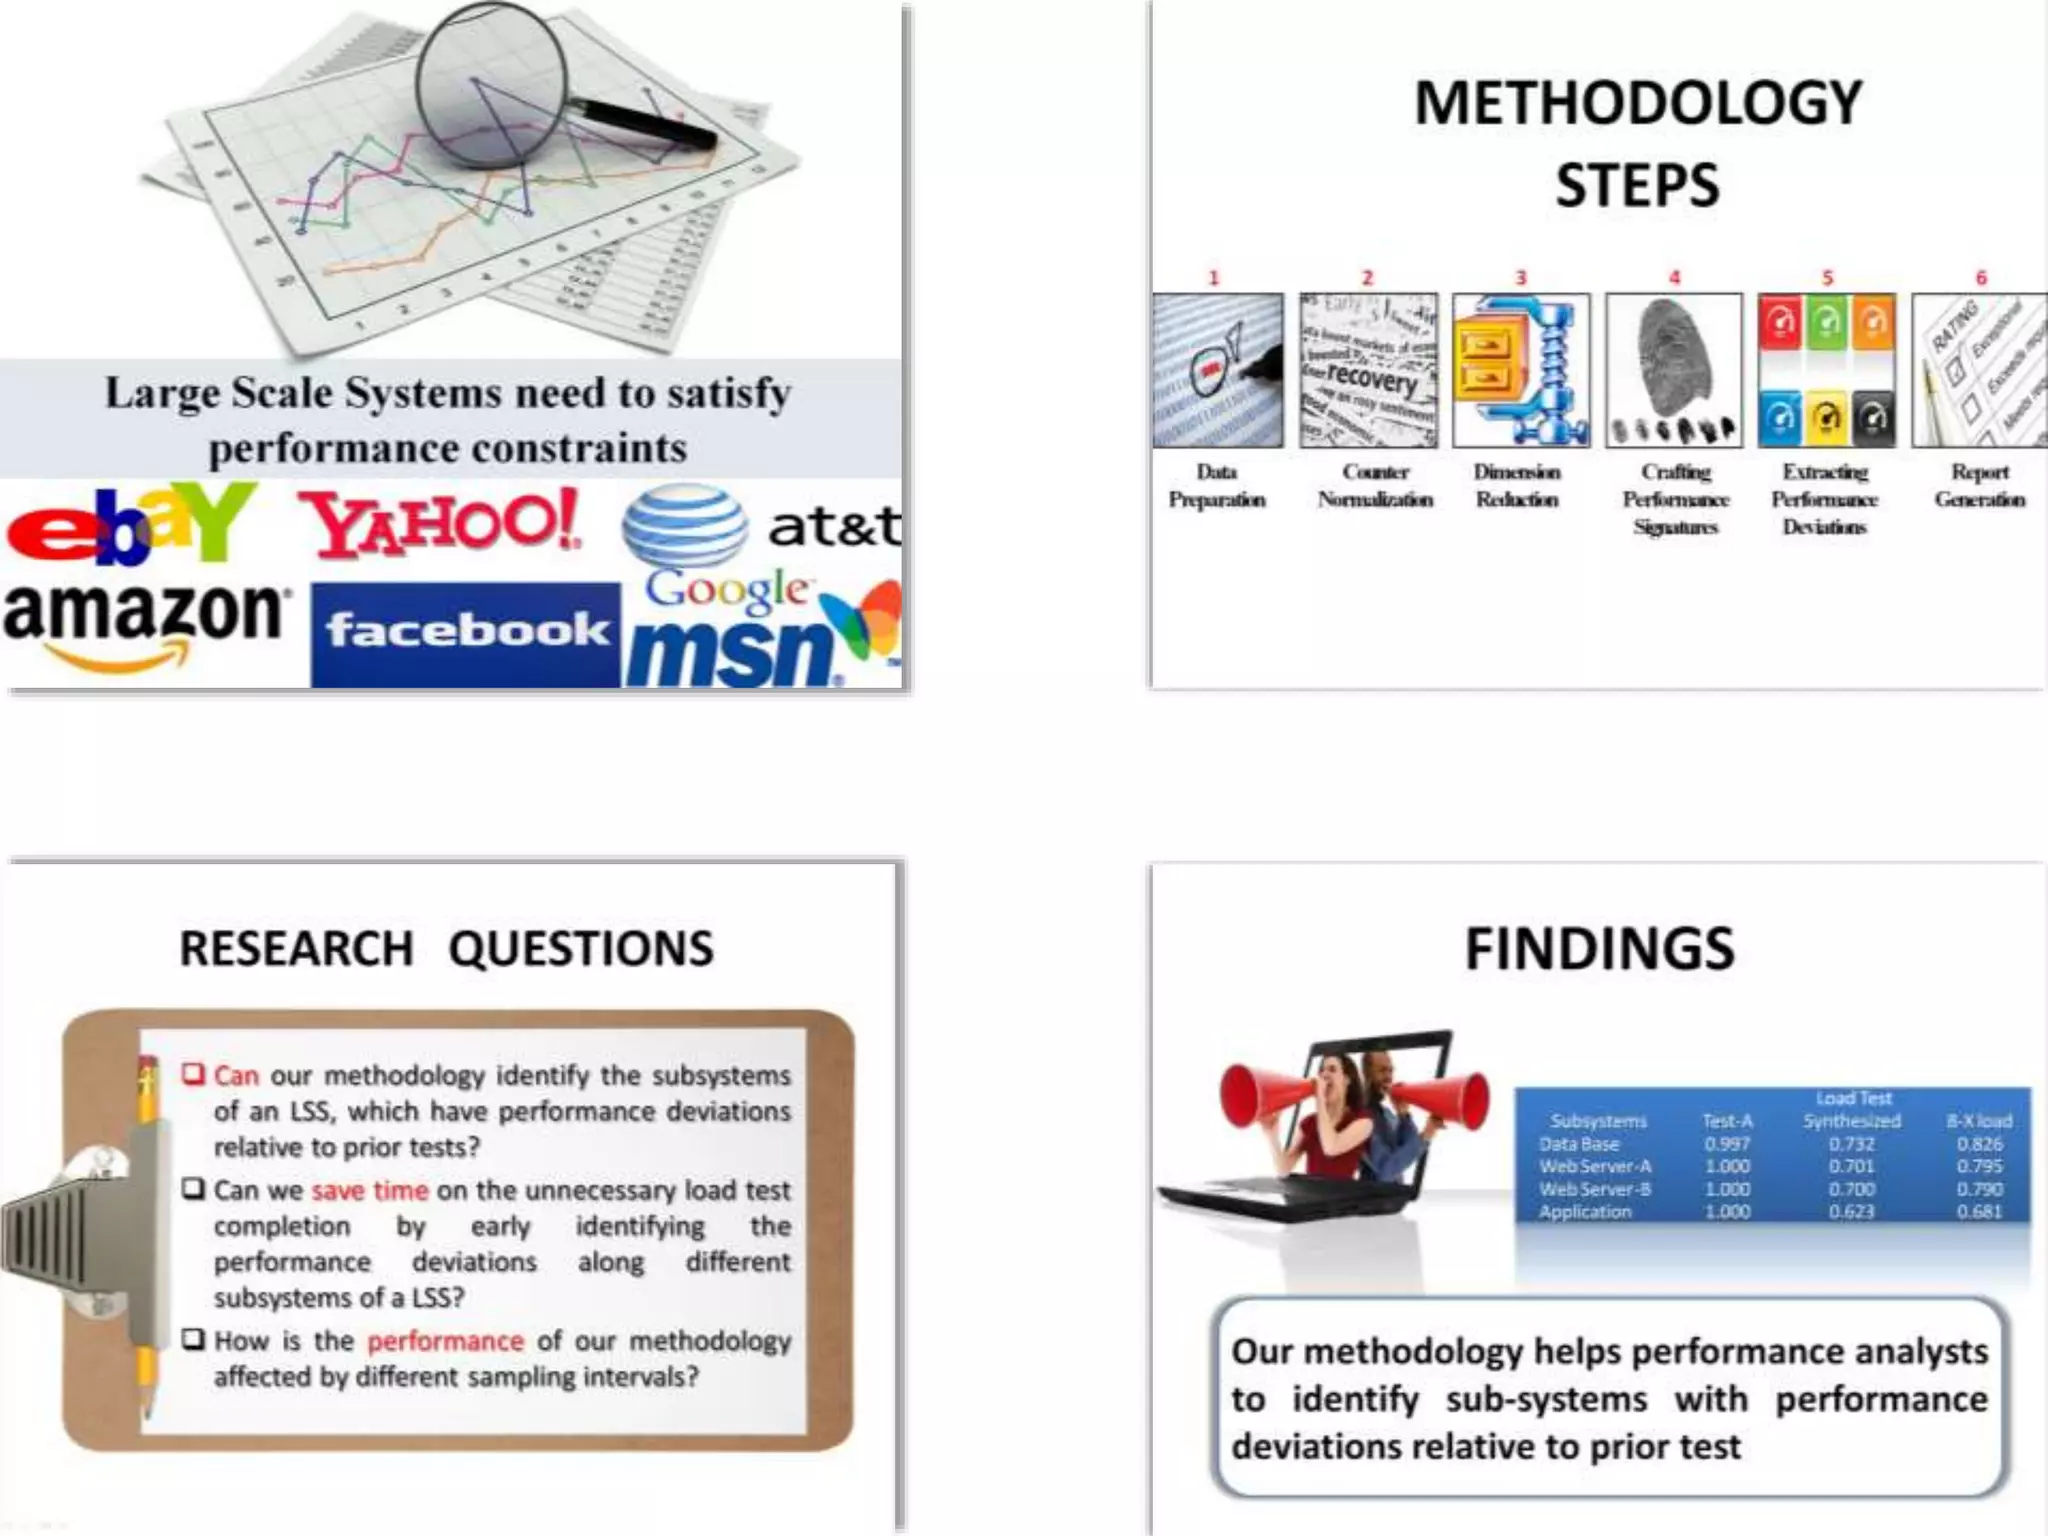
Using Load Test to Automatically Compare
the Subsystems of a Large Enterprise
System
Haroon Malik, Bram Adams & Ahmed E. Hassan
Software Analysis and Intelligence Lab (SAIL)
Queen’s University, Kingston, Canada
Parminder Flora & Gilbert Hamann
Performance Engineering
Research In Motion, Waterloo, Canada
 Today's Large scale systems (LSS) are composed of many
underlying subsystems.
 These LSS grow rapidly in size to handle growing traffic, complex
services and business critical functionality
 Performance analyst have to face the challenge of dealing with
performance bugs as processing is spread across thousands of
subsystems and mail lion of hardware nodes
LOAD
LOAD TESTING
Load Generator-1
Load Generator-2
Monitoring Tool
Performance counter Log
Performance Repository
System
Environment Setup Load test execution Load test analysis Report generation
CURRENT PRACTICE
1 2 3 4
CHALLENGES…
LARGE NUMBER OF PERFORMANCE
COUNTERS
RISK OF ERROR
Automated
Methodology
Require
d
home
Like
Just
Work
Now
really
:::::::
cool
cpt
Just man Work home
smash lunch day pretty
beer ready working
home day smash pretty
Time getting get well
dude dinner bucket
head really heading got
time night get dude got
Feeling matt dude last
4560 ut2465 like now
still good feel still next
might game today 4562
PC-1
PC-2
PC-3
Lot of Data Our Methodology Signature
METHODOLOGY
home
Like
Just
Work
Now
really
:::::::
cool
cpt
Just man Work home
smash lunch day pretty
beer ready working
home day smash pretty
Time getting get well
dude dinner bucket
head really heading got
time night get dude got
Feeling matt dude last
4560 ut2465 like now
still good feel still next
might game today 4562
PC-1
PC-2
PC-3
Lot of Data Our Methodology Signature
METHODOLOGYDatabase
Mail Web
METHODOLOGY
Commits/Sec
Writes/Sec
CPU
Utilization
Database Cache
% Hit
Subsystems Base-Line Load Test - 1 DeviationMatch
0.59
1
0.99
METHODOLOGY
STEPS
1 2 3 4 5 6
Data
Preparation
Counter
Normalization
Dimension
Reduction
Crafting
Performance
Signatures
Extracting
Performance
Deviations
Report
Generation
MEASURING THE PERFORMANCE
Base- Line
Test- 1
t1 t2 t3 t4 t5 t6
Deviations
Predicted (P)
Deviations
Occurred (O)
PO= P ∩ O
Precision = P ∩ O/ P = 1/4 = 0.25 Recall = P ∩ O/ O = 1/3 = 0.33
RESEARCH QUESTIONS
 Can our methodology identify the subsystems
of an LSS, which have performance deviations
relative to prior tests?
 Can we save time on the unnecessary load test
completion by early identifying the
performance deviations along different
subsystems of a LSS?
 How is the performance of our methodology
affected by different sampling intervals?
 Can our methodology identify the
subsystems of an LSS, which have
performance deviations relative to prior
tests?
RQ-1
APPROACH
4 Load tests  8 hours
700 performance counters each
Monitoring interval 15 sec  1922 instances
Baseline test 85% data reduction
Test-1  Baseline test reproduction
Test-2  Synthetic fault injection via mutation
Test-3  Increased the work load intensity (8X)
0.8
0.82
0.84
0.86
0.88
0.9
0.92
0.94
0.96
0.98
1
1 2 3 4 5 6 7 8 9 10 11
Base Line Test Test-A
Synthesized Test 8X- Load
Performance Counters
importance
0.8
0.82
0.84
0.86
0.88
0.9
0.92
0.94
0.96
0.98
1
1 2 3 4 5 6 7 8 9 10 11 12 13 14 15 16 17 18
Web Server- A
0.8
0.82
0.84
0.86
0.88
0.9
0.92
0.94
0.96
0.98
1
1 2 3 4 5 6 7 8 9 10 11 12 13 14 15 16 17 18
Application System
0.8
0.82
0.84
0.86
0.88
0.9
0.92
0.94
0.96
0.98
1
1 2 3 4 5 6 7 8 9 10 11 12 13 14 15 16 17 18
Web Server- B
Database
FINDINGS
Our methodology help performance analysts
to identify sub-systems with performance
deviations relative to prior tests
Subsystems
Load Test
Test-A Synthesized 8-X load
Data Base 0.997 0.732 0.826
Web Server-A 1.000 0.701 0.795
Web Server-B 1.000 0.700 0.790
Application 1.000 0.623 0.681
Can we save time on the unnecessary load
test completion by early identifying the
performance deviations along different
subsystems of a LSS?
RQ-2
35
40
45
50
55
60
65
70
75
80
1
51
101
151
201
251
301
351
401
451
501
551
601
651
701
751
801
851
901
951
Observations
% CPU Utilization
35
40
45
50
55
60
65
70
75
80
1
3
5
7
9
11
13
15
17
19
21
23
25
27
29
31
33
35
37
39
41
Observations
% CPU Utilization
Baseline
Load Test
CPU Stress
38
88
0 50 100
Time (min)
% CPU Utilization
 Two Load Test
 2 hours, each
 Monitoring rate – 15 sec
CPU stress on database server at the 60th min
for 15 sec.
 Test comparison
 Removed 12% sample - 10 min
6%
6%
APPROACH
Baseline
Load Test
CPU Stress
38
88
0 50 100
Time (min)
% CPU Utilization
 Two Load Test
 2 hours, each
 Monitoring rate – 15 sec
CPU stress on database server at the 60th min
for 15 sec.
 Test comparison
 Removed 12% sample - 10 min
6%
6%
APPROACH
Baseline
Load Test
CPU Stress
38
88
0 50 100
Time (min)
% CPU Utilization
 Two Load Test
 2 hours, each
 Monitoring rate – 15 sec
CPU stress on database server at the 60th min
for 15 sec.
 Test comparison
 Removed 12% sample - 10 min
6%
6%
APPROACH
Baseline
Load Test
CPU Stress
38
88
0 50 100
Time (min)
% CPU Utilization
 Two Load Test
 2 hours, each
 Monitoring rate – 15 sec
CPU stress on database server at the 60th min
for 15 sec.
 Test comparison
 Removed 12% sample - 10 min
6%
6%
APPROACH
Baseline
Load Test
CPU Stress
38
88
0 50 100
Time (min)
% CPU Utilization
 Two Load Test
 2 hours, each
 Monitoring rate – 15 sec
CPU stress on database server at the 60th min
for 15 sec.
 Test comparison
 Removed 12% sample - 10 min
6%
6%
APPROACH
Baseline
Load Test
CPU Stress
38
88
0 50 100
Time (min)
% CPU Utilization
 Two Load Test
 2 hours, each
 Monitoring rate – 15 sec
CPU stress on database server at the 60th min
for 15 sec.
 Test comparison
 Removed 12% sample - 10 min
6%
6%
APPROACH
Database
(30-mins)
0.8
0.82
0.84
0.86
0.88
0.9
0.92
0.94
0.96
0.98
1
1 2 3 4 5 6 7 8 9 10 11
Base-Line Test Load Test
Database
(15-mins)
0.8
0.82
0.84
0.86
0.88
0.9
0.92
0.94
0.96
0.98
1
1 2 3 4 5 6 7 8 9 10 11
0.8
0.82
0.84
0.86
0.88
0.9
0.92
0.94
0.96
0.98
1
1 2 3 4 5 6 7 8 9 10 11
Database
(10-mins)
0.8
0.82
0.84
0.86
0.88
0.9
0.92
0.94
0.96
0.98
1
1 2 3 4 5 6 7 8 9 10 11
Database
(5-mins)
Performance Counters
importance
FINDINGS
Time-(Observations) Database
30-mins (120) 1
15-mins ( 60) 1
10-mins (40) 0.9893
5-mins (20) 0.8255
Early identification of deviations  within
10 minutes or 40 Observations
How is the performance of our
methodology affected by different
sampling intervals?
RQ-3
 Two Load Test
 2 hours, Each
 Monitoring rate– 15 sec
Fault  Stopped Load Generators  10 Times- 15 sec each
 Measured the performance of methodology at different time
interval
 30 min – 4 Samples
 15 min – 8 Samples
Baseline
Load Test -1
30-min
APPROACH
Baseline
Load Test -1
30-min
 Two Load Test
 2 hours, Each
 Monitoring rate– 15 sec
Fault  Stopped Load Generators  10 Times- 15 sec each
 Measured the performance of methodology at different time
interval
 30 min – 4 Samples
 15 min – 8 Samples
APPROACH
Baseline
Load Test -130-min
 Two Load Test
 2 hours, Each
 Monitoring rate– 15 sec
Fault  Stopped Load Generators  10 Times- 15 sec each
 Measured the performance of methodology at different time
interval
 30 min – 4 Samples
 15 min – 8 Samples
15-min
APPROACH
Small sample yield high RECALL
FINDINGS
Test Run Database Web Server -1 Web Server- 2 Application System Average
Min Obs Samples Recall Prec Recall Prec Recall Prec Recall Prec Recall Prec
30 120 4 0.50 1.00 0.50 1.00 0.30 1.00 0.25 1.00 0.325 1.000
15 60 8 0.62 1.00 0.62 1.0 0.62 1.0 0.50 1.0 0.590 1.000
10 40 12 1.00 0.90 1.00 0.9 1.00 0.9 0.9 0.69 0.975 0.847
5 20 24 1.00 0.70 1.00 0.7 1.00 0.8 1.00 0.66 1.000 0.715
All - 0.78 0.90 0.78 0.90 0.73 0.92 0.66 0.83 0.738 0.890
Large sample yield high PRECISION
Methodology performs best at 10
minutes time interval with nice
balance of both recall and precision
Compsac2010 malik

Compsac2010 malik

  • 1.
    Using Load Testto Automatically Compare the Subsystems of a Large Enterprise System Haroon Malik, Bram Adams & Ahmed E. Hassan Software Analysis and Intelligence Lab (SAIL) Queen’s University, Kingston, Canada Parminder Flora & Gilbert Hamann Performance Engineering Research In Motion, Waterloo, Canada
  • 2.
     Today's Largescale systems (LSS) are composed of many underlying subsystems.  These LSS grow rapidly in size to handle growing traffic, complex services and business critical functionality  Performance analyst have to face the challenge of dealing with performance bugs as processing is spread across thousands of subsystems and mail lion of hardware nodes
  • 3.
  • 4.
    LOAD TESTING Load Generator-1 LoadGenerator-2 Monitoring Tool Performance counter Log Performance Repository System
  • 5.
    Environment Setup Loadtest execution Load test analysis Report generation CURRENT PRACTICE 1 2 3 4
  • 6.
  • 7.
    LARGE NUMBER OFPERFORMANCE COUNTERS
  • 9.
  • 10.
  • 11.
    home Like Just Work Now really ::::::: cool cpt Just man Workhome smash lunch day pretty beer ready working home day smash pretty Time getting get well dude dinner bucket head really heading got time night get dude got Feeling matt dude last 4560 ut2465 like now still good feel still next might game today 4562 PC-1 PC-2 PC-3 Lot of Data Our Methodology Signature METHODOLOGY
  • 12.
    home Like Just Work Now really ::::::: cool cpt Just man Workhome smash lunch day pretty beer ready working home day smash pretty Time getting get well dude dinner bucket head really heading got time night get dude got Feeling matt dude last 4560 ut2465 like now still good feel still next might game today 4562 PC-1 PC-2 PC-3 Lot of Data Our Methodology Signature METHODOLOGYDatabase Mail Web
  • 13.
  • 14.
    METHODOLOGY STEPS 1 2 34 5 6 Data Preparation Counter Normalization Dimension Reduction Crafting Performance Signatures Extracting Performance Deviations Report Generation
  • 16.
    MEASURING THE PERFORMANCE Base-Line Test- 1 t1 t2 t3 t4 t5 t6 Deviations Predicted (P) Deviations Occurred (O) PO= P ∩ O Precision = P ∩ O/ P = 1/4 = 0.25 Recall = P ∩ O/ O = 1/3 = 0.33
  • 17.
    RESEARCH QUESTIONS  Canour methodology identify the subsystems of an LSS, which have performance deviations relative to prior tests?  Can we save time on the unnecessary load test completion by early identifying the performance deviations along different subsystems of a LSS?  How is the performance of our methodology affected by different sampling intervals?
  • 18.
     Can ourmethodology identify the subsystems of an LSS, which have performance deviations relative to prior tests? RQ-1
  • 19.
    APPROACH 4 Load tests 8 hours 700 performance counters each Monitoring interval 15 sec  1922 instances Baseline test 85% data reduction Test-1  Baseline test reproduction Test-2  Synthetic fault injection via mutation Test-3  Increased the work load intensity (8X)
  • 20.
    0.8 0.82 0.84 0.86 0.88 0.9 0.92 0.94 0.96 0.98 1 1 2 34 5 6 7 8 9 10 11 Base Line Test Test-A Synthesized Test 8X- Load Performance Counters importance 0.8 0.82 0.84 0.86 0.88 0.9 0.92 0.94 0.96 0.98 1 1 2 3 4 5 6 7 8 9 10 11 12 13 14 15 16 17 18 Web Server- A 0.8 0.82 0.84 0.86 0.88 0.9 0.92 0.94 0.96 0.98 1 1 2 3 4 5 6 7 8 9 10 11 12 13 14 15 16 17 18 Application System 0.8 0.82 0.84 0.86 0.88 0.9 0.92 0.94 0.96 0.98 1 1 2 3 4 5 6 7 8 9 10 11 12 13 14 15 16 17 18 Web Server- B Database
  • 21.
    FINDINGS Our methodology helpperformance analysts to identify sub-systems with performance deviations relative to prior tests Subsystems Load Test Test-A Synthesized 8-X load Data Base 0.997 0.732 0.826 Web Server-A 1.000 0.701 0.795 Web Server-B 1.000 0.700 0.790 Application 1.000 0.623 0.681
  • 22.
    Can we savetime on the unnecessary load test completion by early identifying the performance deviations along different subsystems of a LSS? RQ-2
  • 23.
  • 24.
  • 25.
    Baseline Load Test CPU Stress 38 88 050 100 Time (min) % CPU Utilization  Two Load Test  2 hours, each  Monitoring rate – 15 sec CPU stress on database server at the 60th min for 15 sec.  Test comparison  Removed 12% sample - 10 min 6% 6% APPROACH
  • 26.
    Baseline Load Test CPU Stress 38 88 050 100 Time (min) % CPU Utilization  Two Load Test  2 hours, each  Monitoring rate – 15 sec CPU stress on database server at the 60th min for 15 sec.  Test comparison  Removed 12% sample - 10 min 6% 6% APPROACH
  • 27.
    Baseline Load Test CPU Stress 38 88 050 100 Time (min) % CPU Utilization  Two Load Test  2 hours, each  Monitoring rate – 15 sec CPU stress on database server at the 60th min for 15 sec.  Test comparison  Removed 12% sample - 10 min 6% 6% APPROACH
  • 28.
    Baseline Load Test CPU Stress 38 88 050 100 Time (min) % CPU Utilization  Two Load Test  2 hours, each  Monitoring rate – 15 sec CPU stress on database server at the 60th min for 15 sec.  Test comparison  Removed 12% sample - 10 min 6% 6% APPROACH
  • 29.
    Baseline Load Test CPU Stress 38 88 050 100 Time (min) % CPU Utilization  Two Load Test  2 hours, each  Monitoring rate – 15 sec CPU stress on database server at the 60th min for 15 sec.  Test comparison  Removed 12% sample - 10 min 6% 6% APPROACH
  • 30.
    Baseline Load Test CPU Stress 38 88 050 100 Time (min) % CPU Utilization  Two Load Test  2 hours, each  Monitoring rate – 15 sec CPU stress on database server at the 60th min for 15 sec.  Test comparison  Removed 12% sample - 10 min 6% 6% APPROACH
  • 31.
    Database (30-mins) 0.8 0.82 0.84 0.86 0.88 0.9 0.92 0.94 0.96 0.98 1 1 2 34 5 6 7 8 9 10 11 Base-Line Test Load Test Database (15-mins) 0.8 0.82 0.84 0.86 0.88 0.9 0.92 0.94 0.96 0.98 1 1 2 3 4 5 6 7 8 9 10 11 0.8 0.82 0.84 0.86 0.88 0.9 0.92 0.94 0.96 0.98 1 1 2 3 4 5 6 7 8 9 10 11 Database (10-mins) 0.8 0.82 0.84 0.86 0.88 0.9 0.92 0.94 0.96 0.98 1 1 2 3 4 5 6 7 8 9 10 11 Database (5-mins) Performance Counters importance
  • 32.
    FINDINGS Time-(Observations) Database 30-mins (120)1 15-mins ( 60) 1 10-mins (40) 0.9893 5-mins (20) 0.8255 Early identification of deviations  within 10 minutes or 40 Observations
  • 33.
    How is theperformance of our methodology affected by different sampling intervals? RQ-3
  • 34.
     Two LoadTest  2 hours, Each  Monitoring rate– 15 sec Fault  Stopped Load Generators  10 Times- 15 sec each  Measured the performance of methodology at different time interval  30 min – 4 Samples  15 min – 8 Samples Baseline Load Test -1 30-min APPROACH
  • 35.
    Baseline Load Test -1 30-min Two Load Test  2 hours, Each  Monitoring rate– 15 sec Fault  Stopped Load Generators  10 Times- 15 sec each  Measured the performance of methodology at different time interval  30 min – 4 Samples  15 min – 8 Samples APPROACH
  • 36.
    Baseline Load Test -130-min Two Load Test  2 hours, Each  Monitoring rate– 15 sec Fault  Stopped Load Generators  10 Times- 15 sec each  Measured the performance of methodology at different time interval  30 min – 4 Samples  15 min – 8 Samples 15-min APPROACH
  • 37.
    Small sample yieldhigh RECALL FINDINGS Test Run Database Web Server -1 Web Server- 2 Application System Average Min Obs Samples Recall Prec Recall Prec Recall Prec Recall Prec Recall Prec 30 120 4 0.50 1.00 0.50 1.00 0.30 1.00 0.25 1.00 0.325 1.000 15 60 8 0.62 1.00 0.62 1.0 0.62 1.0 0.50 1.0 0.590 1.000 10 40 12 1.00 0.90 1.00 0.9 1.00 0.9 0.9 0.69 0.975 0.847 5 20 24 1.00 0.70 1.00 0.7 1.00 0.8 1.00 0.66 1.000 0.715 All - 0.78 0.90 0.78 0.90 0.73 0.92 0.66 0.83 0.738 0.890 Large sample yield high PRECISION Methodology performs best at 10 minutes time interval with nice balance of both recall and precision

Editor's Notes

  • #3 Today's LSS such as Google, eBay ,Facebook and Amazon are composed of many underlying components and subsystems. These LSS grow rapidly in size to handle growing traffic, complex services and business critical functionality. This exponential growth increases the individual component’s complexity and hence, the integration between the geographically distributed components. - The performance of LSS is periodically measured to satisfy the high business demands on system quality, availability and responsive.
  • #4  -Load testing is an important weapon in LSS development to uncover functional and performance problems of a system under load Performance of the LSS is calibrated using Load test before it becomes a field or post-deployment problem. -Performance problems include an application not responding fast enough, crashing or hanging under heavy load or not meeting the desired service level agreements (SLA).
  • #6 Environment-Setup: First but the most important phase of the load testing. As the most common load test failures occurs due to improper environment setup for load tests. The environment setup includes installing the applications and load testing tools on different machines and possibly on different operating systems Load generators, which emulates the users interaction with the systems, need to carefully configured to match the real workload in field. Load Test Execution: It involves starting the components of the system under test, i.e., starting required services, hardware resources and tools ( load generators and performance monitors). Performance counter are recorded in this step too. Load Test Analysis: This step involves comparing the results of a load test against an other load tests results or against predefined thresh holds as baselines. Unlike functional and unit testing, which results in pass of failure classification for each test; load testing requires additional quantitative metrics like response time, throughput and hardware resources utilization to summarize results. The performance analysts selects few of the important performance counters among thousands collected. Based on his experience and domain knowledge performance analyst manually compare the selected performance counters with those of past runs to look for evidence of performance deviations, for example using plots and performing correlations tests. Report Generation: Includes filing the performance deviations, if found, based on the personal judgment of an analysts. Mostly the results produced are verified by an experience analysts. Based on the extent of performance deviation and its relevance to team responsible for handling the subsystems i.e., (database, application, web system etc.)
  • #7 - Unfortunately, the current practice to analyze load test is costly, time consuming and error prone. This is due to the fact that the load test analysis practices have not kept pace with the rapid growth in size and complexity of the large enterprise systems. In practice, the dominant tools and techniques to analyze large distributed systems have remained unchanged for over twenty years Most of the research had focus on the automatic generation of load testing suits rather then load test analysis - There are many challenges and limitation associated with the current practices of load test analysis that remains unsolved
  • #8  - Last from computer of hours to several days. They generate performance logs that can be of terra bytes in size Even logging all counters on typical machine at 1Hz generates about 8.6 million values in a single weeks A cluster of 12 machine over a week –13 TB of performance counter data per week. Assuming 64 bit representation for each counter value. Analysis of such large counter log is still a bit challenge in load tests.
  • #9 Performance analysts in LSS have only limited time to reach and complete diagnostics on performance counter logs and to make necessary configuration changes. Load testing is usually the last step in an already tight and usually delayed release schedule. Hence, managers are always eager to reduce the time allocated for performance testing.
  • #10 Error prone because of manual process involved in analyzing performance counter data in current practice Impossible for an analyst to skim through large volume of log data, indeed they analyst use few key performance counters know to them from past practices, performance experts and domain trends as ‘ rule of thumbs’. With large scale system that are continuously being evlved by adding new functionalities, applying same rules of thumb can mislead performance issues.
  • #11 Due to these challenges, we believe the current practice to perform load test analysis is neither effective nor sufficient to uncover performance deviations accurately and in limited time. -
  • #15 1) The performance log obtained from a load test do not suffice for direct analysis by our methodology. These logs need to be prepared to make them suitable for statistical techniques employed by our methodology. In this step take care of data sanitization (missing counter variables and incomplete counter variables) and pre-treatment of data such as standardization and data scaling to remove the biasing of variance depended techniques.