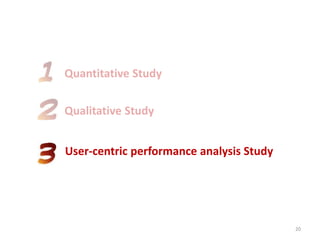
This document summarizes three empirical studies on software performance bugs:
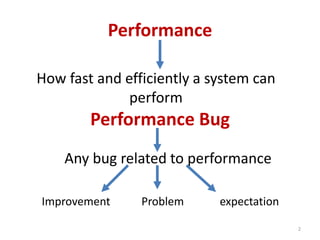
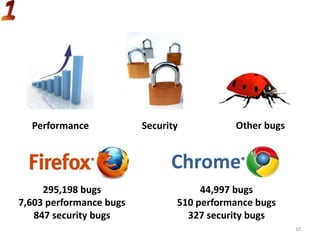
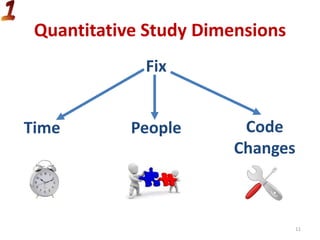
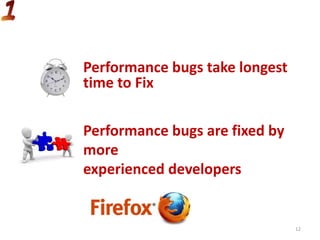
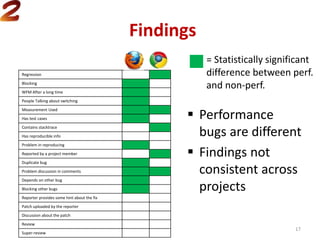
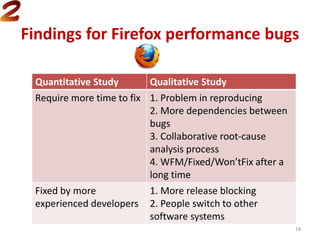
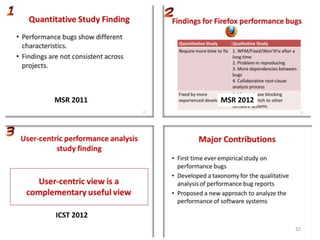
1. A quantitative study found performance bugs have different characteristics than other bugs, such as taking longer to fix, but findings were not consistent across projects.
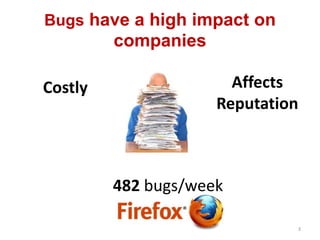
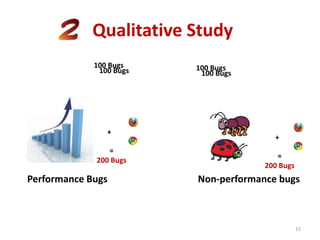
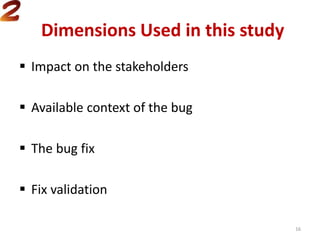
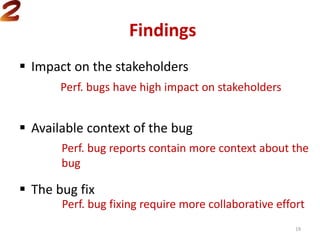
2. A qualitative study of bug reports found performance bugs have a higher impact, more context in reports, and require more collaborative fixing.
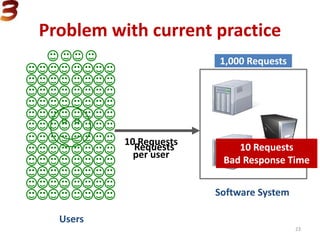
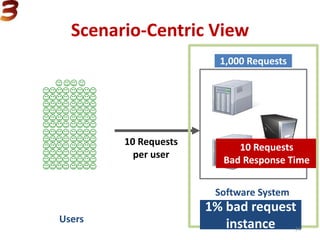
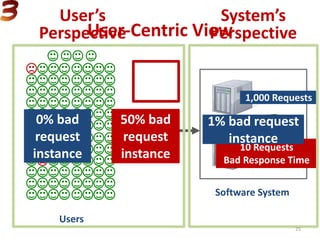
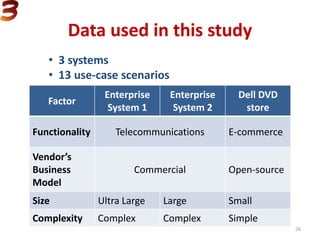
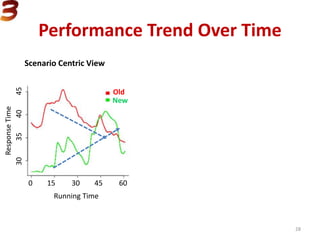
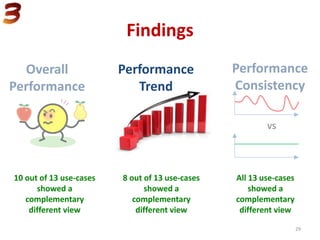
3. A user-centric performance analysis study found examining performance from users' perspectives provided a complementary view to traditional scenario-centric analyses. Considering individual users revealed different performance trends and consistency than aggregate analyses.


![20260201 [FOSDEM] gomodjail - library sandboxing for Go modules.pdf](https://cdn.slidesharecdn.com/ss_thumbnails/20260201fosdemgomodjail-librarysandboxingforgomodules-260201225659-76609ec4-thumbnail.jpg?width=640&height=640&fit=bounds)