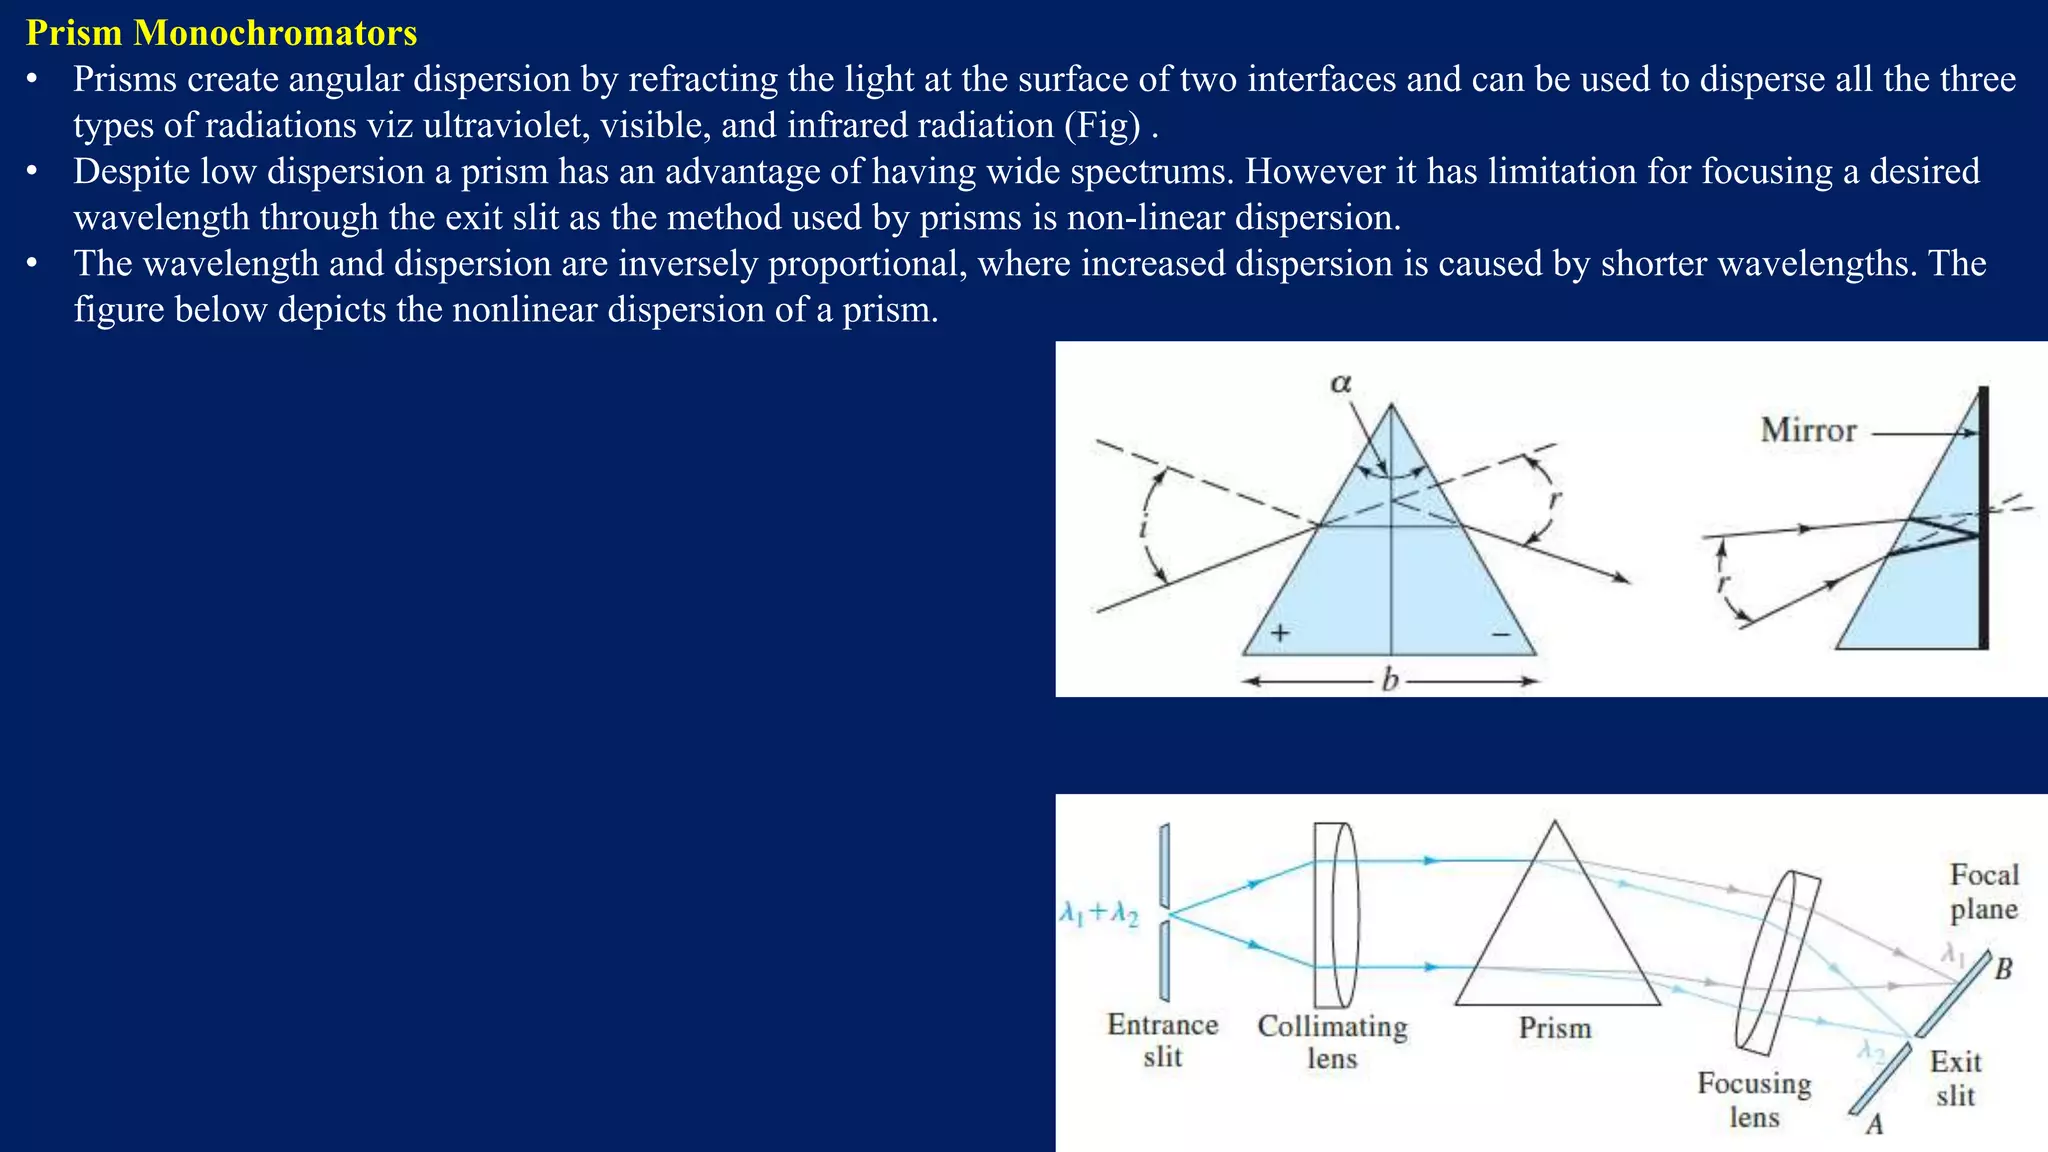
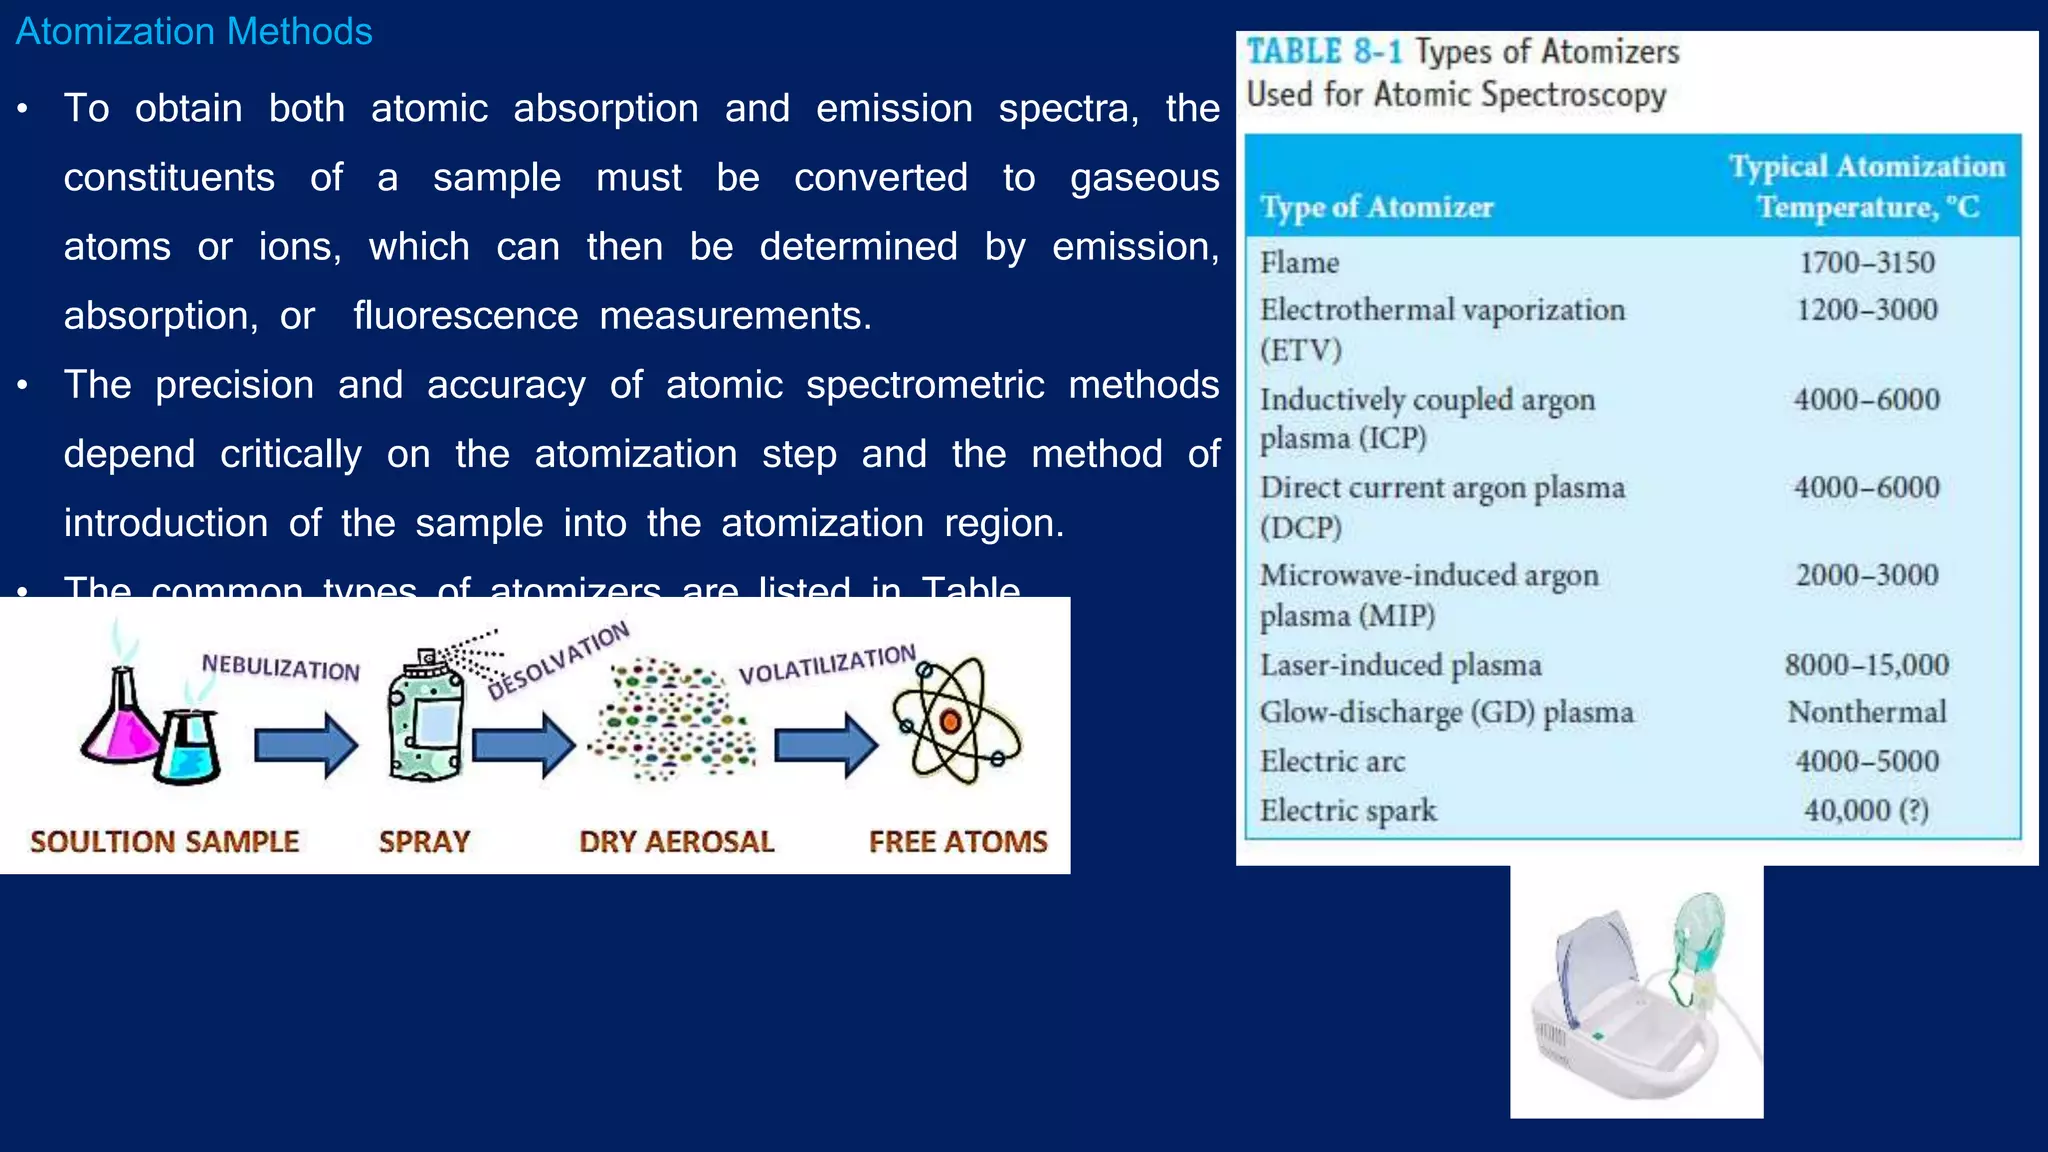
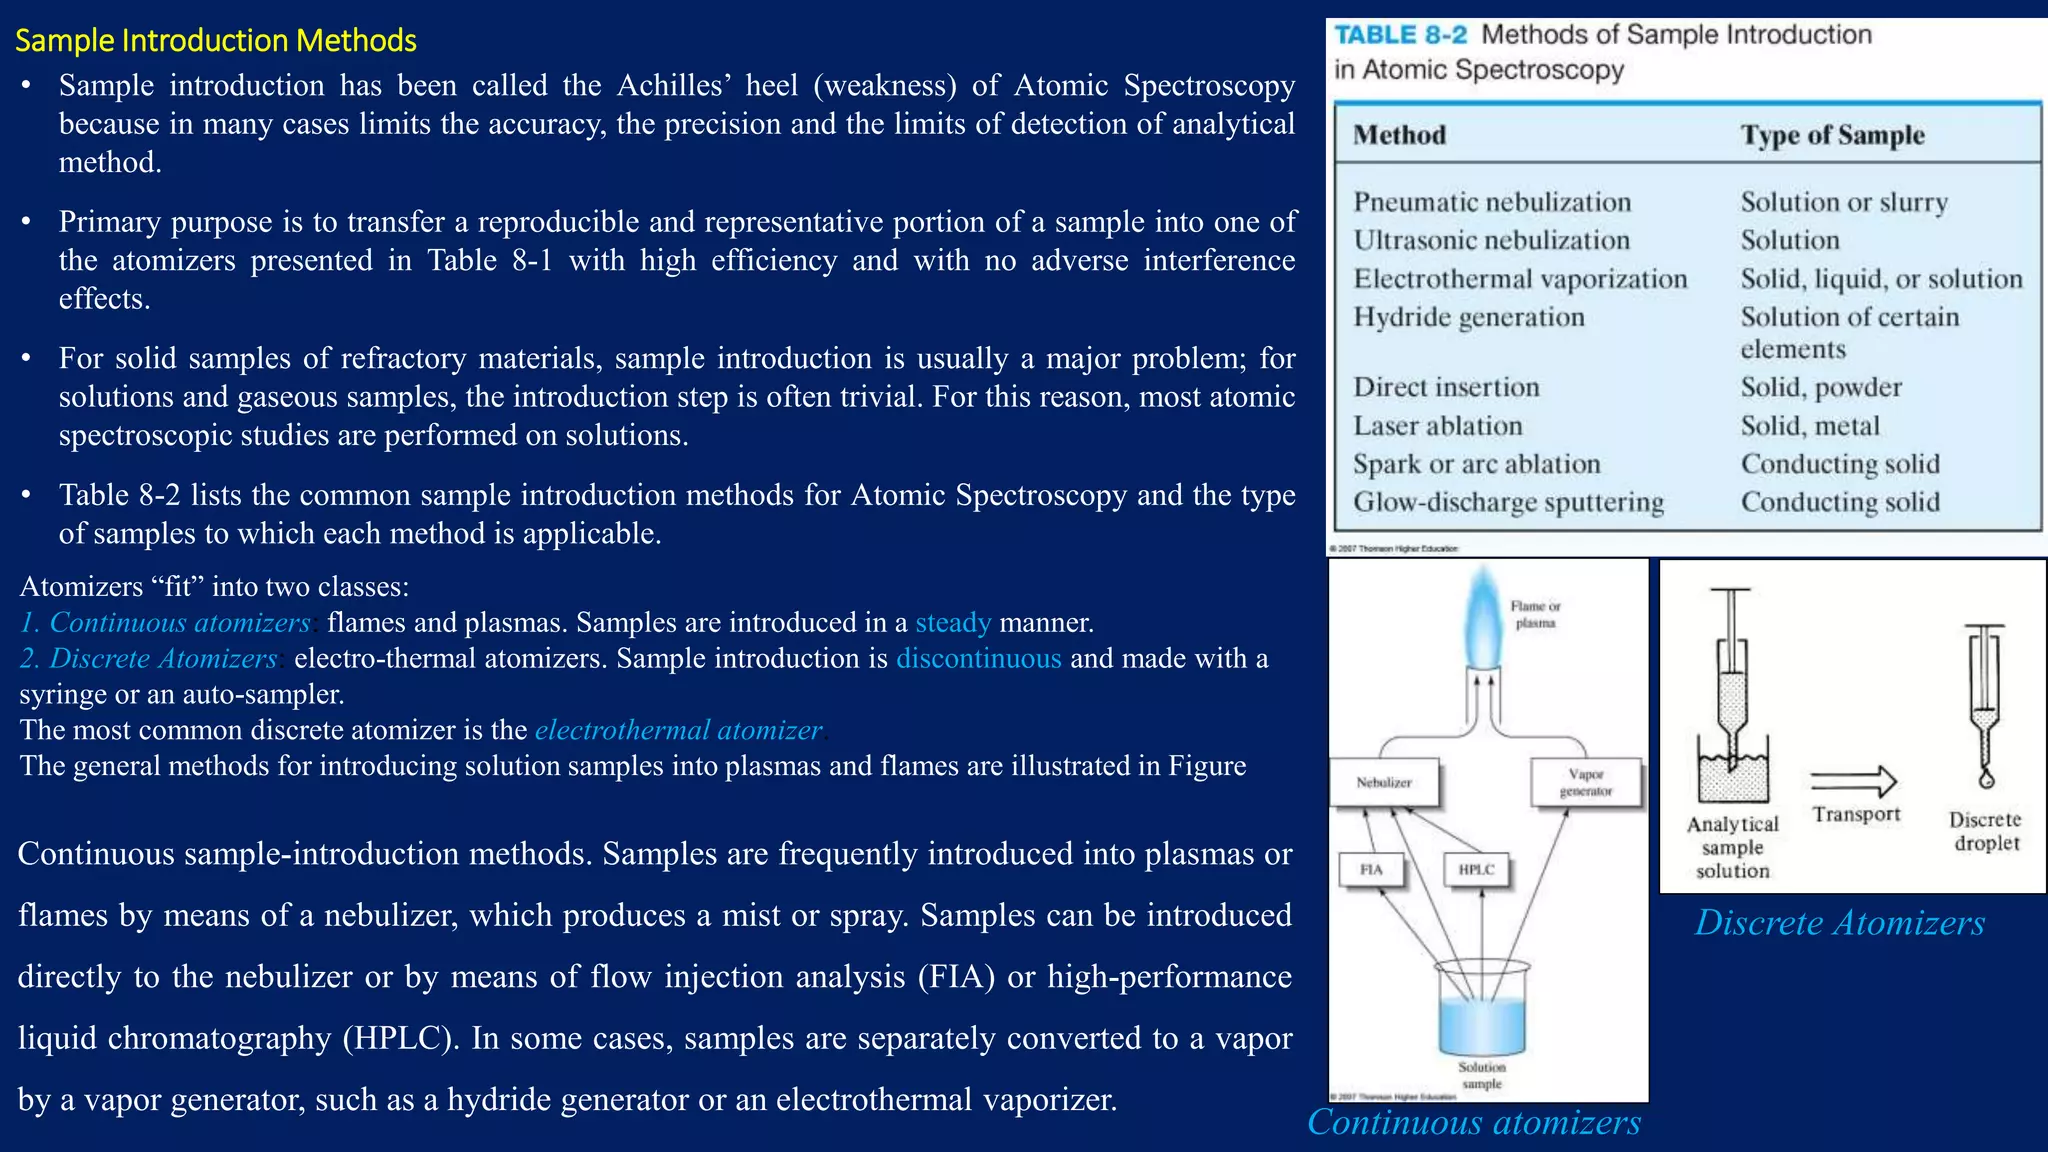
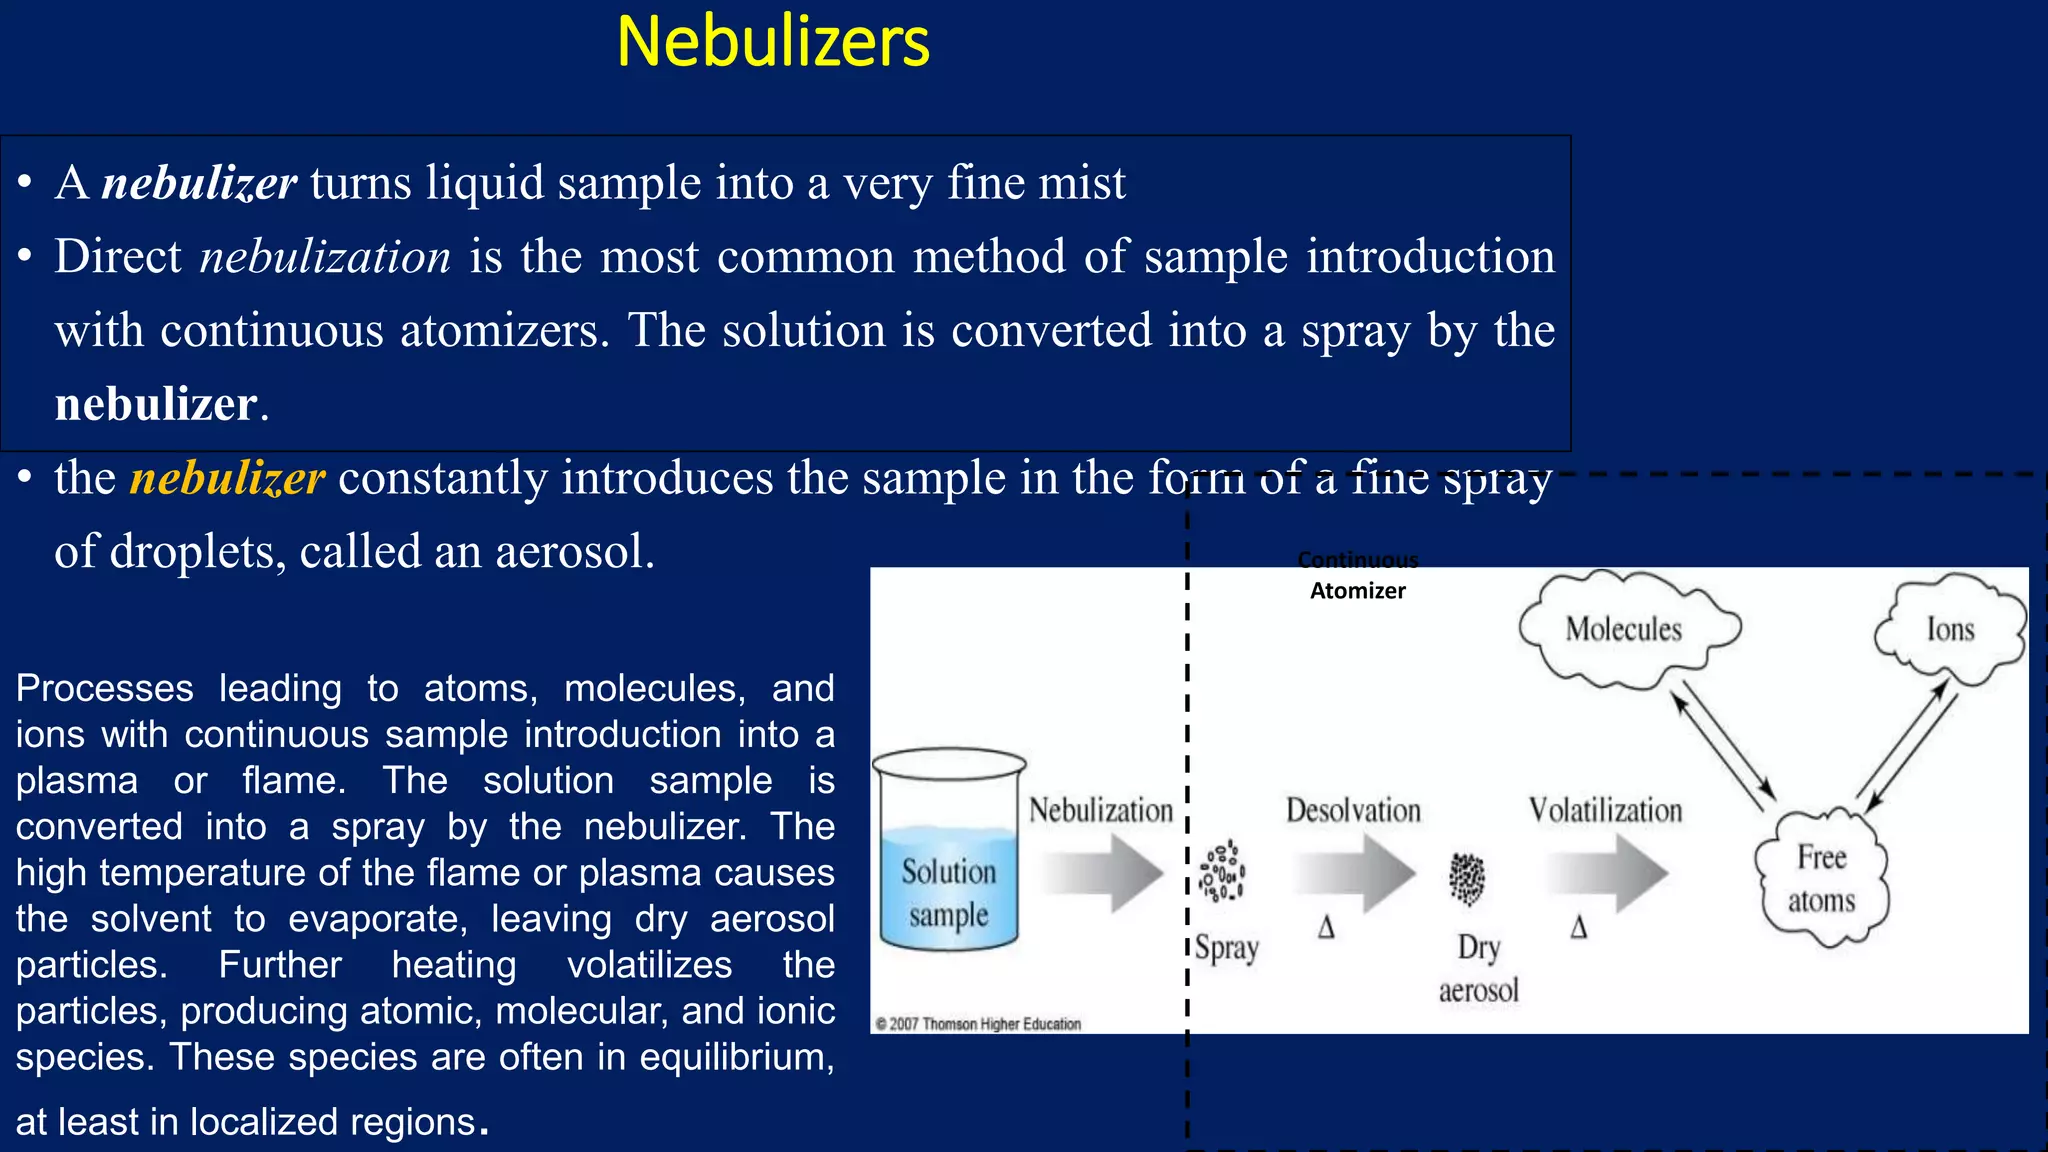
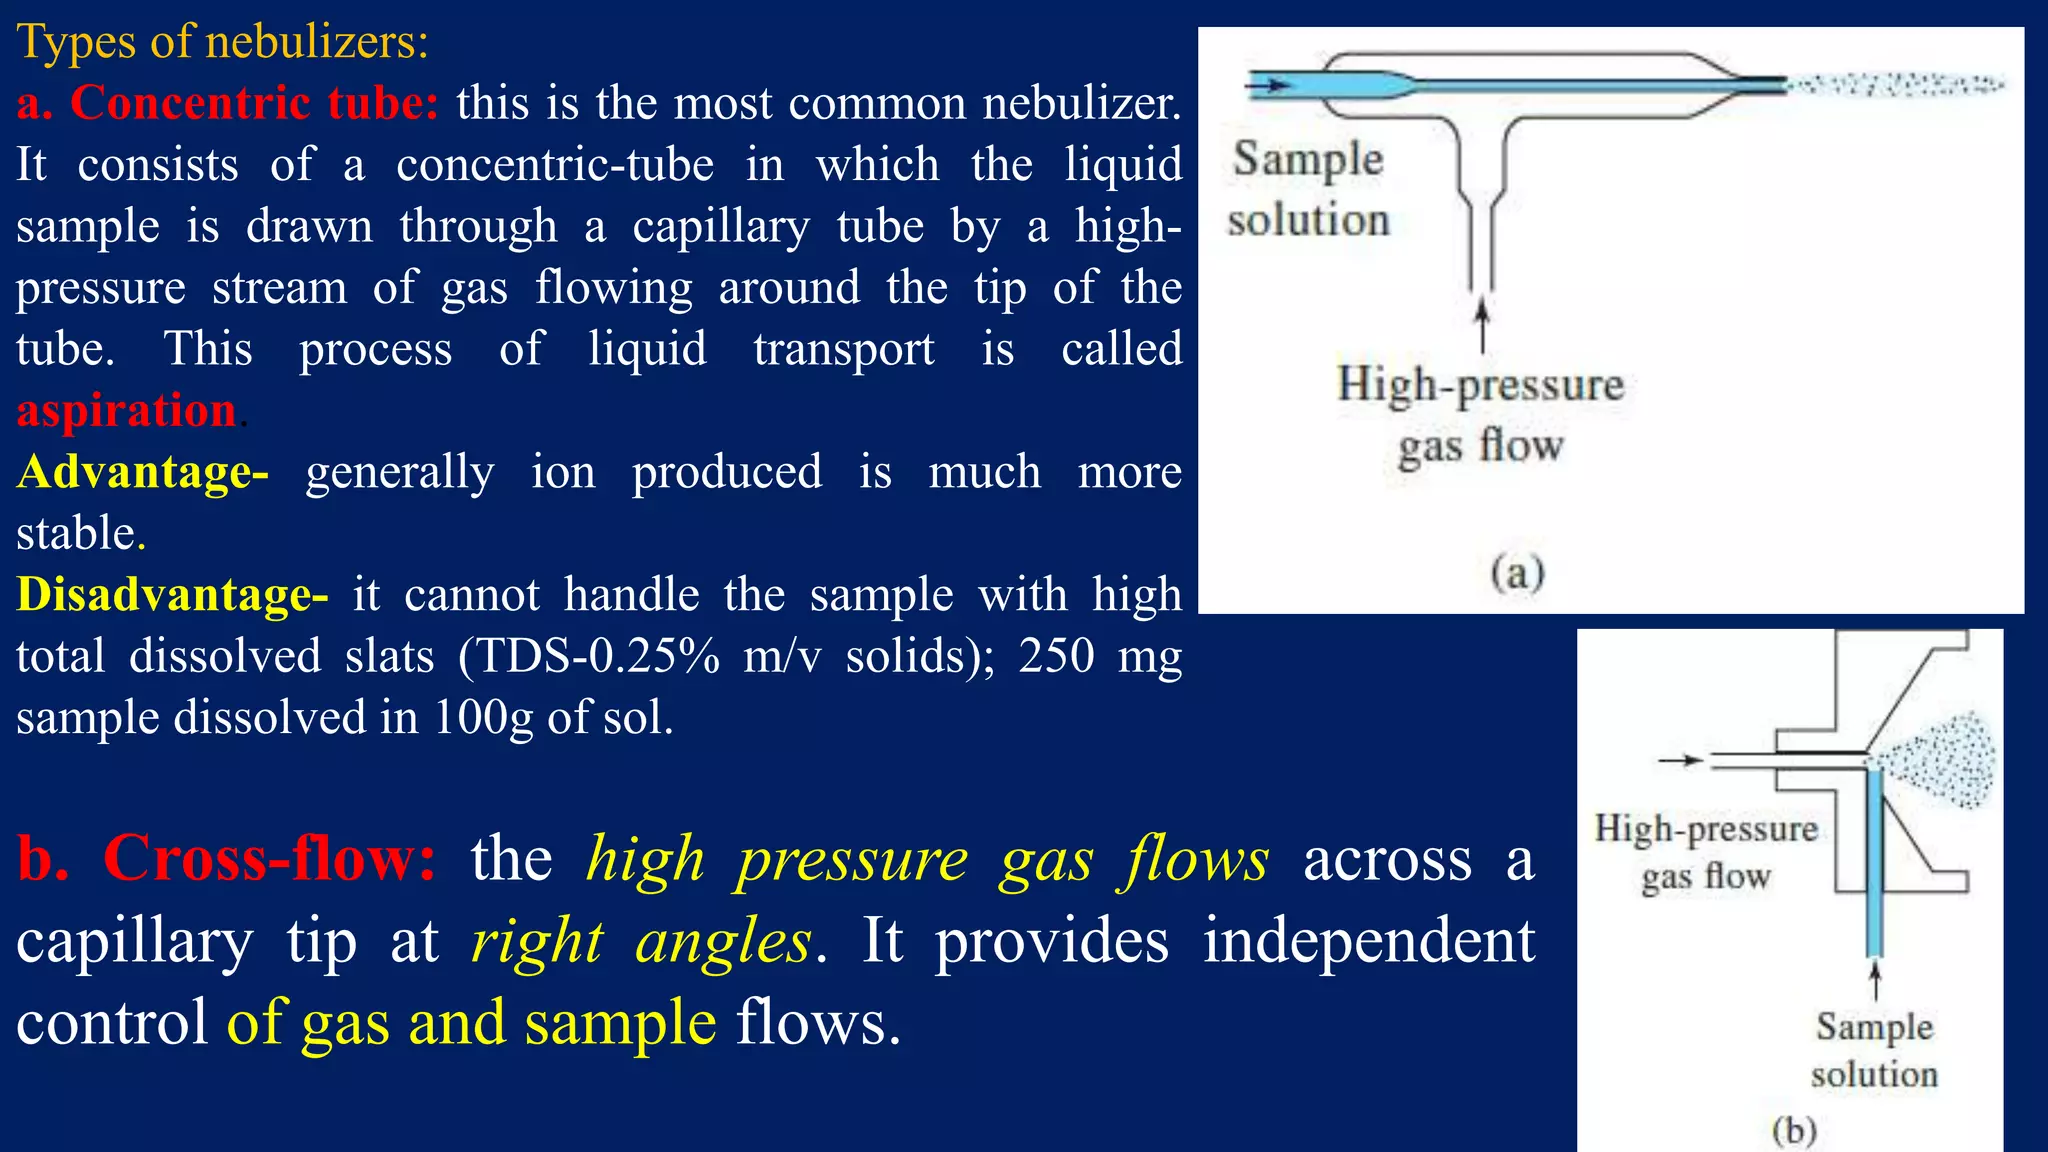
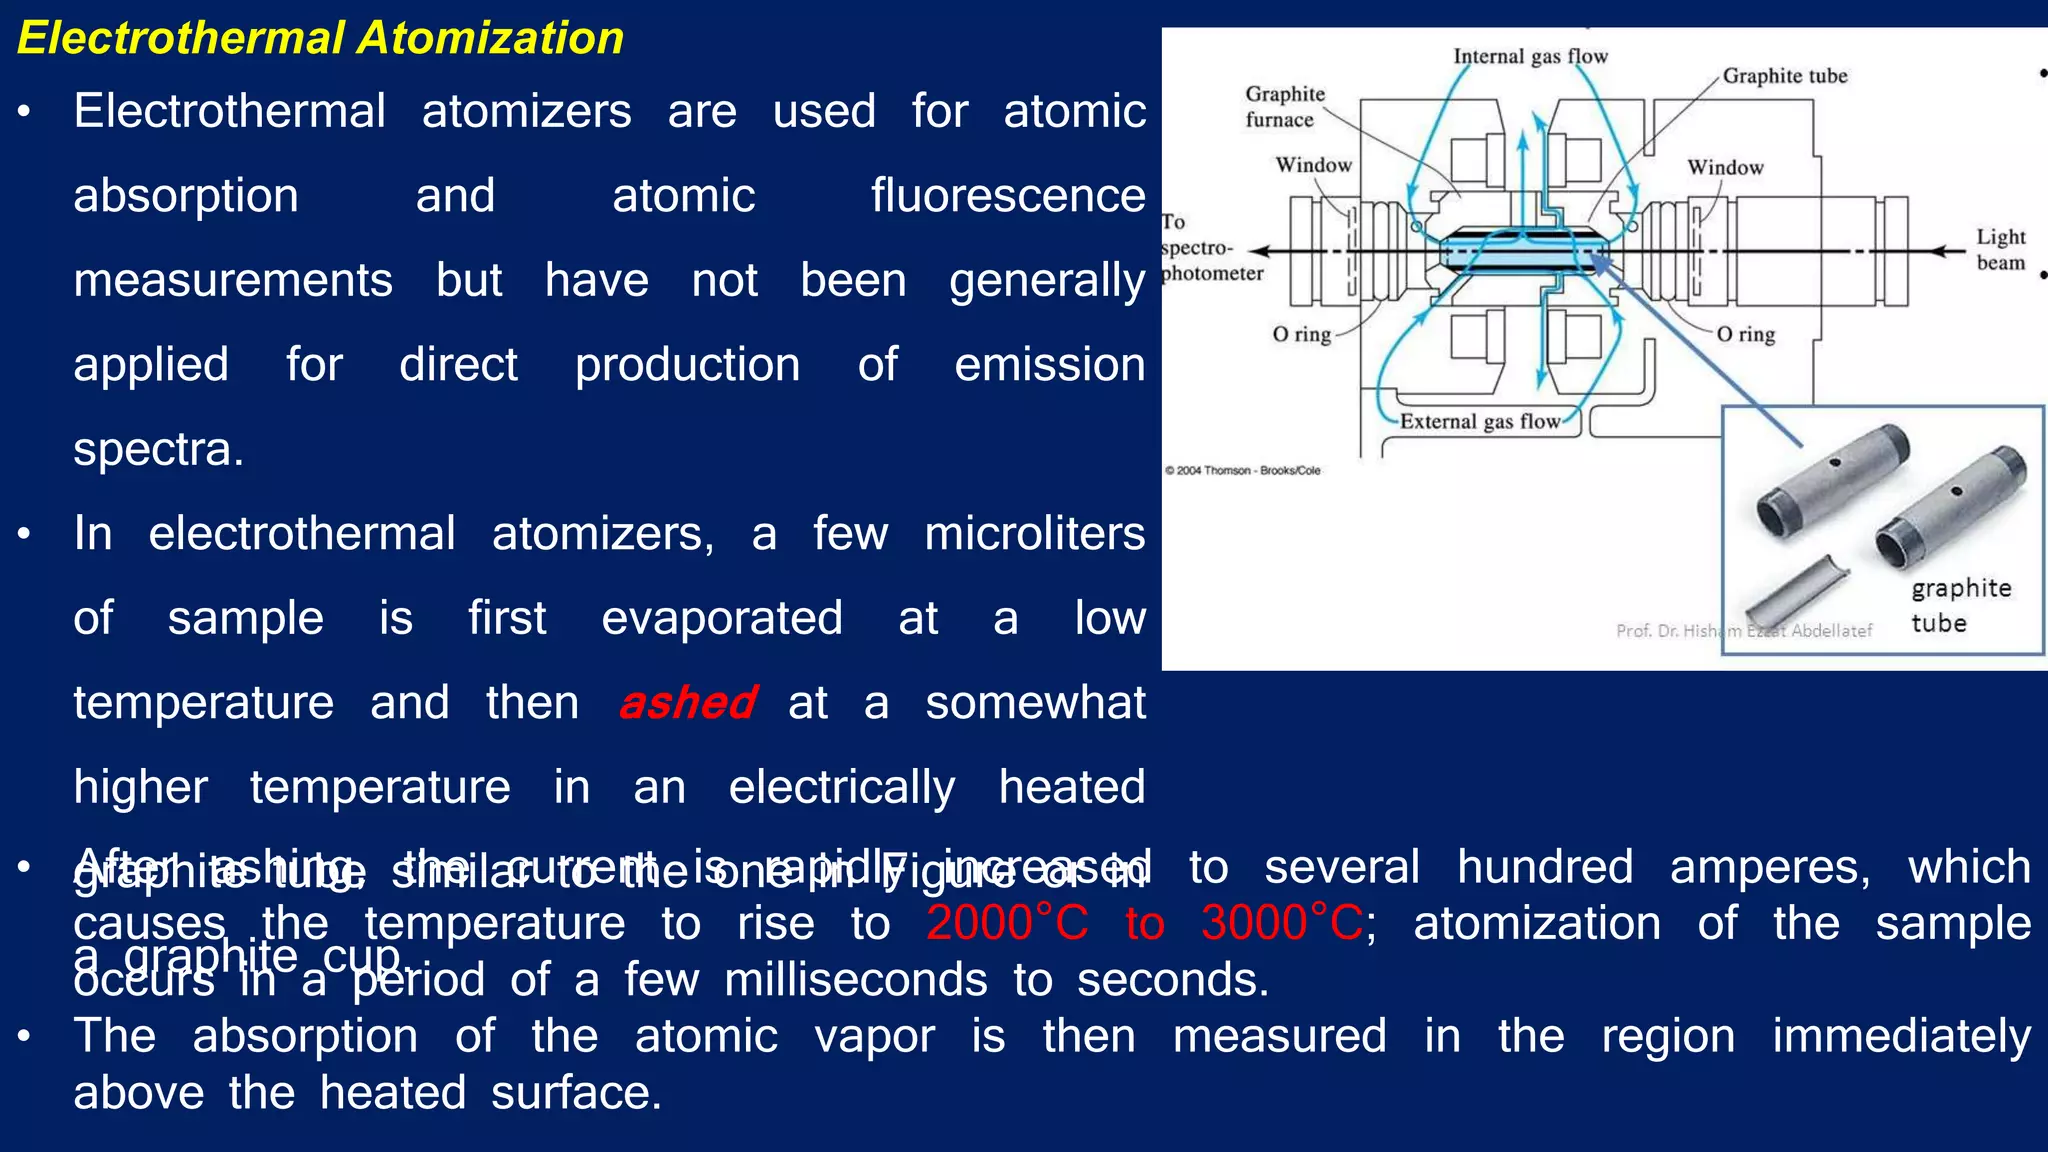
Atomic absorption spectroscopy requires atomization of samples into gaseous atoms. There are two main types of atomizers: continuous atomizers like flames and plasmas, and discrete atomizers like electrothermal atomizers. Samples are introduced continuously into continuous atomizers using nebulizers, which turn liquids into a fine mist. Electrothermal atomizers introduce small liquid samples discontinuously using an autosampler. Flames provide faster analysis but electrothermal atomizers can achieve lower detection limits. Monochromators like grating and prism monochromators are used to select specific wavelengths for analysis to improve sensitivity.
Atomic absorption spectroscopy, History, atomization techniques, and instrume...Muhammad Asif Shaheeen
History, principle, types, instrumentation, comparison with atomic emission spectroscopy, interference, advantages and disadvantages of different types of atomization techniques.
Introduction and understanding of emission and absorption spectrum, discussion on flame and its characteristics and the types of flame sources used in AAS, a brief discussion of flame emission spectroscopy ,possibly deep discussion of AAS, Interferences involved in AAS and their reasons.
The ppt is divided into five topics within itself trying to understand each topics individually before jumping into AAS
INTRODUCTION of Mass Spectrometry, Applications of Mass Spectrometry,Principle of Mass Spectrometry, Mass Spectrum,MOLECULAR ION PEAK, MOLECULAR ION / PARENT PEAK, BASE PEAK, Metastable ion ,Instrumentation of Mass Spectrometry, Electron impact spectra, CHEMICAL IONIZATION, ELECTROSPRAY IONISATION, MATRIX ASSISTED DESORPTION / IONISATION(MALDI), FAST ATOM BOMBARDMENT SOURCE,Ion separator (analyzer), Types of mass spectrometers, Single focussing spectrometers,Time of flight systems,FRAGMENTATION of Mass Spectrometry.
1. It is one of the type of Hyphenated technique.
2. It is a combination of gas chromatographic technique and spectroscopic technique.
3. It is having a high resolution capacity.
4. It is used has volatile and Non-volatile compounds.
5. It is used for qualitative and quantitative analysis.
1. It is one of the type of Hyphenated technique.
2. It is a combination of gas chromatographic technique and spectroscopic technique.
3. It is having a high resolution capacity.
4. It is used has volatile and Non-volatile compounds.
5. It is used for qualitative and quantitative analysis.
Atomic absorption spectroscopy is a method of elemental analysis. It is particularly useful for determining trace metals in liquids and is most independent of molecular form of the metal in sample.
introduction
Interference is a phenomena
that leads to changes (either positive or negative) in intensity of the analyte signal in spectroscopy.
Interferences in atomic absorption spectroscopy fall into two basic categories, namely, non-spectral and spectral.
1. spectral 2. Non Spectral ( Matrix interference, chemical interference, ionization interference)
PRINCIPLE - atomic absorpion spectroscopy
Atoms of the analyte have a fixed number of electrons.
If the light of a specific wavelength is passed through a flame containing that atom, electrons present in different energy levels, known as orbitals, absorb a certain wavelength and excite to higher energy levels.
The extent of absorption ά the number of ground-state atoms in the flame.
Only for information- The ground state is more stable than the excited state. The electrons spontaneously return back to the ground state. It emits the same amount of radiant energy. This process is called fluorescence. Fluorescence is used in atomic emission spectroscopy.
Brief note on - Instrumentation
The basic components of atomic absorption are:
Light source
Chopper
Atomizer
Burners
flames
Monochromators
Detectors
Amplifier
Readout devices
WORKING PROCESS
Calibration
Quantitative analysis in AAS
Safety measures
Important questions and answer
Multi-source connectivity as the driver of solar wind variability in the heli...Sérgio Sacani
The ambient solar wind that flls the heliosphere originates from multiple
sources in the solar corona and is highly structured. It is often described
as high-speed, relatively homogeneous, plasma streams from coronal
holes and slow-speed, highly variable, streams whose source regions are
under debate. A key goal of ESA/NASA’s Solar Orbiter mission is to identify
solar wind sources and understand what drives the complexity seen in the
heliosphere. By combining magnetic feld modelling and spectroscopic
techniques with high-resolution observations and measurements, we show
that the solar wind variability detected in situ by Solar Orbiter in March
2022 is driven by spatio-temporal changes in the magnetic connectivity to
multiple sources in the solar atmosphere. The magnetic feld footpoints
connected to the spacecraft moved from the boundaries of a coronal hole
to one active region (12961) and then across to another region (12957). This
is refected in the in situ measurements, which show the transition from fast
to highly Alfvénic then to slow solar wind that is disrupted by the arrival of
a coronal mass ejection. Our results describe solar wind variability at 0.5 au
but are applicable to near-Earth observatories.
Richard's entangled aventures in wonderlandRichard Gill
Since the loophole-free Bell experiments of 2020 and the Nobel prizes in physics of 2022, critics of Bell's work have retreated to the fortress of super-determinism. Now, super-determinism is a derogatory word - it just means "determinism". Palmer, Hance and Hossenfelder argue that quantum mechanics and determinism are not incompatible, using a sophisticated mathematical construction based on a subtle thinning of allowed states and measurements in quantum mechanics, such that what is left appears to make Bell's argument fail, without altering the empirical predictions of quantum mechanics. I think however that it is a smoke screen, and the slogan "lost in math" comes to my mind. I will discuss some other recent disproofs of Bell's theorem using the language of causality based on causal graphs. Causal thinking is also central to law and justice. I will mention surprising connections to my work on serial killer nurse cases, in particular the Dutch case of Lucia de Berk and the current UK case of Lucy Letby.
This pdf is about the Schizophrenia.
For more details visit on YouTube; @SELF-EXPLANATORY;
https://www.youtube.com/channel/UCAiarMZDNhe1A3Rnpr_WkzA/videos
Thanks...!
Richard's aventures in two entangled wonderlandsRichard Gill
Since the loophole-free Bell experiments of 2020 and the Nobel prizes in physics of 2022, critics of Bell's work have retreated to the fortress of super-determinism. Now, super-determinism is a derogatory word - it just means "determinism". Palmer, Hance and Hossenfelder argue that quantum mechanics and determinism are not incompatible, using a sophisticated mathematical construction based on a subtle thinning of allowed states and measurements in quantum mechanics, such that what is left appears to make Bell's argument fail, without altering the empirical predictions of quantum mechanics. I think however that it is a smoke screen, and the slogan "lost in math" comes to my mind. I will discuss some other recent disproofs of Bell's theorem using the language of causality based on causal graphs. Causal thinking is also central to law and justice. I will mention surprising connections to my work on serial killer nurse cases, in particular the Dutch case of Lucia de Berk and the current UK case of Lucy Letby.
(May 29th, 2024) Advancements in Intravital Microscopy- Insights for Preclini...Scintica Instrumentation
Intravital microscopy (IVM) is a powerful tool utilized to study cellular behavior over time and space in vivo. Much of our understanding of cell biology has been accomplished using various in vitro and ex vivo methods; however, these studies do not necessarily reflect the natural dynamics of biological processes. Unlike traditional cell culture or fixed tissue imaging, IVM allows for the ultra-fast high-resolution imaging of cellular processes over time and space and were studied in its natural environment. Real-time visualization of biological processes in the context of an intact organism helps maintain physiological relevance and provide insights into the progression of disease, response to treatments or developmental processes.
In this webinar we give an overview of advanced applications of the IVM system in preclinical research. IVIM technology is a provider of all-in-one intravital microscopy systems and solutions optimized for in vivo imaging of live animal models at sub-micron resolution. The system’s unique features and user-friendly software enables researchers to probe fast dynamic biological processes such as immune cell tracking, cell-cell interaction as well as vascularization and tumor metastasis with exceptional detail. This webinar will also give an overview of IVM being utilized in drug development, offering a view into the intricate interaction between drugs/nanoparticles and tissues in vivo and allows for the evaluation of therapeutic intervention in a variety of tissues and organs. This interdisciplinary collaboration continues to drive the advancements of novel therapeutic strategies.
Cancer cell metabolism: special Reference to Lactate PathwayAADYARAJPANDEY1
Normal Cell Metabolism:
Cellular respiration describes the series of steps that cells use to break down sugar and other chemicals to get the energy we need to function.
Energy is stored in the bonds of glucose and when glucose is broken down, much of that energy is released.
Cell utilize energy in the form of ATP.
The first step of respiration is called glycolysis. In a series of steps, glycolysis breaks glucose into two smaller molecules - a chemical called pyruvate. A small amount of ATP is formed during this process.
Most healthy cells continue the breakdown in a second process, called the Kreb's cycle. The Kreb's cycle allows cells to “burn” the pyruvates made in glycolysis to get more ATP.
The last step in the breakdown of glucose is called oxidative phosphorylation (Ox-Phos).
It takes place in specialized cell structures called mitochondria. This process produces a large amount of ATP. Importantly, cells need oxygen to complete oxidative phosphorylation.
If a cell completes only glycolysis, only 2 molecules of ATP are made per glucose. However, if the cell completes the entire respiration process (glycolysis - Kreb's - oxidative phosphorylation), about 36 molecules of ATP are created, giving it much more energy to use.
IN CANCER CELL:
Unlike healthy cells that "burn" the entire molecule of sugar to capture a large amount of energy as ATP, cancer cells are wasteful.
Cancer cells only partially break down sugar molecules. They overuse the first step of respiration, glycolysis. They frequently do not complete the second step, oxidative phosphorylation.
This results in only 2 molecules of ATP per each glucose molecule instead of the 36 or so ATPs healthy cells gain. As a result, cancer cells need to use a lot more sugar molecules to get enough energy to survive.
introduction to WARBERG PHENOMENA:
WARBURG EFFECT Usually, cancer cells are highly glycolytic (glucose addiction) and take up more glucose than do normal cells from outside.
Otto Heinrich Warburg (; 8 October 1883 – 1 August 1970) In 1931 was awarded the Nobel Prize in Physiology for his "discovery of the nature and mode of action of the respiratory enzyme.
WARNBURG EFFECT : cancer cells under aerobic (well-oxygenated) conditions to metabolize glucose to lactate (aerobic glycolysis) is known as the Warburg effect. Warburg made the observation that tumor slices consume glucose and secrete lactate at a higher rate than normal tissues.
Earliest Galaxies in the JADES Origins Field: Luminosity Function and Cosmic ...Sérgio Sacani
We characterize the earliest galaxy population in the JADES Origins Field (JOF), the deepest
imaging field observed with JWST. We make use of the ancillary Hubble optical images (5 filters
spanning 0.4−0.9µm) and novel JWST images with 14 filters spanning 0.8−5µm, including 7 mediumband filters, and reaching total exposure times of up to 46 hours per filter. We combine all our data
at > 2.3µm to construct an ultradeep image, reaching as deep as ≈ 31.4 AB mag in the stack and
30.3-31.0 AB mag (5σ, r = 0.1” circular aperture) in individual filters. We measure photometric
redshifts and use robust selection criteria to identify a sample of eight galaxy candidates at redshifts
z = 11.5 − 15. These objects show compact half-light radii of R1/2 ∼ 50 − 200pc, stellar masses of
M⋆ ∼ 107−108M⊙, and star-formation rates of SFR ∼ 0.1−1 M⊙ yr−1
. Our search finds no candidates
at 15 < z < 20, placing upper limits at these redshifts. We develop a forward modeling approach to
infer the properties of the evolving luminosity function without binning in redshift or luminosity that
marginalizes over the photometric redshift uncertainty of our candidate galaxies and incorporates the
impact of non-detections. We find a z = 12 luminosity function in good agreement with prior results,
and that the luminosity function normalization and UV luminosity density decline by a factor of ∼ 2.5
from z = 12 to z = 14. We discuss the possible implications of our results in the context of theoretical
models for evolution of the dark matter halo mass function.
2. Atomization Methods
• To obtain both atomic absorption and emission spectra, the
constituents of a sample must be converted to gaseous
atoms or ions, which can then be determined by emission,
absorption, or fluorescence measurements.
• The precision and accuracy of atomic spectrometric methods
depend critically on the atomization step and the method of
introduction of the sample into the atomization region.
• The common types of atomizers are listed in Table
3. • Sample introduction has been called the Achilles’ heel (weakness) of Atomic Spectroscopy
because in many cases limits the accuracy, the precision and the limits of detection of analytical
method.
• Primary purpose is to transfer a reproducible and representative portion of a sample into one of
the atomizers presented in Table 8-1 with high efficiency and with no adverse interference
effects.
• For solid samples of refractory materials, sample introduction is usually a major problem; for
solutions and gaseous samples, the introduction step is often trivial. For this reason, most atomic
spectroscopic studies are performed on solutions.
• Table 8-2 lists the common sample introduction methods for Atomic Spectroscopy and the type
of samples to which each method is applicable.
Sample Introduction Methods
Continuous sample-introduction methods. Samples are frequently introduced into plasmas or
flames by means of a nebulizer, which produces a mist or spray. Samples can be introduced
directly to the nebulizer or by means of flow injection analysis (FIA) or high-performance
liquid chromatography (HPLC). In some cases, samples are separately converted to a vapor
by a vapor generator, such as a hydride generator or an electrothermal vaporizer.
Atomizers “fit” into two classes:
1. Continuous atomizers: flames and plasmas. Samples are introduced in a steady manner.
2. Discrete Atomizers: electro-thermal atomizers. Sample introduction is discontinuous and made with a
syringe or an auto-sampler.
The most common discrete atomizer is the electrothermal atomizer.
The general methods for introducing solution samples into plasmas and flames are illustrated in Figure
Continuous atomizers
Discrete Atomizers
4. Nebulizers
• A nebulizer turns liquid sample into a very fine mist
• Direct nebulization is the most common method of sample introduction
with continuous atomizers. The solution is converted into a spray by the
nebulizer.
• the nebulizer constantly introduces the sample in the form of a fine spray
of droplets, called an aerosol. Continuous
Atomizer
Processes leading to atoms, molecules, and
ions with continuous sample introduction into a
plasma or flame. The solution sample is
converted into a spray by the nebulizer. The
high temperature of the flame or plasma causes
the solvent to evaporate, leaving dry aerosol
particles. Further heating volatilizes the
particles, producing atomic, molecular, and ionic
species. These species are often in equilibrium,
at least in localized regions.
5. Types of nebulizers:
a. Concentric tube: this is the most common nebulizer.
It consists of a concentric-tube in which the liquid
sample is drawn through a capillary tube by a high-
pressure stream of gas flowing around the tip of the
tube. This process of liquid transport is called
aspiration.
Advantage- generally ion produced is much more
stable.
Disadvantage- it cannot handle the sample with high
total dissolved slats (TDS-0.25% m/v solids); 250 mg
sample dissolved in 100g of sol.
b. Cross-flow: the high pressure gas flows across a
capillary tip at right angles. It provides independent
control of gas and sample flows.
6. d. Babington: it consists of a hollow sphere in which a
high pressure gas is pumped through a small orifice in the
sphere’s surface of the sphere. It is less subject to clogging
than a-c. It is useful for samples that have a high salt
content or for slurries with a significant particulate content.
c. Fritted disk: the sample solution is
pumped onto a fritted surface through which a
carrier gas flows. It provides a much finer
aerosol than a and b.
7. Ultrasonic Nebulizer
• The sample is fed to the surface of a vibrating piezoelectric transducer operated at a frequency of between 0.2 and
10 MHz.
• The vibrations convert the sample into a dense and more homogeneous aerosol than what a pneumatic nebulizer
can achieve. However, viscous liquids and particulates lower its efficiency. The aerosol is then carried to an
atomizer by an inert gas
• The mist obtained is more homogeneous and denser than pneumatic nebulizers.
• The production of aerosols is also very efficient and independent of gas flow rate unlike pneumatic nebulizers.
• The efficiency and detection limits of ultrasonic nebulizer are better than the pneumatic nebulizers.
• Limitations: However long wash-out times and lots of glassware required, bad memory effects and cost are some
of the limitations for its use.
Continuous
Atomizer
Discrete
Atomizer
8. A. Flame Atomization
Nebulization - Conversion of the liquid sample to a fine spray.
Desolvation - Solid atoms are mixed with the gaseous fuel.
Volatilization - Solid atoms are converted to a vapor in the flame.
Dissociation – break-up molecules in gas phase into atoms.
Ionization – cause the atoms to become charged
Excitation – with light, heat, etc. for spectra
• There are three types of particles that exist in the flame:
1) Atoms
2) Ions
3) Molecules
9. Electrothermal Atomization
• Electrothermal atomizers are used for atomic
absorption and atomic fluorescence
measurements but have not been generally
applied for direct production of emission
spectra.
• In electrothermal atomizers, a few microliters
of sample is first evaporated at a low
temperature and then ashed at a somewhat
higher temperature in an electrically heated
graphite tube similar to the one in Figure or in
a graphite cup.
• After ashing, the current is rapidly increased to several hundred amperes, which
causes the temperature to rise to 2000°C to 3000°C; atomization of the sample
occurs in a period of a few milliseconds to seconds.
• The absorption of the atomic vapor is then measured in the region immediately
above the heated surface.
10. Electrothermal Atomizers
• In this device, atomization occurs in a cylindrical
graphite tube that is open at both ends and that
has a central hole for introduction of sample by
means of a micropipette.
• The tube is about 5 cm long and has an internal
diameter of somewhat less than 1 cm.
• The interchangeable graphite tube fits closely into a
pair of cylindrical graphite electrical contacts located
at the two ends of the tube.
• These contacts are held in a water-cooled metal housing.
• Two inert gas streams are provided.
• The external stream prevents outside air from entering and incinerating the tube.
• The internal stream flows into the two ends of the tube and out the central sample port.
• This stream not only excludes air but also serves to carry away vapors generated from the
sample matrix during the first two heating stages.
11. Desolvation and Volatilization :
• desolvation leaves a dry aerosol of molten or solid particles.
• The solid or molten particle remaining after desolvation is volatilized
(vaporized) to obtain free atoms.
• The efficiency of desolvation and volatilization depends on a number of
factors: atomizer temperature, composition of analytical sample (nature
and concentration of analyte, solvent and concomitants) and size
distribution.
• In the case of nebulizers, it also depends on the nebulizer design, aerosol
trajectories and resident times of the particles.
Dissociation and Ionization:
• in the vapor phase, the analyte can exist as free atoms, molecules or
ions. In localized regions of the atomizer, molecules, free atoms and
ions co-exist in equilibrium.
Dissociation of molecular species:
• molecular formation reduces the concentration of free atoms and thus
degrades the detection limits. The dissociation constant for a molecular
species (MX) into its components (MX <=> M + X) can be written as:
Kd = nM.nX / nMX, where n is the number density (number of species per
cm3
Ionization:
it can also be consider an equilibrium process: M <=> M+ + e-. The
ionization constant can be written as: Ki = n M+ .ne / nM, where ne is the
number density of free electrons.
Oxidant (g)
Fuel (g)
Carrier (g)
12. The two most common methods of sample atomization encountered in AAS
and AFS are flame and electro-thermal atomization.
Flame atomization: A solution of the sample is nebulized by a flow of
gaseous oxidant, mixed with a gaseous fuel and carried into the flame where
atomization occurs.
Oxidant (g)
Fuel (g)
Carrier (g)
Note:
• If the gas flow rate does not exceed the burning velocity, the flame propagates
back into the burner, giving flashback.
• The flame is stable where the flow velocity and the burning velocity are equal.
• Higher flow rates than the maximum burning velocity cause the flame to blow
off.
Limits of Detection
In Flame Atomic absorption Spectroscopy the limit of detection is between 1 ppm for
transition metals to 10 ppb for alkali metals. Transition metals need more energy than alkali
metals to excite their outer electron which is why the higher detection limit is needed
13. Flame Structure
Increased number
of Mg atoms
produced by the
longer exposure
to the heat of the
flame.
Secondary combustion
zone: oxidation of Mg
occurs. Oxide particles
do not absorb at the
observation wavelength.
Ag is not easily
oxidized so a
continuous increase in
absorbance is
observed.
Cr forms very stable
oxides that do not
absorb at this
observation
wavelength.
Primary combustion zone: Thermal equilibrium is not achieved in this zone and thus it
is rarely used for flame spectroscopy.
Inter-zonal area: Free atoms are prevalent in this area. It is the most widely used part of
the flame for spectroscopy.
Secondary combustion zone: products of the inner core are converted to stable
molecular oxides that are then dispersed to the surroundings.
Maximum temperature: it is located in the flame about 2.5cm above the primary
combustion zone.
Note: It is important to focus the same part of the flame on the optical beam for all
calibrations and analytical measurements.
Optimization: of optical beam position within the flame prior to analysis provides the
best signal – to – noise ratio (S/N). It depends on element and it is critical for limits of
detection.
Temperature Profiles.
Figure shows a
temperature profile of a
typical flame for atomic
spectroscopy. The
maximum Temperature
is located in the flame
about 2.5 cm above the
14. Flame Atomizers versus Electro-thermal Atomizers
Advantages of Flame Atomizers
• Better reproducibility of measurements
RSD:
Flame ≈ 1%
Electro-thermal ≈ 5% - 10%
• Much faster analysis times than electro-
thermal atomizers
• Wider linear dynamic ranges, up to 2 orders
of magnitude wider than electro-thermal
atomizers.
Advantages of Electro-thermal Atomizers
• Smaller sample volumes (0.5mL to 10mL of
sample) than flame atomizers.
• Better absolute limits of detection (ALOD ≈
10-11 to 10-13 g of analyte) than flame
atomizers
Note: ALOD = [Sample Volume] x LOD
Electro-thermal atomization is the method of choice when flame atomization provides
inadequate limits of detection or sample availability is limited.
15. Wavelength selector
• To limit the radiations absorbed by a sample wavelength selectors are used to restrict the radiations to a certain wavelength or a
narrow band. This helps in improving the sensitivity of an AAS while as the high transmission improves the detectability.
• Number of wavelength selectors are available.
Filters: Filters transmits selectable narrow band of wavelengths of light or other radiation. Four categories of filters are known:
absorption filters, cut-off filters, interference filters, and interference wedges.
Absorption Filters:
Absorption Filters absorb most of the polychromatic radiation and allow transmission
of only a specific band of wavelengths. They only transmits about 10-20% of the
incident radiation. Since they can be made from colored glasses or plastics they are
economical and simple.
The most common type consists of colored glass or of a dye suspended in gelatin and
sandwiched between glass plates. Colored glass filters have the advantage of
high thermal stability. Note: Absorption filters are restricted to the visible
region of the spectrum
Cut-off Filters:
These type of filters transmit most of the radiation (nearly 100%). It transmits wavelengths of specific band
which rapidly decreases to zero over the remainder of the spectrum (Fig). These types of filters are not
usually used as wavelength selectors but to reduce the bandwidth of the absorption filter they are used in
combination with them.
The wavelengths transmitted will be the common one between the two filters which will result in narrower
bandwidth than absorption filters alone (Fig 8).
16. Interference Filters
• As the name implies, interference filters rely on optical interference to provide narrow
bands of radiation.
• An interference filter consists of a transparent dielectric (frequently calcium fluoride or
magnesium fluoride) that occupies the space between two semitransparent metallic films.
• Interference filters work on the principle of transmittance of some wavelengths of radiation
while reflect others.
• The dielectric material thickness and metallic films should be selected carefully as the
dielectric material and the reflectivity of the metallic films controls the transmittance of
wavelengths. The radiation transmitted through interference filters therefore, has a very
narrow bandwidth.
• interference filters separate light into transmitted and reflected beams, they are sometimes
referred to as dichroic filters.
17. Interference Wedges
• An interference wedge consists of a pair of mirrored, partially transparent
plates separated by a wedge-shaped layer of a dielectric material.
• The length of the plates ranges from about 50 to 200 mm.
• The radiation transmitted varies continuously in wavelength from one end to
the other as the thickness of the wedge varies.
• By choosing the proper linear position along the wedge, wavelengths with a
bandwidth of about 20 nm can be isolated.
• These filters can pass long wavelengths (long- or high-pass filters) or short
wavelengths (short- or low-pass filters).
• By combining a high-pass and a low-pass filter, a variable bandpass filter is
created.
• Interference wedges are available for the visible region (300 to 800 nm), the
near-IR region (1000 to 2000 nm), and for several parts of the IR region (2.5 to
14.5 μm). They can be used in place of prisms or gratings in spectrometers.
18. Monochromators :
The two basic types of monochromators are Grating Monochromators
and Prism Monochromators
1. Grating Monochromators
• Grating monochromators are placed within compartments of some AAS instruments which are
capable of producing narrow bands of radiation.
• In spectroscopic instruments the reflection gratings usually used are of two types a) echelette and
b) echelle gratings
a) Echelette Gratings:
The most common type of gratings used in
spectroscopic instruments is echelette gratings which
may contain 300-2000 grooves/mm. The most
common echelette gratings used in AAS has on an
average, density of 1200-1400 grooves/mm. These
gratings uses the long/broad face of the groove for
the linear dispersion of radiation (Fig).
b) Echelle Gratings:
For the dispersion of radiation short face of
the grooves is used in Echelle gratings.
They contain less number of grooves per
millimeter approximately 80-300
grooves/mm but these are known for their
very high dispersion (Fig).
Components of monochromator
(1) an entrance slit that provides a rectangular optical image,
(2) a collimating lens or mirror that produces a parallel beam of radiation,
(3) a prism or a grating that disperses the radiation into its component wavelengths,
(4) a focusing element that reforms the image of the entrance slit and focuses it on a
planar surface called a focal plane, and
(5) an exit slit in the focal plane that isolates the desired spectral band.
19. Prism Monochromators
• Prisms create angular dispersion by refracting the light at the surface of two interfaces and can be used to disperse all the three
types of radiations viz ultraviolet, visible, and infrared radiation (Fig) .
• Despite low dispersion a prism has an advantage of having wide spectrums. However it has limitation for focusing a desired
wavelength through the exit slit as the method used by prisms is non-linear dispersion.
• The wavelength and dispersion are inversely proportional, where increased dispersion is caused by shorter wavelengths. The
figure below depicts the nonlinear dispersion of a prism.