Download to read offline

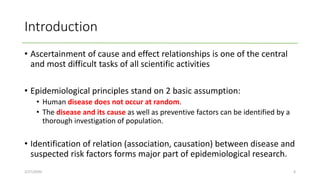
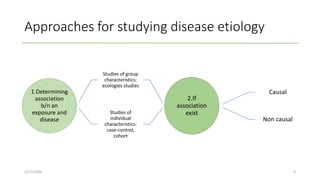
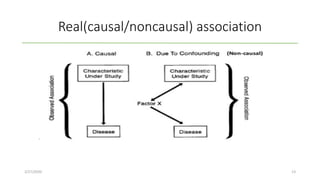
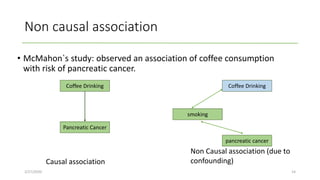
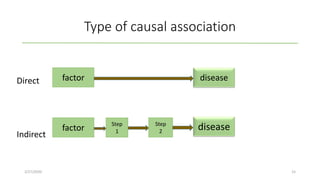
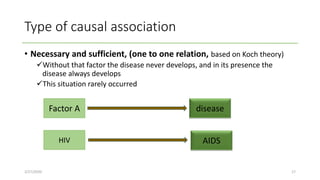
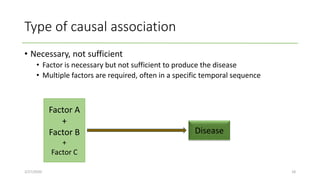
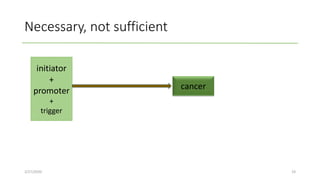
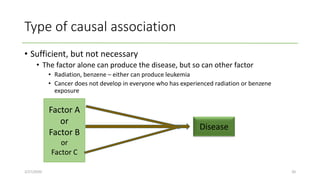
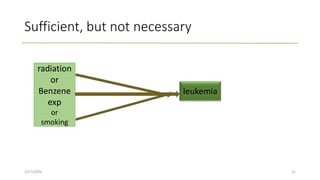
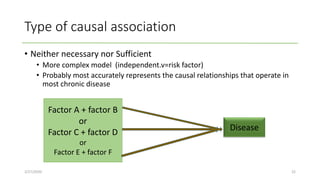
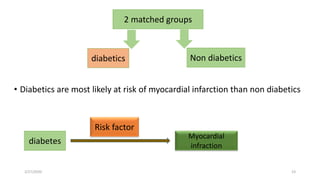
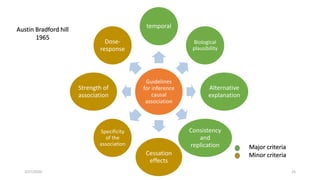

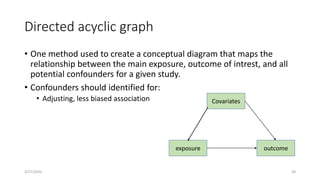
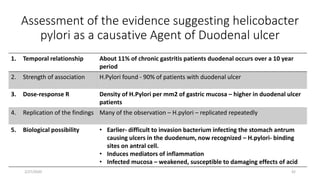
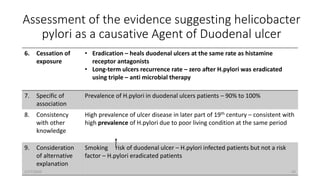


This document discusses approaches for studying disease causation through epidemiological studies. It outlines the difference between association and causation, describing various types of causal relationships like necessary vs sufficient. It also discusses guidelines for assessing causality, including temporal relationship, strength of association, biological plausibility, consistency of findings, and consideration of alternative explanations. The document uses examples like the relationship between Helicobacter pylori and duodenal ulcers to demonstrate how these guidelines can be applied to evaluate evidence for a causal inference.


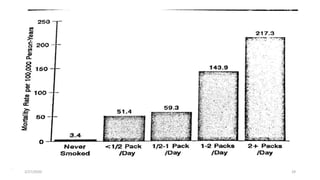
![ONFH[AVN HIP] -TRIPLE REGIME -A NOVAL SURGICAL CONCEPT .pptx](https://cdn.slidesharecdn.com/ss_thumbnails/onfhavnhip2026koaconcalicutdrgokuldevdrmashraf-260210064517-213ec005-thumbnail.jpg?width=640&height=640&fit=bounds)


![CTEV [ clubfoot] DR ARUN LAL ,DR MOHAMED ASHRAF travancore medical college k...](https://cdn.slidesharecdn.com/ss_thumbnails/ctevclubfootdrarunlaldrmohamedashraftravancoremedicalcollegekollamkeralaindia-260208063247-18fc466c-thumbnail.jpg?width=640&height=640&fit=bounds)
