Headlines
Concept ofcause in epidemiology
Association and cause association
Measures of association and types of ass
ociation
Spurious association
Noncausal association
Causal association
Evaluation causal association
Hill's criteria
Summary
3.
Discover the causesof a disease
Analytical studies
Described cohort studies
Case-control studies
Experimental studies
4.
Concept of causes
A causal relationship or causes of di
sease may indicate that: the factors
that increases the probability of the
occurence of one or more of these f
actors decreases the frequency of t
hat disease.
5.
Association (relationship):statistical dependence between
two or more events, characteristics or other variables.
Positive association implies a direct relationship, while
negative association implies an inverse one. The presence
of a statistical association alone does not necessarily
imply a causal relationship.
Causality (causation / cause-effect relationship): relating
causes to the effects they produce.
6.
Causes maybe “genetic” and / or
“environmental” (e.g. many NCDs
including: diabetes, cancers, COPD,
etc)
7.
Notice: Theconcept here is different
from that in philosophy. In public he
alth practice or in prevention, it is ne
cessary to identify an exposure with
out necessary identifying the ultimat
e cause of the disease. Epidemiolog
y frequently provides a basis for acti
on despite ignorance of mechanism.
Concept of causes
8.
Concept of causes
Example 1
Cigarette smoke has been identified as
the vehicle associated with increased
rates of lung cancer and other cancers
, and heart respiratory disease. It's not
necessary to identify precisely which c
omponent in the smoke is the prime off
ender before instituting preventive me
asures.
9.
Concept of causes
Example 2
In John Snow's era, when the people did not
know the causative agent of cholera. It was
necessary to know that polluted water was a
major vector of cholera. Lack of knowledge t
hat a specific bacterium is the causative age
nt did not prevent authorities from introduci
ng legislation mandating that all water comp
anies in London filter their water, thus greatl
y controlling the disease.
10.
Concept of causes
In both of these example, reducing the
exposure to the cause, whether cigare
tte smoke or polluted water, helps solv
e the disease problem in the populatio
n.
11.
Henle-Koch's postulates (1877,1882)
Kochstated that four postulates should be met before a
causal relationship can be accepted between a
particular bacterial parasite (or disease agent) and the
disease in question. These are:
1. The agent must be shown to be present in every case
of the disease by isolation in pure culture.
2. The agent must not be found in cases of other
disease.
3. Once isolated, the agent must be capable of
reproducing the disease in experimental animals.
4. The agent must be recovered from the experimental
disease produced.
12.
Henle-Koch's postulates (1877,1882)
Koch'spostulates contributed greatly to unders
tanding the concept of cause in medicine. The a
pplication of these postulates helped people ide
ntify the relationship between an agent and dis
ease. The logical model is helpful even today w
hen looking at some infectious diseases, such a
s Legionnaire's disease and AIDs.
13.
Henle-Koch's postulates (1877,1882)
However,for most of the diseases, especially non-c
ommunicable chronic diseases, cause or causes ca
nnot be esdablished simply by Koch's criteria. Few
diseases are so simple that there is a single cause.
A given disease can be caused by more than one ca
usal mechanism, and every causal mechanism invol
ves the joint action of a multitude of component cau
ses.
14.
Henle-Koch's postulates (1877,1882)
Forinstance, smoking might be the cause of lung ca
ncer, coronary heart disease as well as other diseas
es. (One cause, multiple diseases)
Heart disease is associated with multiple factors or
causes.(Multiple diseases, one cause)
15.
Levels / Typesof causality
Molecular / Physiological
Personal / Social
Deterministic / probabilistic
What aspect of “environment” (broadly
defined) if removed / reduced / controlled
would reduce outcome / burden of
disease
16.
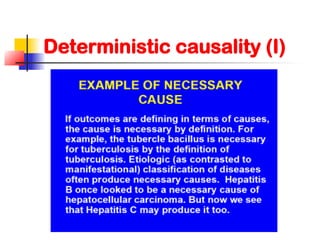
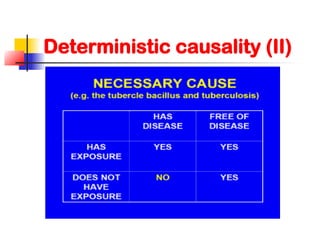
Definitions
Necessary cause:The cause must be pre
sent for the outcome to happen. However,
the cause can be present without the outc
ome happening.
Probabilistic Causality:in epidemiology,
most associations are rather “weak” (e.g.
relationship between high serum cholesterol
and IHD), which is neither necessary nor
sufficient
Multiple causes result in what is known as
“web of causation”or “chain of causation”
which is very common for noncommunicable
/ chronic diseases
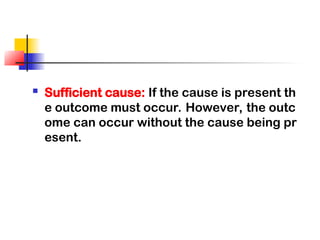
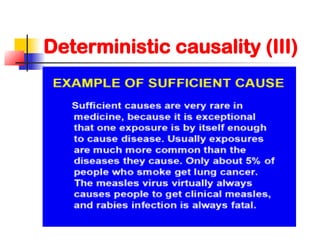
26.
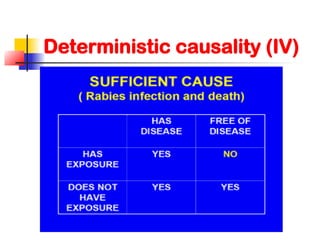
Component causes:together they
constitute a sufficient cause for the
outcome in question. In CDs, this may
include the biological agent as well as
environmental conditions (e.g. TB,
measles, ARF/RHD). In NCDs, this may
include a whole range of genetic,
environmental as well as personal /
psychosocial / behavioral characteristics
(e.g. diabetes, cancers, IHD)
27.
Causal inferenceis an intelligent way of a
pplying common sense and judgement to
connect an exposure with a disease and t
o infer that the exposure is likely a cause
of the disease.
28.
The process ofcausal inference is usually incre
mental. Much of the data used in interpreting rel
ationships comes from observational studies and
must be interpreted with careful considerations
of representativeness of the data, potantial biase
s, the role of effect modifiers and unmeasured co
nfounders.
29.
Disease in humanpopulation usually not caused
by a single exposure and the causes of a particul
ar event may differ in different circumstances. S
ometimes, there are disagreements on what con
stitutes disease. Sometimes there are disagreem
ents about whether a strong relationship is caus
al.
30.
The approach thatwe take is to evaluate the evi
dence at hand and to take the best assessment o
f the evidence. The answers often are in the form
of probability statements. Our conclusions are m
ost often based on increased incidence of diseas
e in a group with certain characteristics or expos
ures and we label those exposures as causal if it
makes sense biologically.
31.
On the otherhand, if a group has significantly les
s disease, then we may label the exposures or ch
aracteristics as protective.
32.
Notice: the increasedincidence in a group does
not necessarily explain the outcome for any indiv
idual in the group.
33.
For example, considerair pollution. In developin
g public health programs, knowing that exposure
to a particular pollutant increases the probability
of developing a disease is important. Unless the
pollutant is absolutely caustic, the information d
oes not necessarily tell us the outcome for a part
icular patient.
34.
Definitions
Deduction: reasonedargument proceeding from
the general to the particular.
Induction: any method of logical analysis that
proceeds from the particular to the general.
Conceptually bright ideas, breakthroughs and
ordinary statistical inference belong to the realm
of induction.
Induction period: the period required for a
specific cause to produce the disease (health-
related outcome). Usually longer with NCDs
35.
Effect Measures /
ImpactFractions
Effect measures (e.g. odds ratio, risk
ratio) and impact fractions (e.g.
population attributable risk) are closely
related to the strength of association
The higher effect measures (away from
unity) and population attributable risk
(closer to 100 %) the more the exposure is
predictive of the outcome in question
E.g. PAR of 100 % means that a factor is
“necessary”
36.
However, if statisticalsignificance exists, e.g. p<
0.05, we can not simply make an inference that t
he exposure is the cause of the outcome.
37.
First, you needto consider the size of the
sampling error. What does p<0.05 mean?
Assume p=0.05. That means for this study the
probability of that result of the study is reliable is
95% and 5% of probability of that is caused by
sampling error, or by chance. When making this
calculation, the precondition is that the design,
conduct of the study and analyses for thus study
are perfect. Almost no study is perfect in either
design or conduct.
38.
If the probablilityof sampling error is very limited
, then we may put more consideration to the asso
ciation.
39.
Definitions
Spurious association(false association): The association i
s not true. The association may result from various biases.
One possibility is that there a random error introduced into
the findings and it is completely due to sampling probabilit
y, Another is that there is a systematic error (nonrandom).
A non-random error is called a bias. It may occur in the su
bjects selection for the study or in the data collection durin
g the implementation of the study.
40.
Definitions
Noncausal association:the association between the expos
ure of interested and the outcome really exists, but it is not
causal. Change in exposure does not result in a change in
outcome. In these conditions, the association is usually du
e to confounding factors.
41.
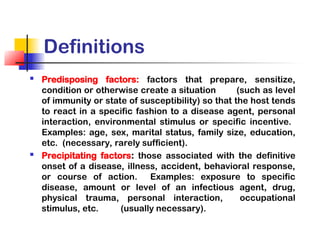
Definitions
Predisposing factors:factors that prepare, sensitize,
condition or otherwise create a situation (such as level
of immunity or state of susceptibility) so that the host tends
to react in a specific fashion to a disease agent, personal
interaction, environmental stimulus or specific incentive.
Examples: age, sex, marital status, family size, education,
etc. (necessary, rarely sufficient).
Precipitating factors: those associated with the definitive
onset of a disease, illness, accident, behavioral response,
or course of action. Examples: exposure to specific
disease, amount or level of an infectious agent, drug,
physical trauma, personal interaction, occupational
stimulus, etc. (usually necessary).
42.
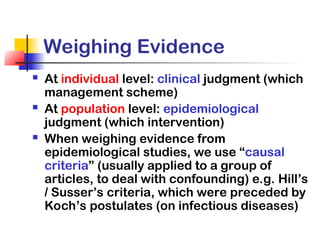
Weighing Evidence
Atindividual level: clinical judgment (which
management scheme)
At population level: epidemiological
judgment (which intervention)
When weighing evidence from
epidemiological studies, we use “causal
criteria” (usually applied to a group of
articles, to deal with confounding) e.g. Hill’s
/ Susser’s criteria, which were preceded by
Koch’s postulates (on infectious diseases)
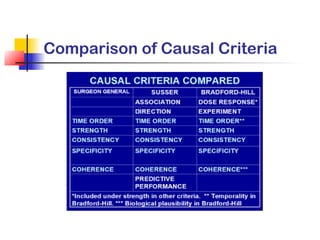
43.
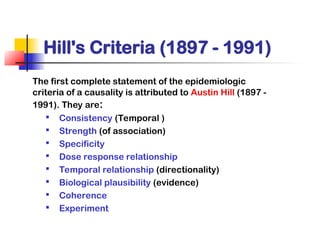
Hill's Criteria (1897- 1991)
The first complete statement of the epidemiologic
criteria of a causality is attributed to Austin Hill (1897 -
1991). They are:
Consistency (Temporal )
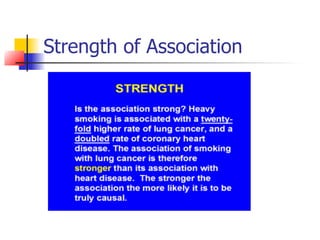
Strength (of association)
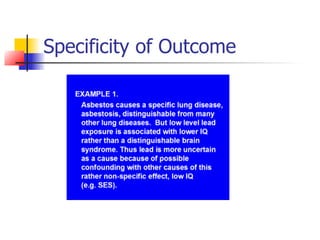
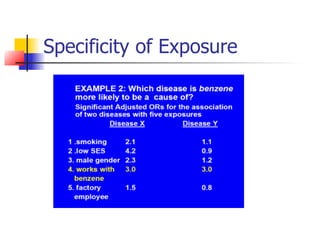
Specificity
Dose response relationship
Temporal relationship (directionality)
Biological plausibility (evidence)
Coherence
Experiment
44.
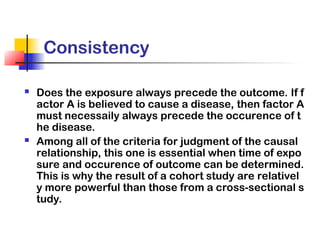
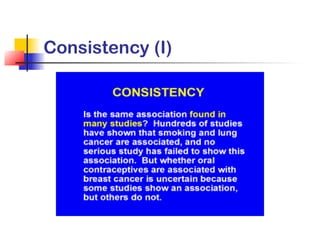
Consistency
Does theexposure always precede the outcome. If f
actor A is believed to cause a disease, then factor A
must necessaily always precede the occurence of t
he disease.
Among all of the criteria for judgment of the causal
relationship, this one is essential when time of expo
sure and occurence of outcome can be determined.
This is why the result of a cohort study are relativel
y more powerful than those from a cross-sectional s
tudy.
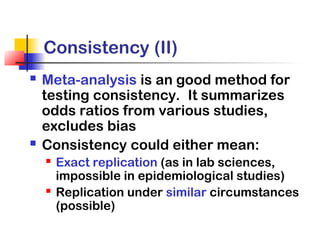
Consistency (II)
Meta-analysisis an good method for
testing consistency. It summarizes
odds ratios from various studies,
excludes bias
Consistency could either mean:
Exact replication (as in lab sciences,
impossible in epidemiological studies)
Replication under similar circumstances
(possible)
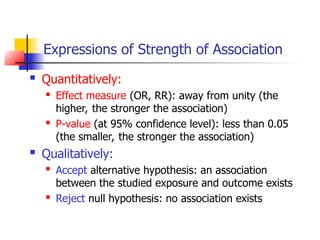
Expressions of Strengthof Association
Quantitatively:
Effect measure (OR, RR): away from unity (the
higher, the stronger the association)
P-value (at 95% confidence level): less than 0.05
(the smaller, the stronger the association)
Qualitatively:
Accept alternative hypothesis: an association
between the studied exposure and outcome exists
Reject null hypothesis: no association exists
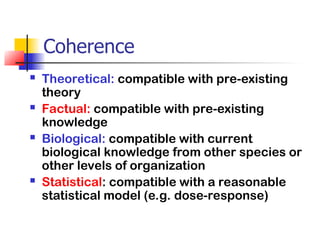
Coherence
Theoretical: compatiblewith pre-existing
theory
Factual: compatible with pre-existing
knowledge
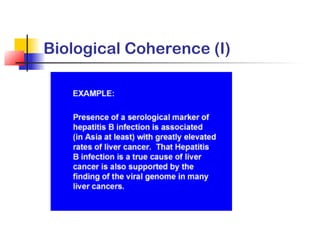
Biological: compatible with current
biological knowledge from other species or
other levels of organization
Statistical: compatible with a reasonable
statistical model (e.g. dose-response)
Analogy
If anexposure similar to A causes an outco
me similar to B, then this is evidence suppor
ting that A causes B. Sometimes a commonl
y accepted phenomenon in one area can be
applied to another area.
59.
Susser's criteria (I)
Mervyn Susser (1988) used similar
criteria to judge causal
relationships.
In agreement with previous authors,
he mentioned that two criteria have
to be present for any association that
has a claim to be causal: i.e. time
order (X precedes Y); and direction
(X leads to Y).
60.
Susser’s Criteria (II)
Rejection of a hypothesis can accomplished
with confidence by only three criteria: time
order, consistency, factual incompatibility
or incoherence.
Acceptance or affirmation can be achieved
by only four, namely: strength, consistency,
predictive performance, and statistical
coherence in the form of regular
exposure/effect relation.
References
1. Porta M.A dictionary of epidemiology. New York,
Oxford: Oxford University Press, 2008.
2. Rothman KJ (editor). Causal inference. Chestnut Hill:
Epidemiology Resources Inc., 1988.
3. Hill AB. The environment and disease: Association or
causation. Proceedings of the Royal Society of
Medicine 1965; 58: 295-300.
4. Susser MW. What is a cause and how do we know one ?
A grammar for pragmatic epidemiology. American
Journal of Epidemiology 1991; 133: 635- 648.
5. Paneth N. Causal inference. Michigan State University.
6. Rothman J, Greenland S. Modern epidemiology. Second
edition. Lippincott - Raven Publishers, 1998.