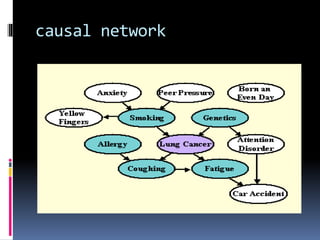
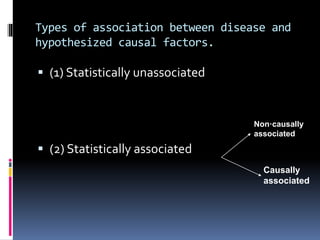
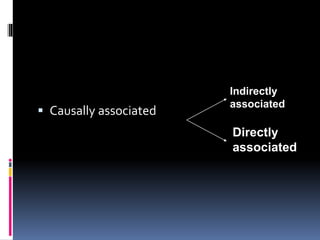
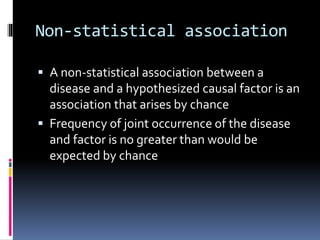
PROF. DR. MANSUR-UD-DIN AHMAD
Associations(Chap3)
Variables
 A variable is any observable event that can
vary:
 Examples:
 Weight
 Age of an animal
 Number of cases of disease
Study variable
 A study variable is any variable that is being
considered in an investigation
Response and explanatory
variables
 A response variable is one that is affected by
another (explanatory) variable
 Example:
 Effects of dry cat food on the occurrence of
urolithiasis, cat food is the explanatory variable
and urolithiasis is the response variable
Types of association
 Association is the degree of dependence or
independence between two variables.
 Main types of association
1. Non-statistical association;
2. Statistical association
causal network
Types of association between disease and
hypothesized causal factors.
 (1) Statistically unassociated
 (2) Statistically associated
Causally
associated
Non·causally
associated
 Causally associated
Indirectly
associated
Directly
associated
Non-statistical association
 A non-statistical association between a
disease and a hypothesized causal factor is an
association that arises by chance
 Frequency of joint occurrence of the disease
and factor is no greater than would be
expected by chance
Example
 Mycoplasma felis has been isolated from the
eyes of some cats with conjunctivitis.
 This represents an association between the
Mycoplasma and conjunctivitis in these cats
 Surveys have shown that M. felis also can be
recovered from the conjunctivae of 80% of
apparently normal
 Analysis:
 Association between conjunctivitis and
the presence of M. felis arose by chance
Statistical association
 Variables are positively statistically
associated when they occur together more
frequently than would be expected by chance
 Negatively statistically associated when they
occur together less frequently than would be
expected by chance.
Path diagrams
 Indicating the paradigm
 (a) an example
 (b) of causal and non-causal statistical
associations.
 A = Cause of disease (explanatory variable); B
and C = manifestations of disease
 (response variables) causal association;
non-causal association.
B
 A
C
Infection with
haemonchus contortus
Abomasal mucosal
hyperplasia
Anaemia
Infection of cattle with Haemonchus
contortus
 If infection of cattle with Haemonchus contortus
were being investigated, then the following
positive statistical associations could be found:
 Between the presence of the parasite and
Abomasal mucosal hyperplasia;
 Between the presence of the parasite and
anaemia;
 BetweenAbomasal mucosal hyperplasia and
anaemia.
 The first two associations are causal and the
third non-causal
 Abomasal mucosal hyperplasia and infection
with H. contortus are risk factors for anaemia,
that is, their presence increases the risk of
anaemia
Confounding
 Confounding (Latin: confundere = to mix
together) is the effect of an extraneous
variable that can wholly or partly account for
an apparent association between variables
Confounder
 A variable that confounds is called a
confounding variable or confounder
 A confounding variable is distributed non-
randomly (i.e., positively or negatively
correlated with the explanatory and response
variables that are being studied)
 A confounding variable generally must:
 Be a risk factor for the disease that is
being studied;
 Be associated with the explanatory
variable, but not be a consequence of
exposure to it.
The association between coffee
drinking and pancreatic cancer
Schematic representation of the
issue of potential confounding
Causal models
 The associations and interactions between
direct and indirect causes can be viewed in
two ways, producing two causal 'models
Causal model 1
 The relationship of causes to their effects
allows classification of causes into two types:
 Sufficient
 Necessary
Sufficient cause
 A cause is sufficient if it inevitably produces an
effect (assuming that nothing happens that
interrupts the development of the effect, such as
death or prophylaxis).
 A sufficient cause virtually always comprises a
range of component causes; disease therefore is
multifactorial.
Example
 Distemper virus-cause of distemper, although
the sufficient cause actually involves
 Exposure to the virus
 Lack of immunity
 Other components.
 It is not necessary to identify all components
of a sufficient cause to prevent disease
because removal of one component may
render the cause insufficient
necessary cause
 If a cause is a component of every sufficient
cause, then it is necessary
 A necessary cause must always be present to
produce an effect
Example
 Cause that is necessary but not sufficient
is infection with Actinobacillus ligneresi,
which must occur before actinobacillosis
('wooden tongue') can develop
Component causes therefore include factors
that have been classified as
 Predisposing factors:
 Which increase the level of susceptibility
in the host (e.g., age and immune status)
 Enabling factors:
 Which facilitate manifestation of a
disease (e.g., housing and nutrition)
 Precipitating factors:
 which are associated with the definitive onset of
disease (e.g., many toxic and infectious agents)
 Reinforcing factors:
 Which tend to aggravate the presence of a disease
(e.g., repeated exposure to an infectious agent in
the absence of an immune response).
example
 Pneumonia is a disease that has sufficient
causes, none of which has a necessary
component.
 Pneumonia may have been produced in one case
by heat stress where a dry, dusty environment
allowed microscopic particulate matter to reach
the alveoli.
 Cold stress could produce a clinically similar
result
Formulating a causal
hypothesis
 First step in any epidemiological investigation
of cause is descriptive.
 A description of time, place, and population is
useful initially.
Time
 Associations with year, season, month, day,
or even hour in the case of food poisoning
investigations, should be considered.
 Information on climatic influences,
incubation periods and sources of infection
example
 An outbreak of Salmonellosis in a group of
cattle may be associated with the
introduction of infected cattle feed
Place
 The geographical distribution of a disease
may indicate an association with local
geological, management or ecological factors
 Epidemiological maps are a valuable aid to
identifying geographical associations
Population
 The type of animal that is affected often is of
considerable importance.
 Hereford cattle are more susceptible to
squamous cell carcinoma of the eye than
other breeds, suggesting that the cause may
be partly genetic
 An epidemiological investigation is similar to
any detective novel that unfolds a list of
'suspects' (possible causal factors), some of
which may be non-statistically associated
with a disease, and some statistically
associated with the disease, either causally or
non-causally.
Principles for establishing
cause: Hill's criteria
 The British medical statistician, Austin Bradford
Hill, proposed several criteria for establishing a
causal association including
 The time sequence of the events
 The strength of the association
 Biological gradient
 Consistency
 Compatibility with existing knowledge
Time sequence
 Cause must precede effect
 Unless bacterial infections were present
before the mares became infertile (incorrect
to infer the bacterial infections)
Strength of association
 If a factor is causal, then there will be a strong
positive statistical association between the
factor and the disease.
Biological gradient
 If a dose-response relationship can be found
between a factor and a disease, the
plausibility of a factor being causal is
increased.
 This is the basis of reasoning by the method
of concomitant variation
Examples
 Frequency of milking in relation to
Leptospirosis
 Smoking in relation to lung cancer
Consistency
 If an association exists in a number of
different circumstances, then a causal
relationship is probable.
 This is the basis of reasoning by the method
of agreement.
 An example is bovine hyperkeratosis
Example; Bovine hyperkeratosis
 The disease was called 'X disease' because initially the
cause was unknown. It occurred in different
circumstances:
 in cattle that were fed sliced bread;
 in calves that had been licking lubricating oil;
 in cattle that were in contact with wood preservative.
 The bread slicing machine was lubricated with a similar oil to that
which had been licked by the calves.The lubricating oil and the
wood preservative both contained chlorinated naphthalene.This
chemical was common to the different circumstances and
subsequently was shown to cause hyperkeratosis
Compatibility with existing
knowledge
 It is more reasonable to infer that a factor
causes a disease if a plausible biological
mechanism has been identified than if such a
mechanism is not known
Example
 Smoking can be suggested as a likely cause of
lung cancer because other chemical and
environmental pollutants are known to have
a carcinogenic effect on laboratory animals
THANKS

Associations[1]

  • 1.
    PROF. DR. MANSUR-UD-DINAHMAD Associations(Chap3)
  • 2.
    Variables  A variableis any observable event that can vary:  Examples:  Weight  Age of an animal  Number of cases of disease
  • 3.
    Study variable  Astudy variable is any variable that is being considered in an investigation
  • 4.
    Response and explanatory variables A response variable is one that is affected by another (explanatory) variable  Example:  Effects of dry cat food on the occurrence of urolithiasis, cat food is the explanatory variable and urolithiasis is the response variable
  • 5.
    Types of association Association is the degree of dependence or independence between two variables.  Main types of association 1. Non-statistical association; 2. Statistical association
  • 6.
  • 7.
    Types of associationbetween disease and hypothesized causal factors.  (1) Statistically unassociated  (2) Statistically associated Causally associated Non·causally associated
  • 8.
  • 9.
    Non-statistical association  Anon-statistical association between a disease and a hypothesized causal factor is an association that arises by chance  Frequency of joint occurrence of the disease and factor is no greater than would be expected by chance
  • 10.
    Example  Mycoplasma felishas been isolated from the eyes of some cats with conjunctivitis.  This represents an association between the Mycoplasma and conjunctivitis in these cats
  • 11.
     Surveys haveshown that M. felis also can be recovered from the conjunctivae of 80% of apparently normal  Analysis:  Association between conjunctivitis and the presence of M. felis arose by chance
  • 12.
    Statistical association  Variablesare positively statistically associated when they occur together more frequently than would be expected by chance  Negatively statistically associated when they occur together less frequently than would be expected by chance.
  • 13.
    Path diagrams  Indicatingthe paradigm  (a) an example  (b) of causal and non-causal statistical associations.  A = Cause of disease (explanatory variable); B and C = manifestations of disease  (response variables) causal association; non-causal association.
  • 14.
    B  A C Infection with haemonchuscontortus Abomasal mucosal hyperplasia Anaemia
  • 15.
    Infection of cattlewith Haemonchus contortus  If infection of cattle with Haemonchus contortus were being investigated, then the following positive statistical associations could be found:  Between the presence of the parasite and Abomasal mucosal hyperplasia;  Between the presence of the parasite and anaemia;  BetweenAbomasal mucosal hyperplasia and anaemia.
  • 16.
     The firsttwo associations are causal and the third non-causal  Abomasal mucosal hyperplasia and infection with H. contortus are risk factors for anaemia, that is, their presence increases the risk of anaemia
  • 17.
    Confounding  Confounding (Latin:confundere = to mix together) is the effect of an extraneous variable that can wholly or partly account for an apparent association between variables
  • 18.
    Confounder  A variablethat confounds is called a confounding variable or confounder  A confounding variable is distributed non- randomly (i.e., positively or negatively correlated with the explanatory and response variables that are being studied)
  • 19.
     A confoundingvariable generally must:  Be a risk factor for the disease that is being studied;  Be associated with the explanatory variable, but not be a consequence of exposure to it.
  • 20.
    The association betweencoffee drinking and pancreatic cancer
  • 21.
    Schematic representation ofthe issue of potential confounding
  • 22.
    Causal models  Theassociations and interactions between direct and indirect causes can be viewed in two ways, producing two causal 'models
  • 23.
    Causal model 1 The relationship of causes to their effects allows classification of causes into two types:  Sufficient  Necessary
  • 24.
    Sufficient cause  Acause is sufficient if it inevitably produces an effect (assuming that nothing happens that interrupts the development of the effect, such as death or prophylaxis).  A sufficient cause virtually always comprises a range of component causes; disease therefore is multifactorial.
  • 25.
    Example  Distemper virus-causeof distemper, although the sufficient cause actually involves  Exposure to the virus  Lack of immunity  Other components.
  • 26.
     It isnot necessary to identify all components of a sufficient cause to prevent disease because removal of one component may render the cause insufficient
  • 27.
    necessary cause  Ifa cause is a component of every sufficient cause, then it is necessary  A necessary cause must always be present to produce an effect
  • 28.
    Example  Cause thatis necessary but not sufficient is infection with Actinobacillus ligneresi, which must occur before actinobacillosis ('wooden tongue') can develop
  • 29.
    Component causes thereforeinclude factors that have been classified as  Predisposing factors:  Which increase the level of susceptibility in the host (e.g., age and immune status)  Enabling factors:  Which facilitate manifestation of a disease (e.g., housing and nutrition)
  • 30.
     Precipitating factors: which are associated with the definitive onset of disease (e.g., many toxic and infectious agents)  Reinforcing factors:  Which tend to aggravate the presence of a disease (e.g., repeated exposure to an infectious agent in the absence of an immune response).
  • 31.
    example  Pneumonia isa disease that has sufficient causes, none of which has a necessary component.  Pneumonia may have been produced in one case by heat stress where a dry, dusty environment allowed microscopic particulate matter to reach the alveoli.  Cold stress could produce a clinically similar result
  • 32.
    Formulating a causal hypothesis First step in any epidemiological investigation of cause is descriptive.  A description of time, place, and population is useful initially.
  • 33.
    Time  Associations withyear, season, month, day, or even hour in the case of food poisoning investigations, should be considered.  Information on climatic influences, incubation periods and sources of infection
  • 34.
    example  An outbreakof Salmonellosis in a group of cattle may be associated with the introduction of infected cattle feed
  • 35.
    Place  The geographicaldistribution of a disease may indicate an association with local geological, management or ecological factors  Epidemiological maps are a valuable aid to identifying geographical associations
  • 36.
    Population  The typeof animal that is affected often is of considerable importance.  Hereford cattle are more susceptible to squamous cell carcinoma of the eye than other breeds, suggesting that the cause may be partly genetic
  • 37.
     An epidemiologicalinvestigation is similar to any detective novel that unfolds a list of 'suspects' (possible causal factors), some of which may be non-statistically associated with a disease, and some statistically associated with the disease, either causally or non-causally.
  • 38.
    Principles for establishing cause:Hill's criteria  The British medical statistician, Austin Bradford Hill, proposed several criteria for establishing a causal association including  The time sequence of the events  The strength of the association  Biological gradient  Consistency  Compatibility with existing knowledge
  • 39.
    Time sequence  Causemust precede effect  Unless bacterial infections were present before the mares became infertile (incorrect to infer the bacterial infections)
  • 40.
    Strength of association If a factor is causal, then there will be a strong positive statistical association between the factor and the disease.
  • 41.
    Biological gradient  Ifa dose-response relationship can be found between a factor and a disease, the plausibility of a factor being causal is increased.  This is the basis of reasoning by the method of concomitant variation
  • 42.
    Examples  Frequency ofmilking in relation to Leptospirosis  Smoking in relation to lung cancer
  • 43.
    Consistency  If anassociation exists in a number of different circumstances, then a causal relationship is probable.  This is the basis of reasoning by the method of agreement.  An example is bovine hyperkeratosis
  • 44.
    Example; Bovine hyperkeratosis The disease was called 'X disease' because initially the cause was unknown. It occurred in different circumstances:  in cattle that were fed sliced bread;  in calves that had been licking lubricating oil;  in cattle that were in contact with wood preservative.  The bread slicing machine was lubricated with a similar oil to that which had been licked by the calves.The lubricating oil and the wood preservative both contained chlorinated naphthalene.This chemical was common to the different circumstances and subsequently was shown to cause hyperkeratosis
  • 45.
    Compatibility with existing knowledge It is more reasonable to infer that a factor causes a disease if a plausible biological mechanism has been identified than if such a mechanism is not known
  • 46.
    Example  Smoking canbe suggested as a likely cause of lung cancer because other chemical and environmental pollutants are known to have a carcinogenic effect on laboratory animals
  • 47.