Downloaded 15 times

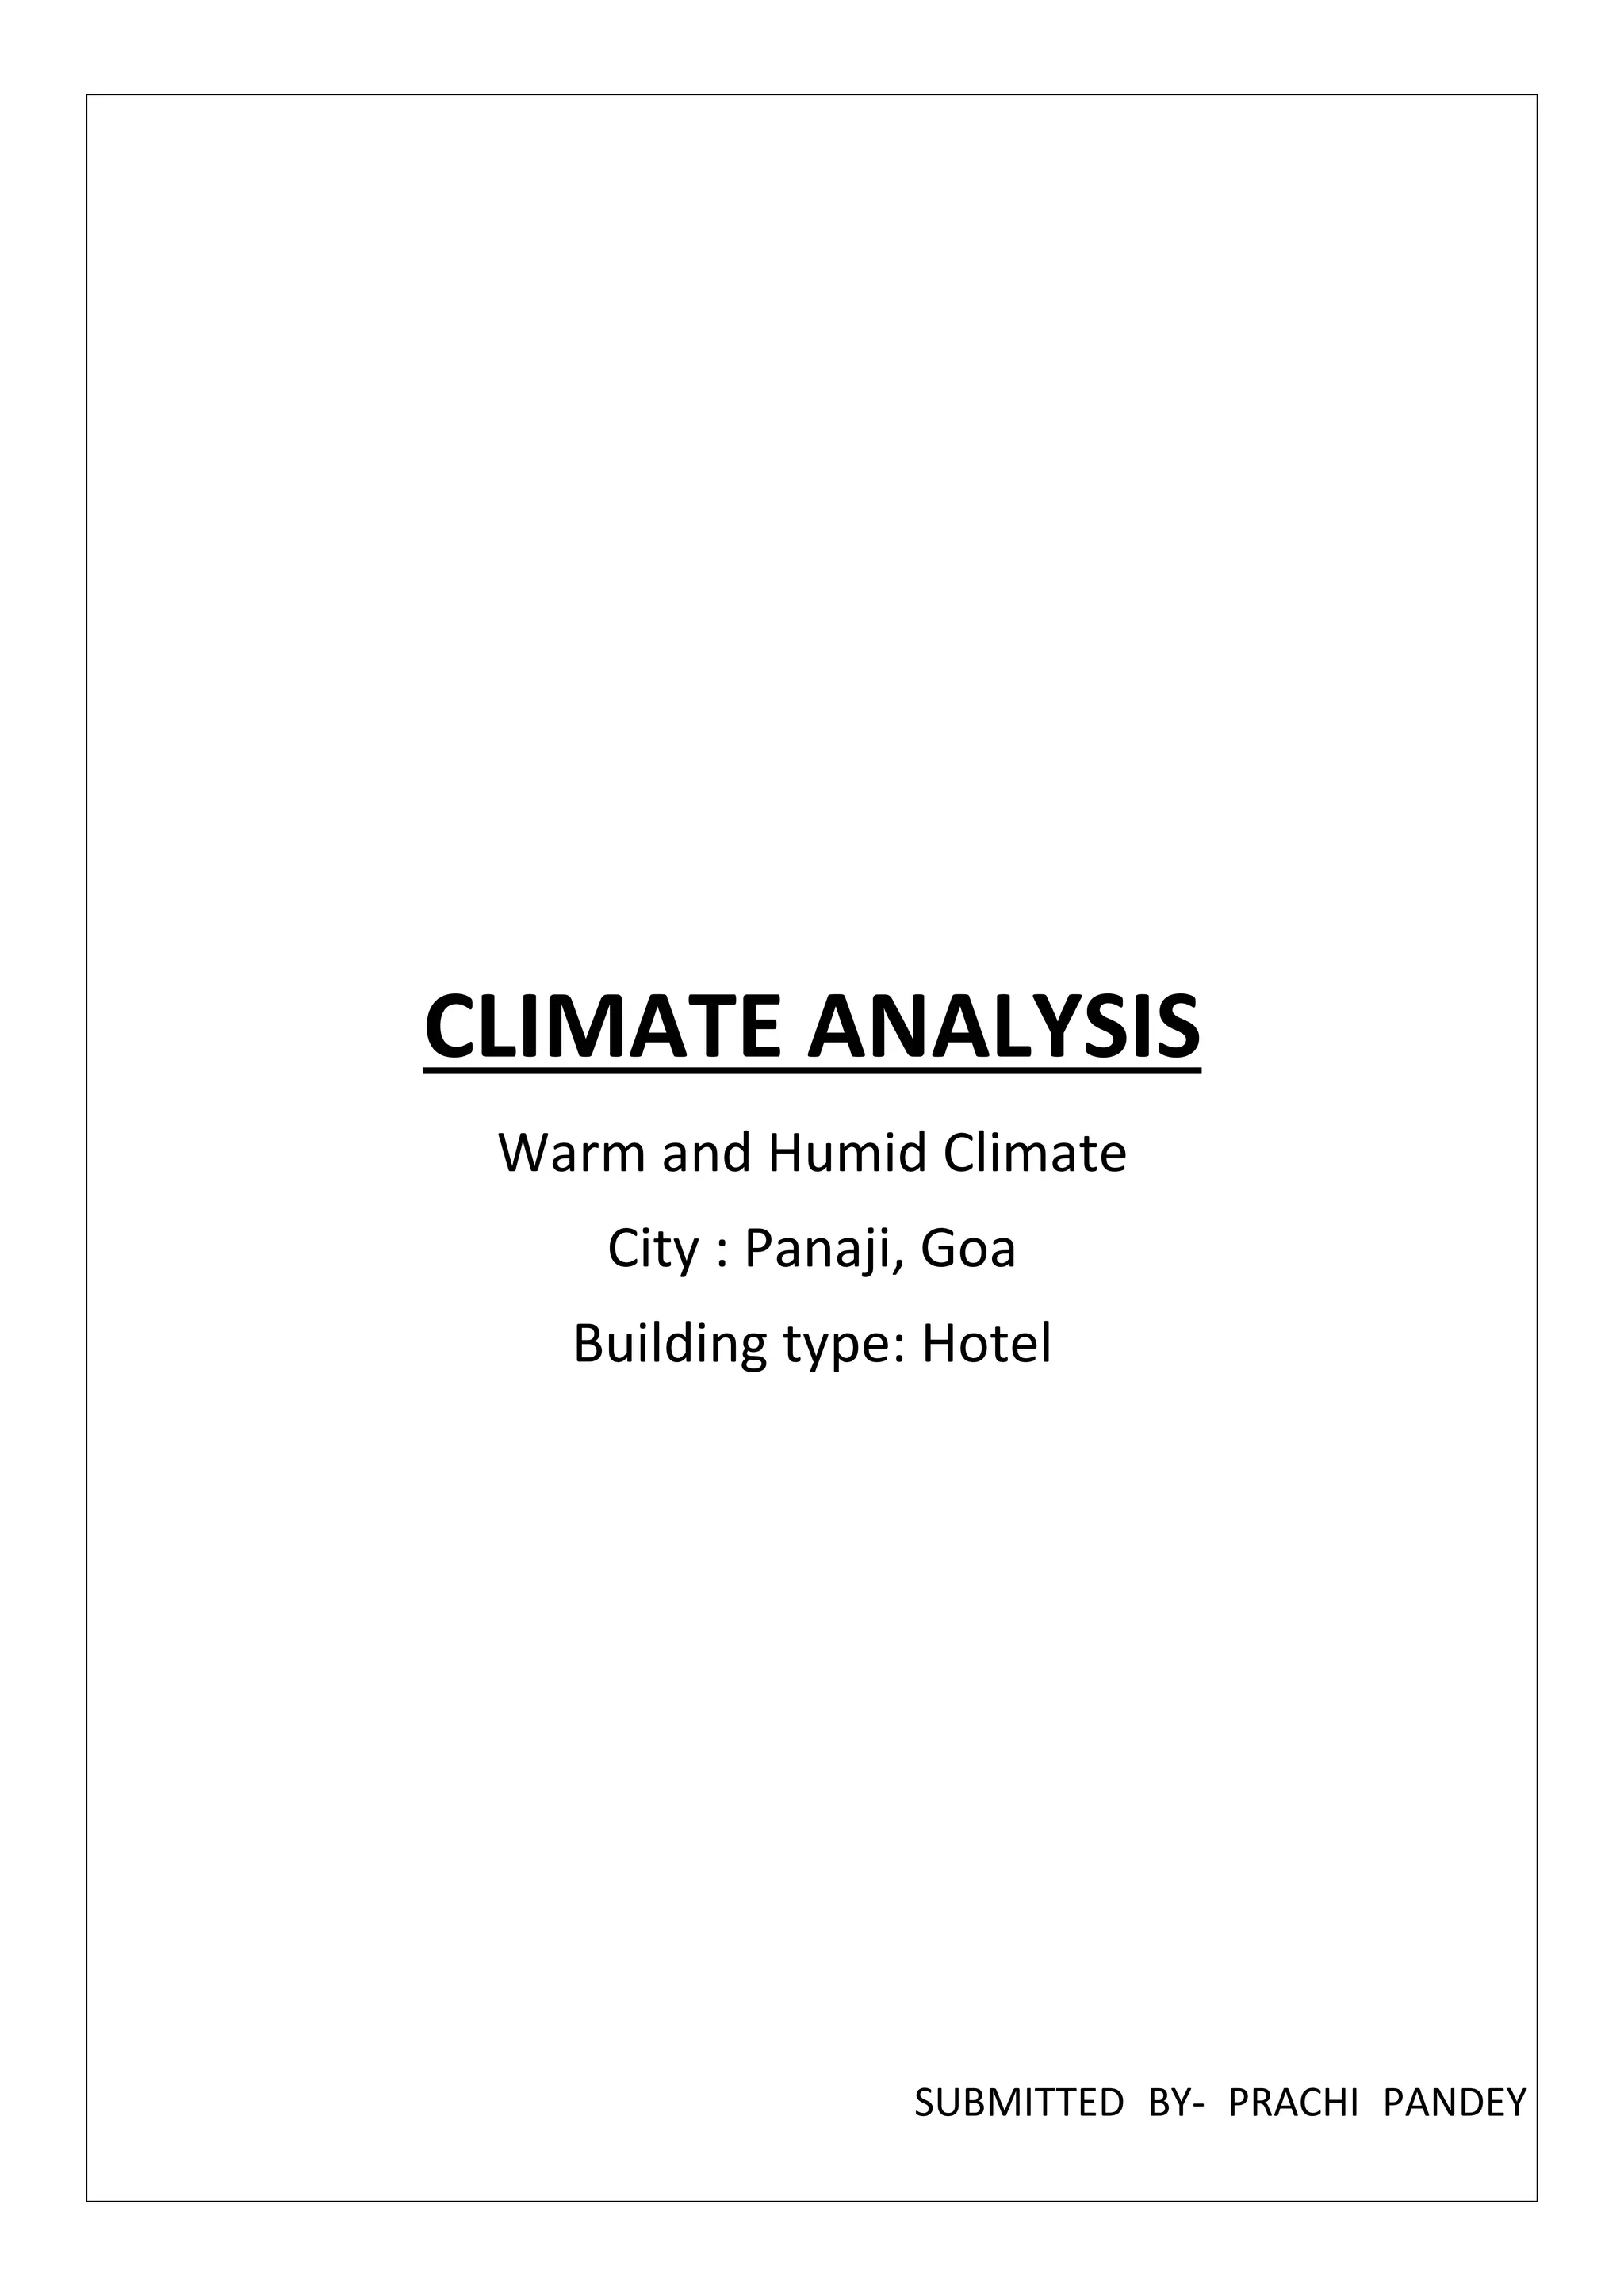
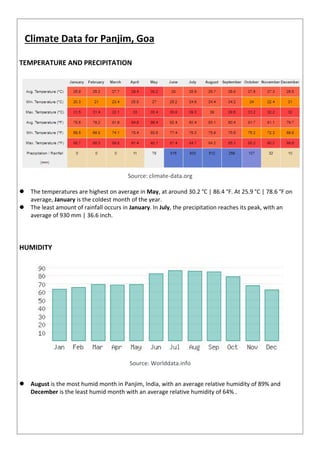
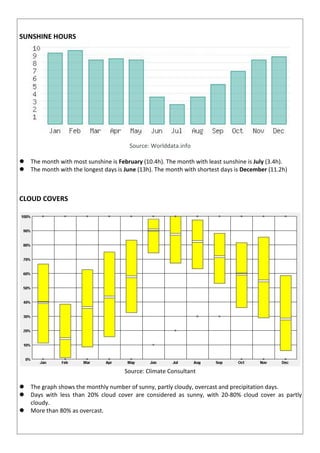
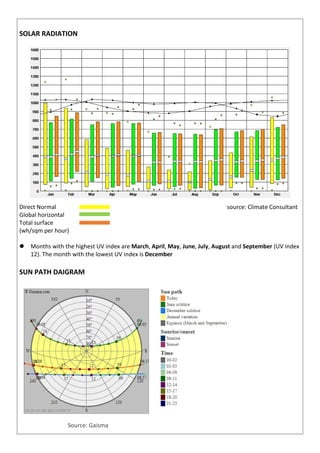
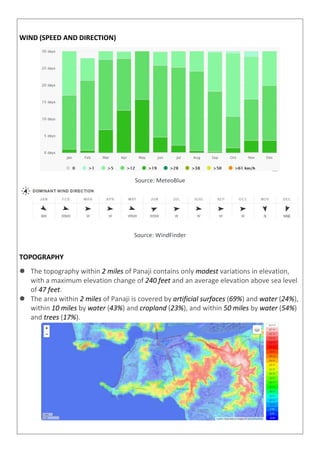
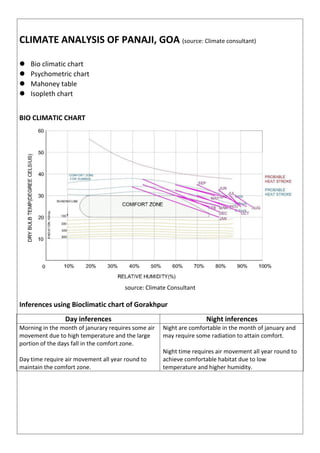
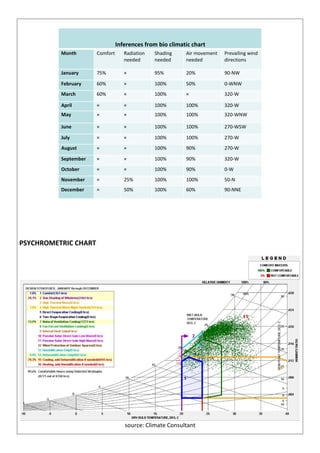
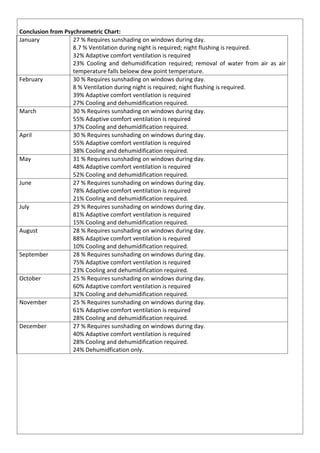
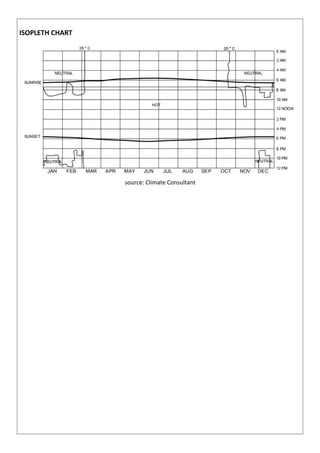
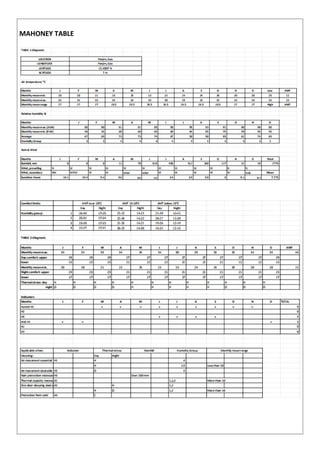


The document analyzes the climate of Panaji, Goa through data on temperature, precipitation, humidity, sunshine hours, cloud cover, solar radiation, wind speed and direction, and topography. It discusses the warm and humid climate with highest average temperatures in May of 30.2°C and lowest in January of 25.9°C. Humidity is highest in August at 89% on average. Various charts are presented to analyze the climate including bioclimatic charts, psychrometric charts, Mahoney tables, and isopleth charts. Design recommendations are provided focusing on passive design strategies like natural ventilation, solar orientation, shading devices, and vegetation.


