Often engineers are tasked with communicating equipment specifications with suppliers, where process data needs to be exchanged for engineering quotations & orders. Any dearth of data would need to be computed for which process related queries are sometimes sent back to the process engineer’s desk for the requested data.
The following tutorial is a refresher for non-process engineers such as project engineers, Piping, Instrumentation, Static & Rotating Equipment engineers to conduct basic process calculations related to estimation of mass %, volume %, mass flow, actual & standard volumetric flow, gas density, parts per million (ppm) by weight & by volume.
COURSE LINK:
https://www.chemicalengineeringguy.com/courses/gas-absorption-stripping/
Introduction:
Gas Absorption is one of the very first Mass Transfer Unit Operations studied in early process engineering. It is very important in several Separation Processes, as it is used extensively in the Chemical industry.
Understanding the concept behind Gas-Gas and Gas-Liquid mass transfer interaction will allow you to understand and model Absorbers, Strippers, Scrubbers, Washers, Bubblers, etc…
We will cover:
- REVIEW: Of Mass Transfer Basics required
- GAS-LIQUID interaction in the molecular level, the two-film theory
- ABSORPTION Theory
- Application of Absorption in the Industry
- Counter-current & Co-current Operation
- Several equipment to carry Gas-Liquid Operations
- Bubble, Spray, Packed and Tray Column equipments
- Solvent Selection
- Design & Operation of Packed Towers
- Pressure drop due to packings
- Solvent Selection
- Design & Operation of Tray Columns
- Single Component Absorption
- Single Component Stripping/Desorption
- Diluted and Concentrated Absorption
- Basics: Multicomponent Absorption
- Software Simulation for Absorption/Stripping Operations (ASPEN PLUS/HYSYS)
----
Please show the love! LIKE, SHARE and SUBSCRIBE!
More likes, sharings, suscribers: MORE VIDEOS!
-----
CONTACT ME
Chemical.Engineering.Guy@Gmail.com
www.ChemicalEngineeringGuy.com
http://facebook.com/Chemical.Engineering.Guy
You speak spanish? Visit my spanish channel -www.youtube.com/ChemEngIQA
Course by Chemical Engineering Guy
Check out full course:
http://www.chemicalengineeringguy.com/courses/aspen-plus-physical-properties-course/
Ask me for special discounts, or checkout "SURPIRSE" tab in my site for special discounts.
This is course on Process Simulation will show you how to model, manipulate and report thermodynamic, transport, physical and chemical properties of substances.
You will learn about:
Physical Property Environment
Physical Property Method & Method Assistant
Fluid and Property Packages
Physical property input, modeling, estimation and regression
Thermodynamic Properties (Material/Energy balances and Thermodynamic Processes)
Transport Properties for (Mass/Heat/Momentum Transfer)
Equilibrium Properties (Vapor-Liquid, Liquid-Liquid, etc...)
Getting Results (Plots, Graphs, Tables)
This is an excellent way to get started with Aspen Plus. Understanding the physical property environment will definitively help you in the simulation and flowsheet creation!
This is a "workshop-based" course, there is about 50% theory and about 50% practice!
COURSE LINK:
https://www.chemicalengineeringguy.com/courses/gas-absorption-stripping/
Introduction:
Gas Absorption is one of the very first Mass Transfer Unit Operations studied in early process engineering. It is very important in several Separation Processes, as it is used extensively in the Chemical industry.
Understanding the concept behind Gas-Gas and Gas-Liquid mass transfer interaction will allow you to understand and model Absorbers, Strippers, Scrubbers, Washers, Bubblers, etc…
We will cover:
- REVIEW: Of Mass Transfer Basics required
- GAS-LIQUID interaction in the molecular level, the two-film theory
- ABSORPTION Theory
- Application of Absorption in the Industry
- Counter-current & Co-current Operation
- Several equipment to carry Gas-Liquid Operations
- Bubble, Spray, Packed and Tray Column equipments
- Solvent Selection
- Design & Operation of Packed Towers
- Pressure drop due to packings
- Solvent Selection
- Design & Operation of Tray Columns
- Single Component Absorption
- Single Component Stripping/Desorption
- Diluted and Concentrated Absorption
- Basics: Multicomponent Absorption
- Software Simulation for Absorption/Stripping Operations (ASPEN PLUS/HYSYS)
----
Please show the love! LIKE, SHARE and SUBSCRIBE!
More likes, sharings, suscribers: MORE VIDEOS!
-----
CONTACT ME
Chemical.Engineering.Guy@Gmail.com
www.ChemicalEngineeringGuy.com
http://facebook.com/Chemical.Engineering.Guy
You speak spanish? Visit my spanish channel -www.youtube.com/ChemEngIQA
Get full Course here:
www.ChemicalEngineeringGuy.com/Courses
The BASIC Aspen HYSYS Course will show you how to model and simulate Processes (From Petrochemical, to Ammonia Synthesis and Polymerisation).
Analysis of Unit Operation will help you in order to optimise the Chemical Plant.
This is helpful for students, teachers, engineers and researchers in the area of R&D and Plant Design/Operation.
The course is didactic, with a lot of applied theory and Workshops/Study cases.
At the end of the course you will be able to setup a simulation, run it, get results and more important, analysis of the process for further optimization.
Chemical Engineers
Process Engineers
Students related to engineering fields
Teachers willing to learn more about process simulation
Petrochemical Engineers
COURSE LINK:
https://www.chemicalengineeringguy.com/courses/gas-absorption-stripping/
Introduction:
Gas Absorption is one of the very first Mass Transfer Unit Operations studied in early process engineering. It is very important in several Separation Processes, as it is used extensively in the Chemical industry.
Understanding the concept behind Gas-Gas and Gas-Liquid mass transfer interaction will allow you to understand and model Absorbers, Strippers, Scrubbers, Washers, Bubblers, etc…
We will cover:
- REVIEW: Of Mass Transfer Basics required
- GAS-LIQUID interaction in the molecular level, the two-film theory
- ABSORPTION Theory
- Application of Absorption in the Industry
- Counter-current & Co-current Operation
- Several equipment to carry Gas-Liquid Operations
- Bubble, Spray, Packed and Tray Column equipments
- Solvent Selection
- Design & Operation of Packed Towers
- Pressure drop due to packings
- Solvent Selection
- Design & Operation of Tray Columns
- Single Component Absorption
- Single Component Stripping/Desorption
- Diluted and Concentrated Absorption
- Basics: Multicomponent Absorption
- Software Simulation for Absorption/Stripping Operations (ASPEN PLUS/HYSYS)
----
Please show the love! LIKE, SHARE and SUBSCRIBE!
More likes, sharings, suscribers: MORE VIDEOS!
-----
CONTACT ME
Chemical.Engineering.Guy@Gmail.com
www.ChemicalEngineeringGuy.com
http://facebook.com/Chemical.Engineering.Guy
You speak spanish? Visit my spanish channel -www.youtube.com/ChemEngIQA
Course by Chemical Engineering Guy
Check out full course:
http://www.chemicalengineeringguy.com/courses/aspen-plus-physical-properties-course/
Ask me for special discounts, or checkout "SURPIRSE" tab in my site for special discounts.
This is course on Process Simulation will show you how to model, manipulate and report thermodynamic, transport, physical and chemical properties of substances.
You will learn about:
Physical Property Environment
Physical Property Method & Method Assistant
Fluid and Property Packages
Physical property input, modeling, estimation and regression
Thermodynamic Properties (Material/Energy balances and Thermodynamic Processes)
Transport Properties for (Mass/Heat/Momentum Transfer)
Equilibrium Properties (Vapor-Liquid, Liquid-Liquid, etc...)
Getting Results (Plots, Graphs, Tables)
This is an excellent way to get started with Aspen Plus. Understanding the physical property environment will definitively help you in the simulation and flowsheet creation!
This is a "workshop-based" course, there is about 50% theory and about 50% practice!
COURSE LINK:
https://www.chemicalengineeringguy.com/courses/gas-absorption-stripping/
Introduction:
Gas Absorption is one of the very first Mass Transfer Unit Operations studied in early process engineering. It is very important in several Separation Processes, as it is used extensively in the Chemical industry.
Understanding the concept behind Gas-Gas and Gas-Liquid mass transfer interaction will allow you to understand and model Absorbers, Strippers, Scrubbers, Washers, Bubblers, etc…
We will cover:
- REVIEW: Of Mass Transfer Basics required
- GAS-LIQUID interaction in the molecular level, the two-film theory
- ABSORPTION Theory
- Application of Absorption in the Industry
- Counter-current & Co-current Operation
- Several equipment to carry Gas-Liquid Operations
- Bubble, Spray, Packed and Tray Column equipments
- Solvent Selection
- Design & Operation of Packed Towers
- Pressure drop due to packings
- Solvent Selection
- Design & Operation of Tray Columns
- Single Component Absorption
- Single Component Stripping/Desorption
- Diluted and Concentrated Absorption
- Basics: Multicomponent Absorption
- Software Simulation for Absorption/Stripping Operations (ASPEN PLUS/HYSYS)
----
Please show the love! LIKE, SHARE and SUBSCRIBE!
More likes, sharings, suscribers: MORE VIDEOS!
-----
CONTACT ME
Chemical.Engineering.Guy@Gmail.com
www.ChemicalEngineeringGuy.com
http://facebook.com/Chemical.Engineering.Guy
You speak spanish? Visit my spanish channel -www.youtube.com/ChemEngIQA
Get full Course here:
www.ChemicalEngineeringGuy.com/Courses
The BASIC Aspen HYSYS Course will show you how to model and simulate Processes (From Petrochemical, to Ammonia Synthesis and Polymerisation).
Analysis of Unit Operation will help you in order to optimise the Chemical Plant.
This is helpful for students, teachers, engineers and researchers in the area of R&D and Plant Design/Operation.
The course is didactic, with a lot of applied theory and Workshops/Study cases.
At the end of the course you will be able to setup a simulation, run it, get results and more important, analysis of the process for further optimization.
Chemical Engineers
Process Engineers
Students related to engineering fields
Teachers willing to learn more about process simulation
Petrochemical Engineers
Slides for the eLearning course Separation and purification processes in biorefineries (https://open-learn.xamk.fi) in IMPRESS project.
Section: Distillation
Subject: 1.1 Vapor Liquid Equilibrium
An overview of distillation column design concepts and major design considerations. Explains distillation column design concepts, what you would provide to a professional distillation column designer, and what you can expect back from a distillation system design firm. To speak with an engineer about your distillation column project, call EPIC at 314-207-4250.
Estimation of Pressure Drop in Pipe Systems
0 INTRODUCTION/PURPOSE
1 SCOPE
2 FIELD OF APPLICATION
3 DEFINITIONS
3.1 units
4 SOURCES OF DATA
5 BASIC CONCEPTS
5.1 Equation for Pressure Change in a Flowing
Fluid
5.2 Static and Stagnation Pressures
5.3 Sonic Flow
6 INCOMPRESSIBLE FLOW IN PIPES OF CONSTANT
CROSS-SECTION
6.1 Straight Circular Pipes
6.2 Ducts of Non-circular Cross-section
6.3 Coils
6.4 General Equation for Incompressible Flow
in Pipes of Constant Cross-section
7 COMPRESSIBLE FLOW IN PIPES OF CONSTANT
CROSS-SECTION
7.1 Isothermal Flow
7.2 Adiabatic Flow
7.3 Estimation of Pressure Drop for Adiabatic
Flow in Pipes of Constant Cross-section
7.4 Ratio of Isothermal to Adiabatic Pressure Drop
8 FLOW IN PIPE FITTINGS
8.1 Incompressible Flow
8.2 Compressible Flow
9 FLOW IN BENDS
9.1 Incompressible Flow in Bends
9.2 Compressible Flow in Bends
10 CHANGES IN CROSS-SECTIONAL AREA
9.1 Incompressible Flow
9.2 Compressible Flow
11 ORIFICES, NOZZLES AND VENTURIS
11.1 Incompressible Flow through an Orifice
11.2 Compressible Flow through an Orifice or Nozzle
11.3 Venturi Choke Tubes
12 VALVES
12.1 General
12.2 Incompressible Flow in Valves
12.2 Compressible Flow in Valves
13 COMBINING AND DIVIDING FLOW
9.1 Incompressible Flow
9.2 Compressible Flow
14 COMPUTER PROGRAMS FOR FLUID FLOW
15 NOMENCLATURE
16 REFERENCES
APPENDICES
A BASIC THERMODYNAMICS
B COMPRESSIBLE FLOW THROUGH ORIFICES
C THE ‘TWO-K’ METHOD FOR FITTING PRESSURE LOSS
CENTRIFUGAL COMPRESSOR SETTLE OUT CONDITIONS TUTORIALVijay Sarathy
Centrifugal Compressors are a preferred choice in gas transportation industry, mainly due to their ability to cater to varying loads. In the event of a compressor shutdown as a planned event, i.e., normal shutdown (NSD), the anti-surge valve is opened to recycle gas from the discharge back to the suction (thereby moving the operating point away from the surge line) and the compressor is tripped via the driver (electric motor or Gas turbine / Steam Turbine). In the case of an unplanned event, i.e., emergency shutdown such as power failure, the compressor trips first followed by the anti-surge valve opening. In doing so, the gas content in the suction side & discharge side mix.
Therefore, settle out conditions is explained as the equilibrium pressure and temperature reached in the compressor piping and equipment volume following a compressor shutdown
These slides may be used for a part of Advanced level course in Chemical Reaction Engineering. I taught this course to Masters level students covering 1.5 credit hours.
LINK:
https://www.chemicalengineeringguy.com/courses/aspen-plus-intermediate-course/
The INTERMEDIATE Aspen Plus Course will show you how to model and simulate more complex Processes
Analysis of Unit Operation will help you in order to simulate more complex chemical processes, as well as to analyse and optimize existing ones.
You will learn about:
- Better Flowsheet manipulation
- Hierarchy, Flowsheeting, Sub-flowsheet creation
- Logical Operators / Manipulators
- Understand Property Method Selection and its effects on simulation results
- Study of more rigorous unit operations
- Model Analysis Tools such as sensitivity and optimization
- Reporting Relevant Results Plot relevant data for Heaters, Columns ,Reactors, Pumps
- Temperature Profiles, Concentration Profile, Pump Curves, Heat Curves, etc…
- Up to 3 Case Studies (in-depth analysis)
All theory is backed up by more than 30 Practical Workshops!
At the end of the course you will be able to setup more complex processes, increase your simulation and flow sheeting techniques, run it and debugging, get relevant results and make a deeper analysis of the process for further optimization.
This presentation is made to provide the overall conceptual knowledge on Chilton Colburn Analogy. It includes basis, importance, assumption, advantages, limitations and applications in addition to the derivation. Make It Useful!
Calculation of an Ammonia Plant Energy Consumption: Gerard B. Hawkins
Calculation of an Ammonia Plant Energy Consumption:
Case Study: #06023300
Plant Note Book Series: PNBS-0602
CONTENTS
0 SCOPE
1 CALCULATION OF NATURAL GAS PROCESS FEED CONSUMPTION
2 CALCULATION OF NATURAL GAS PROCESS FUEL CONSUMPTION
3 CALCULATION OF NATURAL GAS CONSUMPTION FOR PILOT BURNERS OF FLARES
4 CALCULATION OF DEMIN. WATER FROM DEMIN. UNIT
5 CALCULATION OF DEMIN. WATER TO PACKAGE BOILERS
6 CALCULATION OF MP STEAM EXPORT
7 CALCULATION OF LP STEAM IMPORT
8 DETERMINATION OF ELECTRIC POWER CONSUMPTION
9 DETERMINATION OF THE TOTAL ENERGY CONSUMPTION OF THE AMMONIA PLANT ISBL
10 ADJUSTMENT OF ELECTRIC POWER CONSUMPTION FOR TEST RUN CONDITIONS
11 CALCULATION OF AMMONIA SHARE IN MP STEAM CONSUMPTION IN UTILITIES
12 CALCULATION OF AMMONIA SHARE IN ELECTRIC POWER CONSUMPTION IN UTILITIES
13 DETERMINATION OF THE TOTAL ENERGY CONSUMPTION OF THE AMMONIA PLANT OSBL
14 DETERMINATION OF THE TOTAL ENERGY CONSUMPTION OF THE AMMONIA PLANT
Optimization of performance and emission characteristics of dual flow diesel ...eSAT Journals
Abstract
Depleting sources of fossil fuels coupled with after effects of exhaust gases on environment i.e. global warming and climate change has necessitated the need for development and use of alternate biodegradable fuels. In this present study optimization of performance and emission characteristics has been carried out using dual flow of CNG and Diesel with varying EGR under varying load by Taguchi method. Optimum values of output response parameters have been calculated with the help of regression equation and influence of various factors on output response has carried out with the help of analysis of variance.
Keywords: Taguchi method, CNG, EGR, biodegradable fuels
Empirical Approach to Hydrate Formation in Natural Gas PipelinesVijay Sarathy
Natural Gas Pipelines often suffer from production losses due to hydrate plugging. For an effective hydrate plug to form, factors can vary from pipeline operating pressure and temperature, presence of water below its dew point, extreme winter conditions & Joule Thomson cooling. In the event hydrates form in the pipeline section, their consequence depends on how well the hydrates agglomerate to grow and form a column. If the pipeline section temperature is only at par with the hydrate formation temperature, the particles do no agglomerate; instead they have to cross the metastable region which is of the order of 50C to 60C, before hydrate formation accelerates to block the pipeline.
Although engineering softwares exist to estimate pipeline process conditions and also generate a P-T hydrate curve, the following tutorial provides a guidance summary to estimate the expected pipeline temperature profile and the associated hydrate formation temperatures.
Process Design for Natural Gas TransmissionVijay Sarathy
Compressor stations form a keyl part of the natural gas pipeline network that moves natural gas from individual producing well sites to end users. As natural gas moves through a pipeline, distance, friction, and elevation differences slow the movement of the gas, and reduce pressure. Compressor stations are placed strategically within the gathering and transportation pipeline network to help maintain the pressure and flow of gas to market. The following is a tutorial to perform process design of a natural gas transmission system.
Thermochemical study of Energy associated with reactions using python.Nagesh NARASIMHA PRASAD
Thermochemistry deals with the study of the energy and heat associated with chemical reactions or physical transformations. With numerous products and reactants it’s a very complex phenomenon to analyse and sometimes even impossible to obtain accurate results analytically. Using a programming language to solve or compute such complex problems gives reliable results. CANTERA is an open source tool based on python programming language which can be used to solve chemical, thermodynamics processes. We make use of CANTERA in this project to obtain chemical composition of products and compare it with analytical solutions and also to calculate flame temperature, enthalpy etc.
Key Thermo-Physical Properties of Light Crude OilsVijay Sarathy
Process facilities are equipped with protection measures, such as pressure safety valves (PSV) & as a minimum, PSVs are sized for a fire case. To do so for a pressure vessel containing crude oil a key parameter is the Latent heat of Vaporization [Hv].
For pure components, the Joback’s Method can be employed which uses basic structural information of the chemical molecule to estimate thermo-physical data. However it can be complex for equipment that contains crude oil because the plus fractions [C7+] can contain thousands of straight chain, cyclic & functional groups. Therefore by splitting and lumping the crude fractions, a smaller number of components are arrived at, to characterize and be able to apply Equation of State (EoS) correlations to estimate the fraction’s thermo-physical properties.
Engineers often use softwares to perform gas compressor calculations to estimate compressor duty, temperatures, adiabatic & polytropic efficiencies, driver & cooler duty. In the following exercise, gas compressor calculations for a pipeline composition are shown as an example case study.
An Offshore Natural Gas Transmission Pipeline Model and Analysis for the Pred...IOSRJAC
The purpose of this paper is to model and analyze an existing natural gas transmission pipeline – the 24-inch, 5km gas export pipeline of the Amenam-Kpono field, Niger Delta, Nigeria – to determine properties such as pressure, temperature, density, flow velocity and, in particular, dew point, occurring at different segments of the pipeline, and to compare these with normal pipeline conditions in order to identify the segments most susceptible to condensation/hydrate formation so that cost-effective and efficient preventive/remedial actions can be taken. The analysis shows that high pressure and low temperature favor condensation/hydrate formation, and that because these conditions are more likely in the lower half of the pipeline system, remedial/preventive measures such as heating/insulation and inhibition injection should be channeled into that segment for cost optimization..
Effect of Compression Ratio on Performance of Combined Cycle Gas Turbineijsrd.com
It is known the performance of a gas turbine (GT) has strong dependence of climate conditions. A suitable solution to minimize this negative effect is to raise inlet turbine temperature and reduce temperature of inlet air to GT compressor. Combined cycles gas turbines (CCGT) are a lot used to acquire a high-efficiency power plant. Increases the peak compression ratio has been proposed to improve the combined-cycle gas-turbine performance. The code of the performance model for CCGT power plant was developed utilizing the MATLAB software. The simulating results show that the overall efficiency increases with the increase of the peak compression ratio. The total power output increases with the increase of the peak compression ratio. The peak overall efficiency occurs at the higher compression ratio with low ambient temperature and higher turbine inlet temperature. The overall thermal efficiencies for CCGT are higher compared to gas-turbine plants.
Exploring LPG Cylinders for Medical Oxygen - A Preliminary StudyVijay Sarathy
The following article is a study to explore the usage of LPG cylinders for medical oxygen in times of medical emergencies. The study aims at understanding how long medical oxygen can be supplied to cater to patients requiring supply between 0.5 lit/min to 2 lit/min.
Heating Value Estimation for Natural Gas ApplicationsVijay Sarathy
For natural gas custody transfer applications, the gross calorific or gross heating value is necessary for both the buyer and seller to estimate the sales price of natural gas. In case of fuel suppliers, heat content is expressed in terms of Higher Heating value (HHV) to estimate fuel charges in kWh. Whereas Lower Heating Value (LHV) is employed to estimate fuel requirements since the total energy input for a specific power output is already fixed. To understand how fuel heating values are affected, LHV and HHV is explained as,
Evaporation Pond Process Design in Oil & Gas IndustryVijay Sarathy
In the upstream oil & gas industry, produced water is a by-product of well production. Hydrocarbon wells initially produce less water but in late field life, the water content increases. Produced water can contain oil carryover and a host of salts with TDS ranging anywhere from 2,000 mg/L to 40,000 mg/L for which evaporation ponds are used to concentrate by evaporating the associated water.
The energy requirement consists of pumping concentrate to the pond and in some cases aeration is provided to enhance the rate of evaporation. The ponds are lined with synthetic liner material to prevent seepage of water into the soil. In case of any corrosive compounds in the water, the number of layers is increased. Landscape and topography play a role in setting up evaporation ponds and it is necessary to have a flat terrain to avoid any overflow of the contents.
Evaporation ponds must also ensure that the amount of water entering is minimized and avoid any flooding. As part of waste disposal, the ponds maybe designed to accumulate sludge over the life time of the operating wells or can be periodically removed. The below figure depicts an evaporation pond.
The following article focuses on estimating the rate of evaporation, water surface temperature and rate of heat transfer to the water in an evaporation pond.
Cooling Towers in Process Industries are part of Utilities design. As the name suggests their primary purpose is to provide cooling requirements to industrial hot water from unit operations & unit processes. Examples include chillers and air conditioners. The principle of operation is to circulate hot water through a tower and allow heat dissipation to the ambient. Cooling towers can operate by natural draft or forced draft methods wherein fans are used to increase heat transfer.
Design Considerations for Antisurge Valve SizingVijay Sarathy
Centrifugal Compressors experience a phenomenon called “Surge” which can be defined as a situation where a flow reversal from the discharge side back into the compressor casing causing mechanical damage.
The reasons are multitude ranging from driver failure, power failure, upset process conditions, start up, shutdown, failure of anti-surge mechanisms, check valve failure to operator error to name a few. The consequences of surge are more mechanical in nature whereby ball bearings, seals, thrust bearing, collar shafts, impellers wear out and sometimes depending on the how powerful are the surge forces, cause fractures to the machinery parts due to excessive vibrations.
The following tutorial explains how to size an anti-surge valve for a single stage VSD system for Concept/Basic Engineering purposes.
Gas Compression Stages – Process Design & OptimizationVijay Sarathy
The following tutorial demonstrates how to estimate the required number of compression stages and optimize the individual pressure ratio in a multistage centrifugal compression system.
Gas Condensate Separation Stages – Design & OptimizationVijay Sarathy
The life cycle of an oil & gas venture begins at the wellhead where subsurface engineers work their way through surveying, drilling, laying production tubing and well completions. Once a well is completed, gathering lines from each well is laid to gather hydrocarbons and transported via a main trunk line to a gas oil separation unit (GOSP) to be processed further to enhance their product value for sales. Gas condensate wells consist of natural gas which is rich in heavier hydrocarbons that are recovered as liquids in separators in field facilities or gas-oil separation plants (GOSP).
The following tutorial is aimed at demonstrating how to optimize and provide the required number of separation stages to process a gas condensate mixture and separate them into their respective vapour phase and liquid phase – termed as “Stage Separation”. Stage separation consists of laying a series of separators which operate at consecutive lower pressures to strip out vapours from the well liquids & resulting in a stabilized liquid. Prior to any hydrocarbon processing in a gas processing plant or a refinery, it is imperative to maximize the liquid recovery as well as provide a stabilized liquid hydrocarbon.
ECONOMIC INSULATION FOR INDUSTRIAL PIPINGVijay Sarathy
Thermal Insulation for Industrial Piping is a common method to reduce energy costs in production facilities while meeting process requirements. Insulation represents a capital expenditure & follows the law of diminishing returns. Hence the thermal effectiveness of insulation needs to be justified by an economic limit, beyond which insulation ceases to effectuate energy recovery. To determine the effectiveness of an applied insulation, the insulation cost is compared with the associated energy losses & by choosing the thickness that gives the lowest total cost, termed as ‘Economic Thickness’.
The following tutorial provides guidance to estimate the economic thickness for natural gas piping in winter conditions as an example case study.
Flash Steam and Steam Condensates in Return LinesVijay Sarathy
In power plants, boiler feed water is subjected to heat thereby producing steam which acts as a motive force for a steam turbine. The steam upon doing work loses energy to form condensate and is recycled/returned back to reduce the required make up boiler feed water (BFW).
Recycling steam condensate poses its own challenges. Flash Steam is defined as steam generated from steam condensate due to a drop in pressure. When high pressure and temperature condensate passes through process elements such as steam traps or pressure reducing valves to lose pressure, the condensate flashes to form steam. Greater the drop in pressure, greater is the flash steam generated. This results in a two phase flow in the condensate return lines.
Piping systems associated with production, transporting oil & gas, water/gas injection into reservoirs, experience wear & tear with time & operations. There would be metal loss due to erosion, erosion-corrosion and cavitation to name a few. The presence of corrosion defects provides a means for localized fractures to propagate causing pipe ruptures & leakages. This also reduces the pipe/pipeline maximum allowable operating pressure [MAOP].
The following document covers methods by DNV standards to quantitatively estimate the erosion rate for ductile pipes and bends due to the presence of sand. It is to be noted that corrosion can occur in many other scenarios such as pipe dimensioning, flow rate limitations, pipe performance such as pressure drop, vibrations, noise, insulation, hydrate formation and removal, severe slug flow, terrain slugging and also upheaval buckling. However these aspects are not covered in this document.
Based on the erosional rates of pipes and bends, the Maximum Safe Pressure/Revised MAOP is evaluated based on a Level 1 Assessment procedure for the remaining strength of the pipeline. The Level 1 procedures taken up in this tutorial are RSTRENG 085dL method, DNVGL RP F-101 (Part-B) and PETROBRAS’s PB Equation.
Natural Gas Pipeline Transmission Cost & EconomicsVijay Sarathy
In any pipeline project, an economic analysis has to be performed to ensure the project is a viable investment. The major capital components of a pipeline system consists of the pipeline, Booster station, ancillary machinery such as mainline valve stations, meter stations, pressure regulation stations, SCADA & Telecommunications. The project costs would additionally consist of environmental costs & permits, Right of Way (ROW) acquisitions, Engineering & Construction management to name a few.
The following tutorial is aimed at conducting a pipeline economic analysis using the method of Weight Average Capital Cost (WACC) to estimate gas tariffs, project worth in terms of Net Present Value (NPV), Internal Rate of Return (IRR), Profit to Investment Ratio (PIR) and payback period. The cost of equity is estimated using the Capital Asset Pricing Model (CAPM).
Predicting Performance Curves of Centrifugal Pumps in the Absence of OEM DataVijay Sarathy
Chemical and Mechanical Engineers in the oil & gas industry often carry out the task of conducting technical studies to evaluate piping and pipeline systems during events such as pump trips and block valve failures that can lead to pipes cracking at the welded joints, pump impellers rotating in the reverse direction and damaged pipe supports due to excessive vibrations to name a few. Although much literature is available to mitigate such disturbances, a key set of data to conduct transient studies are pump performance curves, a plot between pump head and flow.
The present paper is aimed at applying engineering research in industrial applications for practicing engineers. It provides a methodology called from available literature from past researchers, allowing engineers to predict performance curves for a Volute Casing End Suction Single Stage Radial Pump. In the current undertaking, the pump in question is not specific to any one industry but the principles are the same for a Volute Casing End suction radial pump.
Load Sharing for Parallel Operation of Gas CompressorsVijay Sarathy
The art of load sharing between centrifugal compressors consists of maintaining equal throughput through multiple parallel compressors. These compressors consist of a common suction and discharge header. Programmable logic controllers (PLCs) can be incorporated with load sharing functions or can be incorporated as standalone controllers also. Control signals from shared process parameters such as suction header pressure or discharge header pressure can be then fed to individual controllers such as compressor speed controllers (SC) or anti-surge controllers (UIC) to ensure the overall load is distributed efficiently between the compressors.
The following article covers load sharing schemes for parallel centrifugal compressor operation.
Basic Unit Conversions for Turbomachinery Calculations Vijay Sarathy
Turbomachinery equipment like centrifugal pumps & compressors have their performance stated as a function of Actual volumetric flow rate [Q] & Head [m/bar]. The following tutorial describes how pump/compressor head can be expressed in energy terms as ‘kJ/kg’. Turbomachinery head expressed in kJ/kg describes, how many kJ of energy is required to compress 1 kg of gas for a given pressure ratio. The advantage of using energy terms to estimate absorbed power is that it is based on the amount of ‘mass’ compressed which is independent of pressure and temperature of a fluid.
Single Phase Liquid Vessel Sizing for HYSYS DynamicsVijay Sarathy
Process Facilities often have intermediate storage facilities that store liquids prior to transporting to downstream equipment. The period of storage is short, i.e., of the order of minutes to hours & is defined as Holdup time. The Holdup time can also be explained as the reserve volume required to ensure safe & controlled operation of downstream equipment.
The intermediate vessel also acts as a buffer vessel to accommodate any surge/spikes in flow rates, and is termed as surge time.
Vessel Volume is an input data required in Process Dynamic Simulation and the following exercise covers estimation of volume required for single phase liquid flow into an intermediate vertical/horizontal/flat bottomed process vessel
Key Process Considerations for Pipeline Design BasisVijay Sarathy
Prior to venturing into an oil & gas pipeline project, the project team would require a design basis, based on which the project is to proceed. Oil & Gas Pipeline design begins with a route survey including engineering & environmental assessments. The following document provides a few key considerations for process engineers to keep in mind, the factors that matter when preparing a pipeline design basis from a process standpoint.
OPERATING ENVELOPES FOR CENTRIFUGAL PUMPSVijay Sarathy
The following tutorial provides a step by step procedure to predict the allowable operating range or “Operating Envelope” for a centrifugal pump’s range of operation.
BOIL OFF GAS ANALYSIS OF LIQUEFIED NATURAL GAS (LNG) AT RECEIVING TERMINALSVijay Sarathy
Liquefied Natural Gas (LNG) is a cryogenic mixture of low molecular weight (MW) hydrocarbons with its chief component being methane. Its uses cover a gamut of applications from domestic & industrial use, power generation, to transportation fuel in its liquid form. LNG is transported in double-hulled ships specifically designed to handle low temperatures of the order of -1620C. As of 2012, there were 360 ships transporting more than 220 million metric tons of LNG every year. [1]
When LNG is received at most terminals, it is transferred to insulated storage tanks that are built to specifically hold LNG. These tanks can be above or below ground & keep the liquid at a low temperature to minimize evaporation & compositional changes due to heat ingress from the ambient. The temperature within the tank will remain constant if the pressure is kept constant by allowing the boil off gas (BOG) to escape from the tank. This is known as auto-refrigeration. BOG is collected & used as a fuel source in the facility or on the tanker transporting it. When natural gas is needed, LNG is warmed enough using heat exchangers to vaporize it called re-gasification process, prior to transferring it to the pipeline grid to various users.
Boil-off gas (BOG) management & assessment of LNG’s thermodynamic properties are key issues in the technical assessment of LNG storage. Increased vaporization process may negatively affect the stability and safety of the stored LNG. For these reasons the rate of vaporization (boil off rate) should be precisely determined in storage terminal energy systems. [2].
Affinity Laws for Variable Speed Centrifugal PumpsVijay Sarathy
In retrofit jobs, depending on the application & plant revamps, fixed speed pumps are retrofitted with a variable frequency drive (VFD) to enable them to be operated at a different set of operating conditions. In Brownfield projects, design engineers would sometimes face situations where the manufacturer's datasheets indicate performance curves only for rated speeds & it becomes necessary to evaluate what are the other operating ranges the same pump can be used for after retrofitting.
In the following short article, I've put up some points covering
1. Advantages of Variable Frequency Drives
2. When VFD’s Are Not Advantageous
3. Selection Process - New Pumps & Retrofit Pumps
4. Example Case Study to generate Performance Curves for VSD Retrofit (Single Stage End Suction Centrifugal Pump)
Pressure Safety Valve Sizing - API 520/521/526Vijay Sarathy
No chemical process facility is immune to the risk of overpressure to avoid dictating the necessity for overpressure protection. For every situation that demands safe containment of process gas, it becomes an obligation for engineers to equally provide pressure relieving and flaring provisions wherever necessary. The levels of protection are hierarchical, starting with designing an inherently safe process to avoid overpressure followed by providing alarms for operators to intervene and Emergency Shutdown provisions through ESD and SIL rated instrumentation. Beyond these design and instrument based protection measures, the philosophy of containment and abatement steps such as pressure relieving devices, flares, physical dikes and Emergency Response Services is employed
Student information management system project report ii.pdfKamal Acharya
Our project explains about the student management. This project mainly explains the various actions related to student details. This project shows some ease in adding, editing and deleting the student details. It also provides a less time consuming process for viewing, adding, editing and deleting the marks of the students.
Hierarchical Digital Twin of a Naval Power SystemKerry Sado
A hierarchical digital twin of a Naval DC power system has been developed and experimentally verified. Similar to other state-of-the-art digital twins, this technology creates a digital replica of the physical system executed in real-time or faster, which can modify hardware controls. However, its advantage stems from distributing computational efforts by utilizing a hierarchical structure composed of lower-level digital twin blocks and a higher-level system digital twin. Each digital twin block is associated with a physical subsystem of the hardware and communicates with a singular system digital twin, which creates a system-level response. By extracting information from each level of the hierarchy, power system controls of the hardware were reconfigured autonomously. This hierarchical digital twin development offers several advantages over other digital twins, particularly in the field of naval power systems. The hierarchical structure allows for greater computational efficiency and scalability while the ability to autonomously reconfigure hardware controls offers increased flexibility and responsiveness. The hierarchical decomposition and models utilized were well aligned with the physical twin, as indicated by the maximum deviations between the developed digital twin hierarchy and the hardware.
Sachpazis:Terzaghi Bearing Capacity Estimation in simple terms with Calculati...Dr.Costas Sachpazis
Terzaghi's soil bearing capacity theory, developed by Karl Terzaghi, is a fundamental principle in geotechnical engineering used to determine the bearing capacity of shallow foundations. This theory provides a method to calculate the ultimate bearing capacity of soil, which is the maximum load per unit area that the soil can support without undergoing shear failure. The Calculation HTML Code included.
Overview of the fundamental roles in Hydropower generation and the components involved in wider Electrical Engineering.
This paper presents the design and construction of hydroelectric dams from the hydrologist’s survey of the valley before construction, all aspects and involved disciplines, fluid dynamics, structural engineering, generation and mains frequency regulation to the very transmission of power through the network in the United Kingdom.
Author: Robbie Edward Sayers
Collaborators and co editors: Charlie Sims and Connor Healey.
(C) 2024 Robbie E. Sayers
CFD Simulation of By-pass Flow in a HRSG module by R&R Consult.pptxR&R Consult
CFD analysis is incredibly effective at solving mysteries and improving the performance of complex systems!
Here's a great example: At a large natural gas-fired power plant, where they use waste heat to generate steam and energy, they were puzzled that their boiler wasn't producing as much steam as expected.
R&R and Tetra Engineering Group Inc. were asked to solve the issue with reduced steam production.
An inspection had shown that a significant amount of hot flue gas was bypassing the boiler tubes, where the heat was supposed to be transferred.
R&R Consult conducted a CFD analysis, which revealed that 6.3% of the flue gas was bypassing the boiler tubes without transferring heat. The analysis also showed that the flue gas was instead being directed along the sides of the boiler and between the modules that were supposed to capture the heat. This was the cause of the reduced performance.
Based on our results, Tetra Engineering installed covering plates to reduce the bypass flow. This improved the boiler's performance and increased electricity production.
It is always satisfying when we can help solve complex challenges like this. Do your systems also need a check-up or optimization? Give us a call!
Work done in cooperation with James Malloy and David Moelling from Tetra Engineering.
More examples of our work https://www.r-r-consult.dk/en/cases-en/
Hybrid optimization of pumped hydro system and solar- Engr. Abdul-Azeez.pdffxintegritypublishin
Advancements in technology unveil a myriad of electrical and electronic breakthroughs geared towards efficiently harnessing limited resources to meet human energy demands. The optimization of hybrid solar PV panels and pumped hydro energy supply systems plays a pivotal role in utilizing natural resources effectively. This initiative not only benefits humanity but also fosters environmental sustainability. The study investigated the design optimization of these hybrid systems, focusing on understanding solar radiation patterns, identifying geographical influences on solar radiation, formulating a mathematical model for system optimization, and determining the optimal configuration of PV panels and pumped hydro storage. Through a comparative analysis approach and eight weeks of data collection, the study addressed key research questions related to solar radiation patterns and optimal system design. The findings highlighted regions with heightened solar radiation levels, showcasing substantial potential for power generation and emphasizing the system's efficiency. Optimizing system design significantly boosted power generation, promoted renewable energy utilization, and enhanced energy storage capacity. The study underscored the benefits of optimizing hybrid solar PV panels and pumped hydro energy supply systems for sustainable energy usage. Optimizing the design of solar PV panels and pumped hydro energy supply systems as examined across diverse climatic conditions in a developing country, not only enhances power generation but also improves the integration of renewable energy sources and boosts energy storage capacities, particularly beneficial for less economically prosperous regions. Additionally, the study provides valuable insights for advancing energy research in economically viable areas. Recommendations included conducting site-specific assessments, utilizing advanced modeling tools, implementing regular maintenance protocols, and enhancing communication among system components.
Welcome to WIPAC Monthly the magazine brought to you by the LinkedIn Group Water Industry Process Automation & Control.
In this month's edition, along with this month's industry news to celebrate the 13 years since the group was created we have articles including
A case study of the used of Advanced Process Control at the Wastewater Treatment works at Lleida in Spain
A look back on an article on smart wastewater networks in order to see how the industry has measured up in the interim around the adoption of Digital Transformation in the Water Industry.
Water Industry Process Automation and Control Monthly - May 2024.pdf
Chemical Process Calculations – Short Tutorial
1. Page 1 of 5
Chemical Process Calculations – Short Tutorial
Jayanthi Vijay Sarathy, M.E, CEng, MIChemE, Chartered Chemical Engineer, IChemE, UK
Often engineers are tasked with
communicating equipment specifications
with suppliers, where process data needs to
be exchanged for engineering quotations &
orders. Any dearth of data would need to be
computed for which process related queries
are sometimes sent back to the process
engineer’s desk for the requested data.
The following tutorial is a refresher for non-
process engineers such as project engineers,
Piping, Instrumentation, Static & Rotating
Equipment engineers to conduct basic
process calculations related to estimation of
mass %, volume %, mass flow, actual &
standard volumetric flow, gas density, parts
per million (ppm) by weight & by volume.
Problem Statement
A vendor requests the project engineer to
provide certain natural gas process data for
evaluation. The gas composition is as follows,
Table 1. Natural Gas Composition & Properties
Component MW Mol%
- kg/kmol %
Methane 16.04 76.23
Ethane 30.07 10.00
Propane 44.01 5.00
i-Butane 58.12 1.00
n-Butane 58.12 1.00
i-Pentane 72.15 0.30
n-Pentane 72.15 0.10
n-Hexane 86.18 0.05
H2O 18.02 0.25
CO2 44.01 3.00
H2S 34.08 0.07
N2 28.01 3.00
The process conditions are 40 bara, 500C &
1,000 kmol/h of natural gas. The process data
requested by the vendor is as follows,
1. Natural Gas Molecular Weight & Density
2. Component & Total Mass flow
3. Component & Total Actual Volume flow
4. Component & Total Standard Volume flow
5. Component mass %
6. Component Volume %
7. Component Parts per million (ppm) by
weight.
8. Component Parts per million (ppm) by
volume.
Component Molar Flow [M]
To estimate the component molar flow, the
mixture molecular weight [MW] is evaluated
first by using Kay’s mixing rule as follows,
𝑀𝑊 = ∑ 𝑦𝑖 𝑀𝑊𝑖, Where, i = 1 to n (1)
Where,
yi = Mole fraction of each component, -
MWi = Component MW, kg/kmol
The component molar flow rate is computed
as,
𝑀𝑖 = 𝑦𝑖 × 𝑀, Where, i = 1 to n (2)
Where,
Mi = Component Molar Flow, kmol/h
M = Total Molar Flow, kmol/h
Component & Total Mass Flow
To estimate the component mass flow [mi] &
total mass flow [m], the relationships are,
𝑚𝑖 = 𝑀𝑖 × 𝑀𝑊𝑖, Where, i = 1 to n (3)
𝑚 = ∑ 𝑚𝑖, Where, i = 1 to n (4)
Where,
mi = Component Mass Flow, kg/h
m = Total Mass Flow, kg/h
2. Page 2 of 5
Component & Total Volume Flow
To estimate the component volume flow &
total volume flow, the relationship is based on
the principle that 1 kmol of ideal gas occupies
22.414 m3 at 00C [273.15 K]. In order to
estimate the volume flow of each component,
the volume occupied by a gas at standard
pressure & temperature [STP], i.e., 1 atm &
150C, the relationship is corrected to,
𝑄𝑖 = 𝑀𝑖 ×
22.414
273.15
× [ 𝑇[℃] + 273.15] (5)
The total volume flow rate is,
𝑄𝑠𝑡𝑑 = ∑ 𝑄𝑖, Where, i = 1 to n (6)
Where,
Qi = Component Volume Flow [Sm3/h]
Q = Total Volume Flow [Sm3/h]
Component Mass %
The component mass % is calculated as,
𝑚𝑖% =
𝑚𝑖
𝑚
, Where, i = 1 to n (7)
Component Volume %
The component volume % is calculated as,
𝑄𝑖% =
𝑄 𝑖
𝑄 𝑠𝑡𝑑
, Where, i = 1 to n (8)
Actual Volumetric Flow Rate [Qact]
The actual volumetric flow is computed as,
𝑄 𝑎𝑐𝑡 =
𝑚
𝜌 𝑁𝐺
(9)
Where, the density of the natural gas [NG] is
computed from the expression that takes into
account the gas compressibility factor, Z as,
𝜌 𝑁𝐺 =
𝑃 𝑎𝑐𝑡×𝑀𝑊
𝑍 𝑎𝑐𝑡×𝑅×𝑇𝑎𝑐𝑡
𝑘𝑔/𝑚3
(10)
R = 0.0831447 m3.bar/kmol.K
The gas compressibility factor, Z of natural
gas can be computed based on the DAK
Equation of State [EOS] as described in
Appendix A. Alternatively the standard
volumetric flow rate can also be computed as,
𝑄𝑠𝑡𝑑 = ∑ 𝑄𝑖 = [
𝑃 𝑎𝑐𝑡×𝑄 𝑎𝑐𝑡
𝑍 𝑎𝑐𝑡×𝑇𝑎𝑐𝑡
] × [
𝑍 𝑠𝑡𝑑×𝑇 𝑠𝑡𝑑
𝑃 𝑠𝑡𝑑
] 𝑆𝑚3
/ℎ (11)
Where, Zstd is taken to be 1.0
Component PPM by Weight, ppm(w)
The component PPM by weight, ppm(w) is
computed as,
[𝑤𝑡 %]𝑖 × 10,000 = [𝑝𝑝𝑚(𝑤)]𝑖 (12)
Component PPM by Volume, ppm(v)
The component PPM by volume, ppm(v) is
computed as,
[𝑣𝑜𝑙 %]𝑖 × 10,000 = [𝑝𝑝𝑚(𝑣)]𝑖 (13)
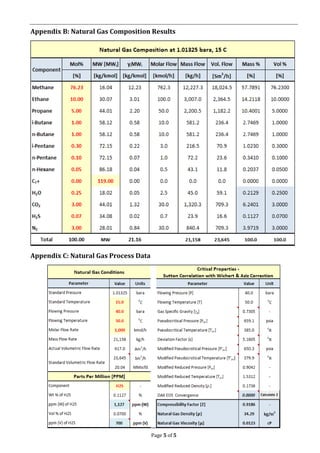
Results
Based on the steps provided, the estimated
results of mass %, volume %, mass flow,
actual & standard volumetric flow rates, parts
per million (ppm) by weight & by volume is
shown in Appendix B & Appendix C.
Appendix A: Gas Compressibility
Factor, Z for Natural Gas Estimation
To assess the properties of natural gas,
calculations can be begun by estimating the
properties using Kay’s Mixing Rule as follows,
Mixture molecular weight [MW], kg/kmol
𝑀𝑊 = ∑ 𝑦𝑖 𝑀𝑊𝑖 (14)
Mixture Pseudo Critical Pressure [Pc], psia
𝑃𝑐 = ∑ 𝑦𝑖 𝑃𝑐,𝑖 (15)
Mixture Pseudo Critical Temperature [Tc], 0R
𝑇𝑐 = ∑ 𝑦𝑖 𝑇𝑐,𝑖 (16)
Gas Specific Gravity [g], [-]
𝛾𝑔 =
𝑀𝑊𝑔
𝑀𝑊 𝑎𝑖𝑟
; MWair = 28.96 kg/kmol (17)
From the above, Kay’s Mixing Rule does not
give accurate pseudocritical properties for
higher molecular weight mixtures
(particularly C7+ mixtures) of hydrocarbon
gases when estimating gas compressibility
factors [Z] and deviations can be as high as
15%. Therefore, to account for these
differences, Sutton’s correlations based on
gas specific gravity can be utilized as follows,
𝑃𝑝𝑐 = 756.8 − 131.07𝛾𝑔 − 3.6𝛾𝑔
2
(18)
𝑇𝑝𝑐 = 169.2 − 349.5𝛾𝑔 − 74.0𝛾𝑔
2
(19)
3. Page 3 of 5
The above equations are valid for the gas
specific gravities range of 0.57 < g < 1.68.
Using the Sutton correlations, the reduced
properties are calculated as,
𝑃𝑟 =
𝑃
𝑃 𝑝𝑐
(20)
𝑇𝑟 =
𝑇
𝑇𝑝𝑐
(21)
However the pseudocritical properties are
not the actual mixture critical temperature
and pressure but represent the values that
must be used for the purpose of comparing
corresponding states of different gases on
the Z-chart, as shown below in the Standing &
Katz, 1959 chart for natural gases.
Figure 1. Natural Gas deviation factor chart
(Standing & Katz, 1959)
Due to the graphical method of Standing &
Katz chart, the Z factor can be estimated using
Dranchuk and Abou-Kassem Equation of State
[DAK-EoS] which is based on the data of
Standing & Katz, 1959 and is expressed as,
𝑍 = 1 + [𝐴1 +
𝐴2
𝑇𝑟
+
𝐴3
𝑇𝑟
3 +
𝐴4
𝑇𝑟
4 +
𝐴5
𝑇𝑟
5] 𝜌𝑟 +
[𝐴6 +
𝐴7
𝑇𝑟
+
𝐴8
𝑇𝑟
2] 𝜌𝑟
2
− 𝐴9 [
𝐴7
𝑇𝑟
+
𝐴8
𝑇𝑟
2] 𝜌𝑟
5
+
+𝐴10(1 + 𝐴11 𝜌𝑟
2) (
𝜌 𝑟
2
𝑇𝑟
3) 𝑒−𝐴11 𝜌 𝑟
2
(22)
Where,
𝜌𝑟 =
0.27𝑃𝑟
𝑍𝑇𝑟
(23)
r = Pseudo-Reduced Density [-]
Tr = Pseudo-Reduced Temperature [-]
The constants A1 to A11, are as follows,
Table 2. DAK EoS A1 to A11 Constants
A1 0.3265 A7 –0.7361
A2 –1.0700 A8 0.1844
A3 –0.5339 A9 0.1056
A4 0.01569 A10 0.6134
A5 –0.05165 A11 0.7210
A6 0.5475
DAK-EoS has an average absolute error of
0.486% in its equation, with a standard
deviation of 0.00747 over ranges of pseudo-
reduced pressure and temperature of 0.2 <
Ppr < 30; 1.0 < Tpr < 3.0 and for Ppr < 1.0 with
0.7 < Tpr < 1.0. However DAK-EoS gives
unacceptable results near the critical
temperature for Tpr = 1.0 and Ppr >1.0, and
DAK EoS is not recommended in this range.
DAK EoS for NG Mixtures with Acid Gases
Natural Gas is expected to contain acid gas
fractions, such as CO2 and H2S, & applying the
Standing & Katz Z-factor chart & Sutton’s
pseudocritical properties calculation methods
would yield inaccuracies, since they are only
valid for hydrocarbon mixtures. To account
for these inaccuracies, the Wichert & Aziz
correlations can be applied to mixtures
containing CO2 < 54.4 mol% & H2S < 73.8
mol% by estimating a deviation parameter
[], which is used to modify the pseudocritical
pressure & temperatures. The deviation
parameter [] whose units are in 0R, is,
𝜀 = 120[𝐴0.9
− 𝐴1.6] + 15[𝐵0.5
− 𝐵4] (24)
Where,
A = YCO2 + YH2S in Gas mix [Y = mole fraction]
B = YH2S in Gas mixture [Y = mole fraction]
4. Page 4 of 5
Applying [], the modified pseudocritical
pressure & temperature is,
𝑇𝑝𝑐
′
= 𝑇𝑝𝑐 − 𝜀 (25)
𝑃𝑝𝑐
′
=
𝑃 𝑝𝑐 𝑇𝑝𝑐
′
𝑇𝑝𝑐−𝐵[1−𝐵]𝜀
(26)
Where, T’pc & P’pc are valid only in 0R and psia.
Based on the calculated modified
pseudocritical pressure [P’pc] and
temperature [T’pc], the pseudo-reduced
pressure [Pr] & temperature [Tr] is,
𝑃𝑝𝑟 =
𝑃 [𝑝𝑠𝑖𝑎]
𝑃 𝑝𝑐
′ [𝑝𝑠𝑖𝑎]
(27)
𝑇𝑝𝑟 =
𝑇 [° 𝑅]
𝑇𝑝𝑐
′ [° 𝑅]
(28)
𝜌 𝑝𝑟 =
0.27𝑃 𝑝𝑟
𝑍𝑇𝑝𝑟
(29)
Using the calculated values of Ppr Tpr & pr,
compressibility factor, Z is determined by
using DAK EoS. Owing to the value of ‘Z’ being
an implicit parameter in calculating pr as
well as in DAK-EoS, an iterative approach,
whereby Z value is guessed & iteratively
solved to satisfy both modified pseudo-
reduced density [pr] & DAK EoS.
References
1. “Handbook of Natural Gas Engineering”,
Katz, D.L., 1959, McGraw-Hill Higher
Education, New York
2. “Gases and Vapors At High Temperature
and Pressure - Density of Hydrocarbon”, Kay
W, 1936 Ind. Eng. Chem. 28 (9): 1014-1019
(http://dx.doi.org/10.1021/ie50321a008)
3. “Density of Natural Gases”, Standing, M.B.
and Katz, D.L. 1942 In Transactions of the
American Institute of Mining and
Metallurgical Engineers, No. 142, SPE-
942140-G, 140–149, New York
4. “Compressibility Factors for High-
Molecular-Weight Reservoir Gases”, Sutton,
R.P. 1985. SPE Annual Technical
Conference & Exhibition, Las Vegas,
Nevada, USA, 22-26 Sep, SPE-14265-MS
(http://dx.doi.org/10.2118/14265-MS)
5. “Calculation of Z Factors For Natural Gases
Using Equations of State”, Dranchuk, P.M.
and Abou-Kassem, H. 1975, J Can Pet
Technol 14 (3): 34. PETSOC-75-03-
03 (http://dx.doi.org/10.2118/75-03-03)
6. https://petrowiki.org/Real_gases
7. “Compressibility Factors for Naturally
Occurring Petroleum Gases, Piper, L.D.,
McCain Jr., W.D., and Corredor, J.H., SPE
Annual Technical Conference & Exhibition,
Houston, 3–6 October 1993, SPE-26668-
MS (http://dx.doi.org/10.2118/26668-MS)
5. Page 5 of 5
Appendix B: Natural Gas Composition Results
Appendix C: Natural Gas Process Data