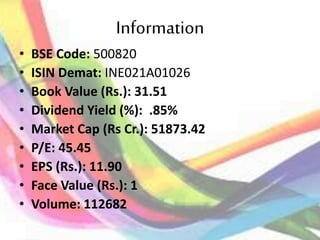
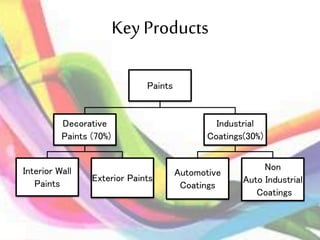
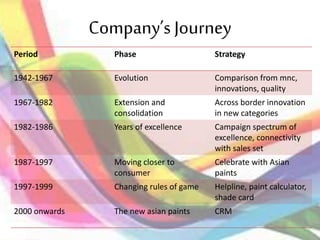
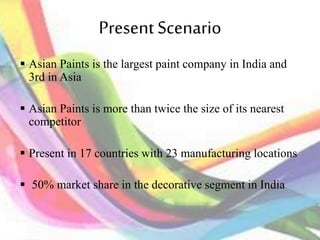
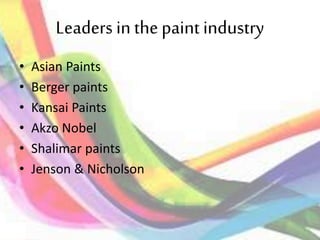
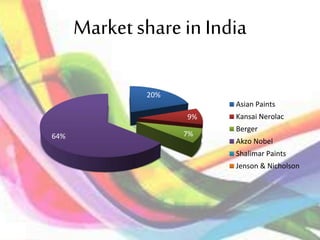
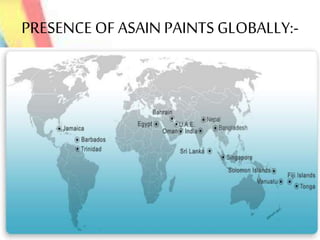
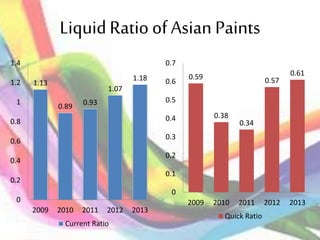
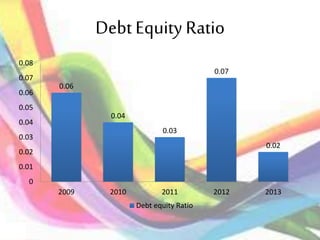
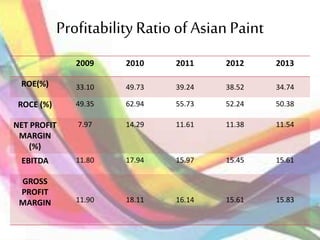
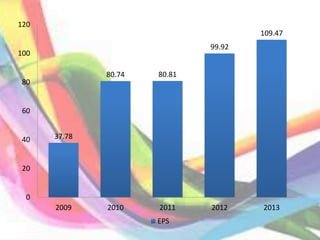
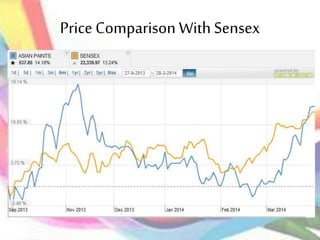
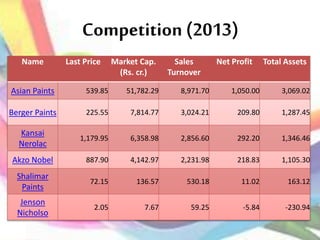
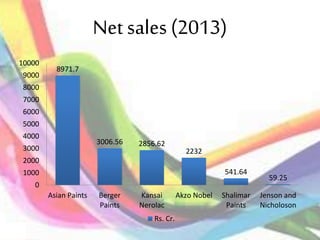
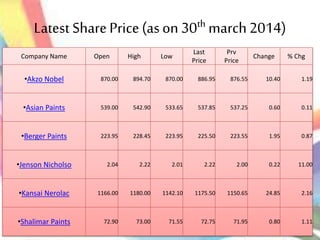
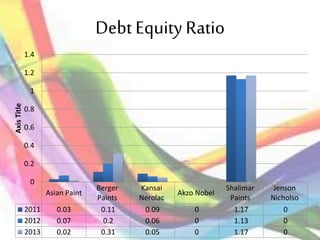
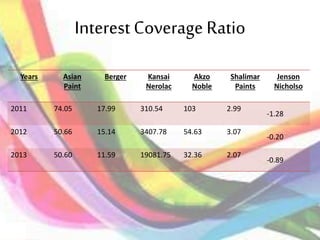
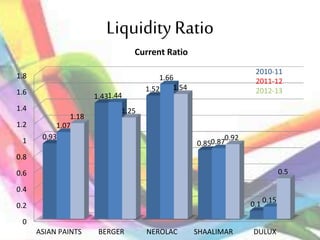
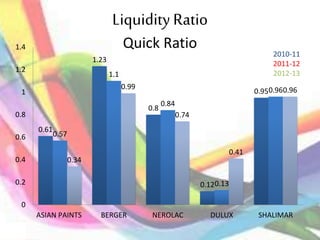
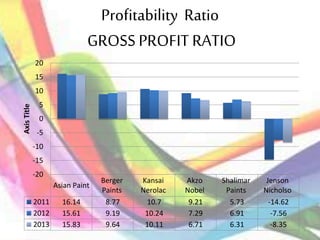
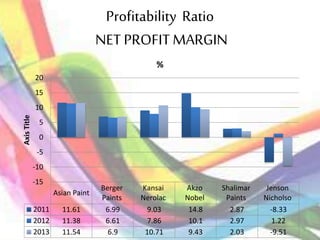
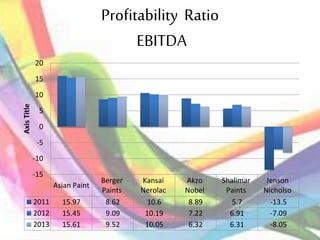
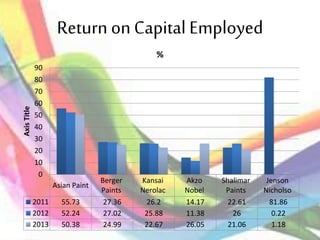
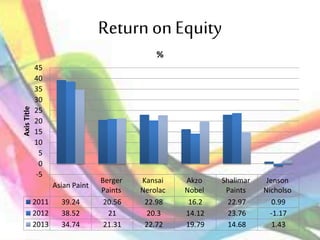
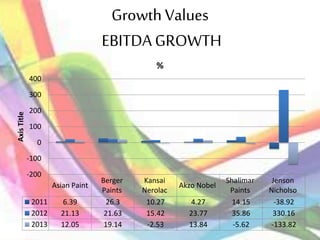
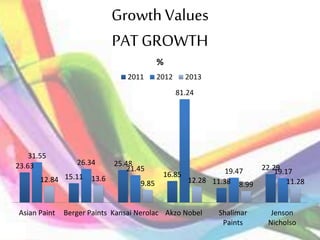
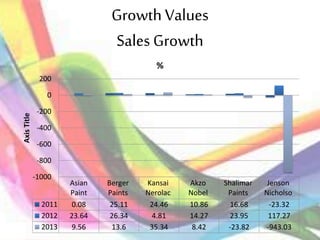
“Every Color Tells A Story”
•FINANCIAL STATEMENT
ANALYSIS OF Asian Paints
AND
COMPARISON WITH 5 PEERS.
CompanyProfile
Company Name: Asian Paints
Type: Public Ltd.
Industry: Paint
Founded: 1942
Head quarter: Mumbai, India.
Key People: Mr. K B S Anand CEO &
MD
Website: asianpaints.com
Information
• BSE Code: 500820
• ISIN Demat: INE021A01026
• Book Value (Rs.): 31.51
• Dividend Yield (%): .85%
• Market Cap (Rs Cr.): 51873.42
• P/E: 45.45
• EPS (Rs.): 11.90
• Face Value (Rs.): 1
• Volume: 112682
CompanyIntroduction
 Asian Paints is the producer of wide range of paints
 It was the first company to enter rural market in India
 Innovative approach. Example : Trial Pack to chose color
 Public issue of capital in 1982, listed on BSE, Scrip code-
500820
 CRISIL has assigned ‘AAA’ rating
Key Products
Paints
Decorative
Paints (70%)
Interior Wall
Paints
Exterior Paints
Industrial
Coatings(30%)
Automotive
Coatings
Non
Auto Industrial
Coatings
Company’s Journey
Period Phase Strategy
1942-1967 Evolution Comparison from mnc,
innovations, quality
1967-1982 Extension and
consolidation
Across border innovation
in new categories
1982-1986 Years of excellence Campaign spectrum of
excellence, connectivity
with sales set
1987-1997 Moving closer to
consumer
Celebrate with Asian
paints
1997-1999 Changing rules of game Helpline, paint calculator,
shade card
2000 onwards The new asian paints CRM
Present Scenario
 Asian Paints is the largest paint company in India and
3rd in Asia
 Asian Paints is more than twice the size of its nearest
competitor
 Present in 17 countries with 23 manufacturing locations
 50% market share in the decorative segment in India
Vision
 To build long term value in the Industrial
coatings business
 Identifying needs of customers
 Delivering customers value for money
 Contribution to society
ManagementTeam
Name Designation
Amar Vakil Director
Ashwin Choksi Chairman
Ashwin Dani Vice Chairman
Deepak Satwalekar Director
Dipankar Basu Director
Jayesh Merchant CFO, President & Co. Secretary
Jayesh Merchant Secretary
K B S Anand CEO
K B S Anand Managing Director & CEO
M K Sharma Additional Director
Mahendra Choksi Director
Mahendra Shah Director
Malav Dani Non Executive Director
R A Shah Director
S Ramadorai Director
Share holding pattern
Holder’s Name No. Of shares % share holding
Indian Promoters
506344590 52.79
Banks Fin. Inst. and
Insurance
69779014 7.27
FII's
182704390 19.05
Private Corporate
Bodies 55499495 5.79
NRI’s / foreign
others
14150339 1.48
General public
120845138 12.60
Mergers and Acquisition
2010
-Berger International Ltd Singapore (BIL), a subsidiary of Asian Paints Ltd ,
which is a wholly owned subsidiary of the Company
-The Company's new paint plant at Rohtak in the State of Haryana has
commenced commercial production
-Asian Paints Signed a MOU with Maharashtra Govt. to set up a Mega
Project for manufacture of Paints & Intermediate
2011
-Asian Paints to form second Joint Venture with PPG Industries.
-Asian Paints - Company's subsidiary, SCIB Chemicals SAE has temporarily
restarted the operations of its two plants in Egypt
2012
-Asian Paints - Production at the Company's Plant at Rohtak, Haryana has
been restarted
Awards
• Asian Paints was included in Forbes Magazine's - Asia's Fab 50 List of
companies in 2011, 2012 and 2013.
• Asian Paints was ranked 13th amongst the top paint companies in the
world by Coatings World - Top Companies Report 2013 (July 2013 Issue).
• In March 2012, Asian Paints was presented the Asian Centre for
Corporate Governance & Sustainability Award for the Best Governed
Company in 2011.
• Mr. P M Murty, the then MD & CEO, Asian Paints received the 'CEO of the
Year' award from Business Standard, one of India's leading business dailies
(March 2011).
• Asian Paints receives the Best Audit Committee Award from the Asian
Centre for Corporate Governance & Sustainability (Feb 2011)
• Awarded the "Sword of Honour" by the British Safety Council for all the
paint plants in India. This award is considered as the pinnacle of
achievement in safety across the world.
Leaders in thepaint industry
• Asian Paints
• Berger paints
• Kansai Paints
• Akzo Nobel
• Shalimar paints
• Jenson & Nicholson
Competitors
Berger Paints India Limited
Type Public company
(BSE: 509480,NSE: BERGEPAINT)
Industry Paint
Founded17 December 1923
Head quarters Kolkata,
India Key people Abhijit roy (MD)
Revenue30 billion (US$490 million)
Profit 1.77 billion (US$29 million)
Employees 2,464 (2013)
Websitebergerpaints.com
Kansai Nerolac Paints
Type Public company
Traded as BSE: 500165
NSE: KANSAINER
Industry Paint
Founded 1920
Headquarters Mumbai,
India Key people H.M.Bharuka (MD)
Revenue23774.3 million (US$390 million)
Profit 2059.8 million (US$34 million)
Total assets 9986.4 million
Employees2000 approx.
Parent Kansai Paints Ltd. Japan
Website Official Website
Akzo Nobel N.V.
Type Naamloze vennootschap
Traded as Euronext: AKZA
OTCQX: AKZOY
Industry Chemicals
Founded 1994
Headquarters Amsterdam, Netherlands
Area served Worldwide
Key people Ton Büchner (CEO)
Karel Vuursteen (Chairman of thesupervisory board)
Products Basic and industrial chemicals, decorative paints,
industrial(re)finishing products, coatings
Revenue€14.59 billion (2013)
Profit€724 million (2013)
Employees49,560 (end 2013)
Websitewww.akzonobel.com
Shalimar Paints
Type Public
BSE: 509874
Industry Paint
Founded 1902
Founder(s) AN Turner, AC Wright
Headquarters Mumbai, India
India Key people Mr. Ratan Jindal
Mr. Girish Jhunjhnuwala
Mr. Sameer Nagpal
Products Paint
Revenue 3673 million (US$60 million)
WebsiteOfficial Website
• Jenson & Nicholson:
• Incorporated in 1922, Jenson & Nicholson (I) Ltd., or J&N
as it is popularly known, is India’s second oldest paint
company. Roots trace back to a business established in
1821 in London, which eventually became a partnership
between John Jenson and Wilfred Nicholson.
• In 1973, Jenson & Nicholson (I) Ltd. emerged as an
independent company and is a major player in the
Indian market.
• The company continually strives to foresee market
requirements and using global technology delivers
unsurpassed quality in every can.
• Its emphasis on quality and innovation has earned the
trust of consumers, dealers, painters and architects.
• Company continually benchmark our offerings with the
best in the market and ensure that we exceed
expectations.
Market share in India
20%
9%
7%64%
Asian Paints
Kansai Nerolac
Berger
Akzo Nobel
Shalimar Paints
Jenson & Nicholson
PRESENCE OF ASAIN PAINTS GLOBALLY:-
Region–wise contribution
14%
51%
27%
8%
Sales
Caribbean
Middle East
Asia
South Pacific
Sales Break up – Product Wise
Product Name Quantity Sales Value (in Crores)
Paints, Enamels , Varnishes 433318 tonnes 3906.22
Phthalic Anhydride 12783 tonnes 86.59
Others 32.19
Penta Erthritol 2642 tonnes 27.3
Processing Charges 12.38
Other Services 9.79
Sodium Formate 3166 tonnes 6.42
Formaldehyde 368 tonnes 1.21
Lease Rentals 0.59
Total 4082.69
LIQUIDITY RATIOS
 Current Ratio
• A current ratio of 2 would mean that current assets are sufficient to cover for
twice the amount of a company's short term liabilities.
 Quick ratio
Quick Ratio, also known as Acid Test Ratio, shows the ratio of cash and other
liquid resources of an organization in comparison to its current liabilities. –
• Quick ratio of 0.5 would suggest that a company is able to settle half of its
current liabilities instantaneously.
• Quick Ratio= CA – stock
CL
LiquidRatio of Asian Paints
1.13
0.89 0.93
1.07
1.18
0
0.2
0.4
0.6
0.8
1
1.2
1.4
2009 2010 2011 2012 2013
Current Ratio
0.59
0.38
0.34
0.57
0.61
0
0.1
0.2
0.3
0.4
0.5
0.6
0.7
2009 2010 2011 2012 2013
Quick Ratio
Profitability ratios
• EBITDA
This ratio helps in determining the percentage
of revenue left over after the
company pays its operating expenses.
• ROCE-It measures the profitability of a
company by expressing its operating profit as
a percentage of its capital employed
ROCE =
Net Operating Profit
Capital Employed
EPS
• The portion of a company's profit allocated to each outstanding
share of common stock.
• Earnings per share serves as an indicator of a company's
profitability.
PE RATIO
A valuation ratio of a company's current share price compared
to its per-share earnings.
Current Share Price
Earnings per Share
Debt Equity Ratio
0.06
0.04
0.03
0.07
0.02
0
0.01
0.02
0.03
0.04
0.05
0.06
0.07
0.08
2009 2010 2011 2012 2013
Debt equity Ratio
Profitability Ratio of Asian Paint
2009 2010 2011 2012 2013
ROE(%) 33.10 49.73 39.24 38.52 34.74
ROCE (%) 49.35 62.94 55.73 52.24 50.38
NET PROFIT
MARGIN
(%)
7.97 14.29 11.61 11.38 11.54
EBITDA 11.80 17.94 15.97 15.45 15.61
GROSS
PROFIT
MARGIN 11.90 18.11 16.14 15.61 15.83
37.78
80.74 80.81
99.92
109.47
0
20
40
60
80
100
120
2009 2010 2011 2012 2013
EPS
P & L of Asian Paints
Balance Sheet Of Asian Paints
Price Comparison With Sensex
FUNDAMENTAL ANALYSIS
OF ASIAN PAINTS AND
PEER GROUPS
Competition (2013)
Name Last Price Market Cap.
(Rs. cr.)
Sales
Turnover
Net Profit Total Assets
Asian Paints 539.85 51,782.29 8,971.70 1,050.00 3,069.02
Berger Paints 225.55 7,814.77 3,024.21 209.80 1,287.45
Kansai
Nerolac
1,179.95 6,358.98 2,856.60 292.20 1,346.46
Akzo Nobel 887.90 4,142.97 2,231.98 218.83 1,105.30
Shalimar
Paints
72.15 136.57 530.18 11.02 163.12
Jenson
Nicholso
2.05 7.67 59.25 -5.84 -230.94
Net sales (2013)
8971.7
3006.56 2856.62
2232
541.64
59.25
0
1000
2000
3000
4000
5000
6000
7000
8000
9000
10000
Asian Paints Berger
Paints
Kansai
Nerolac
Akzo Nobel Shalimar
Paints
Jenson and
Nicholoson
Rs. Cr.
Latest SharePrice(ason 30th march2014)
Company Name Open High Low
Last
Price
Prv
Price
Change % Chg
•Akzo Nobel 870.00 894.70 870.00 886.95 876.55 10.40 1.19
•Asian Paints 539.00 542.90 533.65 537.85 537.25 0.60 0.11
•Berger Paints 223.95 228.45 223.95 225.50 223.55 1.95 0.87
•Jenson Nicholso 2.04 2.22 2.01 2.22 2.00 0.22 11.00
•Kansai Nerolac 1166.00 1180.00 1142.10 1175.50 1150.65 24.85 2.16
•Shalimar Paints 72.90 73.00 71.55 72.75 71.95 0.80 1.11
Debt Equity Ratio
Asian Paint
Berger
Paints
Kansai
Nerolac
Akzo Nobel
Shalimar
Paints
Jenson
Nicholso
2011 0.03 0.11 0.09 0 1.17 0
2012 0.07 0.2 0.06 0 1.13 0
2013 0.02 0.31 0.05 0 1.17 0
0
0.2
0.4
0.6
0.8
1
1.2
1.4
AxisTitle
Interest Coverage Ratio
Years Asian
Paint
Berger Kansai
Nerolac
Akzo
Noble
Shalimar
Paints
Jenson
Nicholso
2011 74.05 17.99 310.54 103 2.99
-1.28
2012 50.66 15.14 3407.78 54.63 3.07
-0.20
2013 50.60 11.59 19081.75 32.36 2.07
-0.89
Liquidity Ratio
0
0.2
0.4
0.6
0.8
1
1.2
1.4
1.6
1.8
ASIAN PAINTS BERGER NEROLAC SHAALIMAR DULUX
0.93
1.43
1.52
0.85
0.1
1.07
1.44
1.66
0.87
0.15
1.18
1.25
1.54
0.92
0.5
Current Ratio
2010-11
2011-12
2012-13
Liquidity Ratio
Quick Ratio
0.61
1.23
0.8
0.12
0.95
0.57
1.1
0.84
0.13
0.96
0.34
0.99
0.74
0.41
0.96
0
0.2
0.4
0.6
0.8
1
1.2
1.4
ASIAN PAINTS BERGER NEROLAC DULUX SHALIMAR
2010-11
2011-12
2012-13
Profitability Ratio
GROSS PROFIT RATIO
Asian Paint
Berger
Paints
Kansai
Nerolac
Akzo
Nobel
Shalimar
Paints
Jenson
Nicholso
2011 16.14 8.77 10.7 9.21 5.73 -14.62
2012 15.61 9.19 10.24 7.29 6.91 -7.56
2013 15.83 9.64 10.11 6.71 6.31 -8.35
-20
-15
-10
-5
0
5
10
15
20
AxisTitle
Profitability Ratio
NET PROFITMARGIN
Asian Paint
Berger
Paints
Kansai
Nerolac
Akzo
Nobel
Shalimar
Paints
Jenson
Nicholso
2011 11.61 6.99 9.03 14.8 2.87 -8.33
2012 11.38 6.61 7.86 10.1 2.97 1.22
2013 11.54 6.9 10.71 9.43 2.03 -9.51
-15
-10
-5
0
5
10
15
20
AxisTitle
%
Profitability Ratio
EBITDA
Asian Paint
Berger
Paints
Kansai
Nerolac
Akzo
Nobel
Shalimar
Paints
Jenson
Nicholso
2011 15.97 8.62 10.6 8.89 5.7 -13.5
2012 15.45 9.09 10.19 7.22 6.91 -7.09
2013 15.61 9.52 10.05 6.32 6.31 -8.05
-15
-10
-5
0
5
10
15
20
AxisTitle
Return onCapital Employed
Asian Paint
Berger
Paints
Kansai
Nerolac
Akzo
Nobel
Shalimar
Paints
Jenson
Nicholso
2011 55.73 27.36 26.2 14.17 22.61 81.86
2012 52.24 27.02 25.88 11.38 26 0.22
2013 50.38 24.99 22.67 26.05 21.06 1.18
0
10
20
30
40
50
60
70
80
90
AxisTitle
%
Return onEquity
Asian Paint
Berger
Paints
Kansai
Nerolac
Akzo
Nobel
Shalimar
Paints
Jenson
Nicholso
2011 39.24 20.56 22.98 16.2 22.97 0.99
2012 38.52 21 20.3 14.12 23.76 -1.17
2013 34.74 21.31 22.72 19.79 14.68 1.43
-5
0
5
10
15
20
25
30
35
40
45
AxisTitle
%
Growth Values
EBITDA GROWTH
Asian Paint
Berger
Paints
Kansai
Nerolac
Akzo Nobel
Shalimar
Paints
Jenson
Nicholso
2011 6.39 26.3 10.27 4.27 14.15 -38.92
2012 21.13 21.63 15.42 23.77 35.86 330.16
2013 12.05 19.14 -2.53 13.84 -5.62 -133.82
-200
-100
0
100
200
300
400
AxisTitle
%
Growth Values
PAT GROWTH
23.63
15.11
25.48
16.85
11.38
22.29
31.55
26.34
21.45
81.24
19.47 19.17
12.84 13.6
9.85 12.28
8.99 11.28
Asian Paint Berger Paints Kansai Nerolac Akzo Nobel Shalimar
Paints
Jenson
Nicholso
%
2011 2012 2013
Growth Values
Sales Growth
Asian
Paint
Berger
Paints
Kansai
Nerolac
Akzo
Nobel
Shalimar
Paints
Jenson
Nicholso
2011 0.08 25.11 24.46 10.86 16.68 -23.32
2012 23.64 26.34 4.81 14.27 23.95 117.27
2013 9.56 13.6 35.34 8.42 -23.82 -943.03
-1000
-800
-600
-400
-200
0
200
AxisTitle
%
Conclusion
As per the data analyse Asian paints is the
biggest player in the paint sector.
Berger paints is the second largest player and
growing very fast in paint sector.
DULUX paints is in loss in India and focuses only
on international market therefore is in loss in
India.
Shalimar paints focuses only on India market.
Nerolac paints growth is slow

asian paints financial management

  • 1.
  • 2.
    •FINANCIAL STATEMENT ANALYSIS OFAsian Paints AND COMPARISON WITH 5 PEERS.
  • 3.
    CompanyProfile Company Name: AsianPaints Type: Public Ltd. Industry: Paint Founded: 1942 Head quarter: Mumbai, India. Key People: Mr. K B S Anand CEO & MD Website: asianpaints.com
  • 4.
    Information • BSE Code:500820 • ISIN Demat: INE021A01026 • Book Value (Rs.): 31.51 • Dividend Yield (%): .85% • Market Cap (Rs Cr.): 51873.42 • P/E: 45.45 • EPS (Rs.): 11.90 • Face Value (Rs.): 1 • Volume: 112682
  • 5.
    CompanyIntroduction  Asian Paintsis the producer of wide range of paints  It was the first company to enter rural market in India  Innovative approach. Example : Trial Pack to chose color  Public issue of capital in 1982, listed on BSE, Scrip code- 500820  CRISIL has assigned ‘AAA’ rating
  • 6.
    Key Products Paints Decorative Paints (70%) InteriorWall Paints Exterior Paints Industrial Coatings(30%) Automotive Coatings Non Auto Industrial Coatings
  • 7.
    Company’s Journey Period PhaseStrategy 1942-1967 Evolution Comparison from mnc, innovations, quality 1967-1982 Extension and consolidation Across border innovation in new categories 1982-1986 Years of excellence Campaign spectrum of excellence, connectivity with sales set 1987-1997 Moving closer to consumer Celebrate with Asian paints 1997-1999 Changing rules of game Helpline, paint calculator, shade card 2000 onwards The new asian paints CRM
  • 8.
    Present Scenario  AsianPaints is the largest paint company in India and 3rd in Asia  Asian Paints is more than twice the size of its nearest competitor  Present in 17 countries with 23 manufacturing locations  50% market share in the decorative segment in India
  • 9.
    Vision  To buildlong term value in the Industrial coatings business  Identifying needs of customers  Delivering customers value for money  Contribution to society
  • 10.
    ManagementTeam Name Designation Amar VakilDirector Ashwin Choksi Chairman Ashwin Dani Vice Chairman Deepak Satwalekar Director Dipankar Basu Director Jayesh Merchant CFO, President & Co. Secretary Jayesh Merchant Secretary K B S Anand CEO K B S Anand Managing Director & CEO M K Sharma Additional Director Mahendra Choksi Director Mahendra Shah Director Malav Dani Non Executive Director R A Shah Director S Ramadorai Director
  • 11.
    Share holding pattern Holder’sName No. Of shares % share holding Indian Promoters 506344590 52.79 Banks Fin. Inst. and Insurance 69779014 7.27 FII's 182704390 19.05 Private Corporate Bodies 55499495 5.79 NRI’s / foreign others 14150339 1.48 General public 120845138 12.60
  • 12.
    Mergers and Acquisition 2010 -BergerInternational Ltd Singapore (BIL), a subsidiary of Asian Paints Ltd , which is a wholly owned subsidiary of the Company -The Company's new paint plant at Rohtak in the State of Haryana has commenced commercial production -Asian Paints Signed a MOU with Maharashtra Govt. to set up a Mega Project for manufacture of Paints & Intermediate 2011 -Asian Paints to form second Joint Venture with PPG Industries. -Asian Paints - Company's subsidiary, SCIB Chemicals SAE has temporarily restarted the operations of its two plants in Egypt 2012 -Asian Paints - Production at the Company's Plant at Rohtak, Haryana has been restarted
  • 13.
    Awards • Asian Paintswas included in Forbes Magazine's - Asia's Fab 50 List of companies in 2011, 2012 and 2013. • Asian Paints was ranked 13th amongst the top paint companies in the world by Coatings World - Top Companies Report 2013 (July 2013 Issue). • In March 2012, Asian Paints was presented the Asian Centre for Corporate Governance & Sustainability Award for the Best Governed Company in 2011. • Mr. P M Murty, the then MD & CEO, Asian Paints received the 'CEO of the Year' award from Business Standard, one of India's leading business dailies (March 2011). • Asian Paints receives the Best Audit Committee Award from the Asian Centre for Corporate Governance & Sustainability (Feb 2011) • Awarded the "Sword of Honour" by the British Safety Council for all the paint plants in India. This award is considered as the pinnacle of achievement in safety across the world.
  • 14.
    Leaders in thepaintindustry • Asian Paints • Berger paints • Kansai Paints • Akzo Nobel • Shalimar paints • Jenson & Nicholson
  • 15.
    Competitors Berger Paints IndiaLimited Type Public company (BSE: 509480,NSE: BERGEPAINT) Industry Paint Founded17 December 1923 Head quarters Kolkata, India Key people Abhijit roy (MD) Revenue30 billion (US$490 million) Profit 1.77 billion (US$29 million) Employees 2,464 (2013) Websitebergerpaints.com
  • 16.
    Kansai Nerolac Paints TypePublic company Traded as BSE: 500165 NSE: KANSAINER Industry Paint Founded 1920 Headquarters Mumbai, India Key people H.M.Bharuka (MD) Revenue23774.3 million (US$390 million) Profit 2059.8 million (US$34 million) Total assets 9986.4 million Employees2000 approx. Parent Kansai Paints Ltd. Japan Website Official Website
  • 17.
    Akzo Nobel N.V. TypeNaamloze vennootschap Traded as Euronext: AKZA OTCQX: AKZOY Industry Chemicals Founded 1994 Headquarters Amsterdam, Netherlands Area served Worldwide Key people Ton Büchner (CEO) Karel Vuursteen (Chairman of thesupervisory board) Products Basic and industrial chemicals, decorative paints, industrial(re)finishing products, coatings Revenue€14.59 billion (2013) Profit€724 million (2013) Employees49,560 (end 2013) Websitewww.akzonobel.com
  • 18.
    Shalimar Paints Type Public BSE:509874 Industry Paint Founded 1902 Founder(s) AN Turner, AC Wright Headquarters Mumbai, India India Key people Mr. Ratan Jindal Mr. Girish Jhunjhnuwala Mr. Sameer Nagpal Products Paint Revenue 3673 million (US$60 million) WebsiteOfficial Website
  • 19.
    • Jenson &Nicholson: • Incorporated in 1922, Jenson & Nicholson (I) Ltd., or J&N as it is popularly known, is India’s second oldest paint company. Roots trace back to a business established in 1821 in London, which eventually became a partnership between John Jenson and Wilfred Nicholson. • In 1973, Jenson & Nicholson (I) Ltd. emerged as an independent company and is a major player in the Indian market. • The company continually strives to foresee market requirements and using global technology delivers unsurpassed quality in every can. • Its emphasis on quality and innovation has earned the trust of consumers, dealers, painters and architects. • Company continually benchmark our offerings with the best in the market and ensure that we exceed expectations.
  • 20.
    Market share inIndia 20% 9% 7%64% Asian Paints Kansai Nerolac Berger Akzo Nobel Shalimar Paints Jenson & Nicholson
  • 21.
    PRESENCE OF ASAINPAINTS GLOBALLY:-
  • 22.
  • 23.
    Sales Break up– Product Wise Product Name Quantity Sales Value (in Crores) Paints, Enamels , Varnishes 433318 tonnes 3906.22 Phthalic Anhydride 12783 tonnes 86.59 Others 32.19 Penta Erthritol 2642 tonnes 27.3 Processing Charges 12.38 Other Services 9.79 Sodium Formate 3166 tonnes 6.42 Formaldehyde 368 tonnes 1.21 Lease Rentals 0.59 Total 4082.69
  • 24.
    LIQUIDITY RATIOS  CurrentRatio • A current ratio of 2 would mean that current assets are sufficient to cover for twice the amount of a company's short term liabilities.  Quick ratio Quick Ratio, also known as Acid Test Ratio, shows the ratio of cash and other liquid resources of an organization in comparison to its current liabilities. – • Quick ratio of 0.5 would suggest that a company is able to settle half of its current liabilities instantaneously. • Quick Ratio= CA – stock CL
  • 25.
    LiquidRatio of AsianPaints 1.13 0.89 0.93 1.07 1.18 0 0.2 0.4 0.6 0.8 1 1.2 1.4 2009 2010 2011 2012 2013 Current Ratio 0.59 0.38 0.34 0.57 0.61 0 0.1 0.2 0.3 0.4 0.5 0.6 0.7 2009 2010 2011 2012 2013 Quick Ratio
  • 26.
    Profitability ratios • EBITDA Thisratio helps in determining the percentage of revenue left over after the company pays its operating expenses. • ROCE-It measures the profitability of a company by expressing its operating profit as a percentage of its capital employed ROCE = Net Operating Profit Capital Employed
  • 27.
    EPS • The portionof a company's profit allocated to each outstanding share of common stock. • Earnings per share serves as an indicator of a company's profitability. PE RATIO A valuation ratio of a company's current share price compared to its per-share earnings. Current Share Price Earnings per Share
  • 28.
  • 29.
    Profitability Ratio ofAsian Paint 2009 2010 2011 2012 2013 ROE(%) 33.10 49.73 39.24 38.52 34.74 ROCE (%) 49.35 62.94 55.73 52.24 50.38 NET PROFIT MARGIN (%) 7.97 14.29 11.61 11.38 11.54 EBITDA 11.80 17.94 15.97 15.45 15.61 GROSS PROFIT MARGIN 11.90 18.11 16.14 15.61 15.83
  • 30.
  • 31.
    P & Lof Asian Paints
  • 32.
    Balance Sheet OfAsian Paints
  • 33.
  • 34.
    FUNDAMENTAL ANALYSIS OF ASIANPAINTS AND PEER GROUPS
  • 35.
    Competition (2013) Name LastPrice Market Cap. (Rs. cr.) Sales Turnover Net Profit Total Assets Asian Paints 539.85 51,782.29 8,971.70 1,050.00 3,069.02 Berger Paints 225.55 7,814.77 3,024.21 209.80 1,287.45 Kansai Nerolac 1,179.95 6,358.98 2,856.60 292.20 1,346.46 Akzo Nobel 887.90 4,142.97 2,231.98 218.83 1,105.30 Shalimar Paints 72.15 136.57 530.18 11.02 163.12 Jenson Nicholso 2.05 7.67 59.25 -5.84 -230.94
  • 36.
    Net sales (2013) 8971.7 3006.562856.62 2232 541.64 59.25 0 1000 2000 3000 4000 5000 6000 7000 8000 9000 10000 Asian Paints Berger Paints Kansai Nerolac Akzo Nobel Shalimar Paints Jenson and Nicholoson Rs. Cr.
  • 37.
    Latest SharePrice(ason 30thmarch2014) Company Name Open High Low Last Price Prv Price Change % Chg •Akzo Nobel 870.00 894.70 870.00 886.95 876.55 10.40 1.19 •Asian Paints 539.00 542.90 533.65 537.85 537.25 0.60 0.11 •Berger Paints 223.95 228.45 223.95 225.50 223.55 1.95 0.87 •Jenson Nicholso 2.04 2.22 2.01 2.22 2.00 0.22 11.00 •Kansai Nerolac 1166.00 1180.00 1142.10 1175.50 1150.65 24.85 2.16 •Shalimar Paints 72.90 73.00 71.55 72.75 71.95 0.80 1.11
  • 38.
    Debt Equity Ratio AsianPaint Berger Paints Kansai Nerolac Akzo Nobel Shalimar Paints Jenson Nicholso 2011 0.03 0.11 0.09 0 1.17 0 2012 0.07 0.2 0.06 0 1.13 0 2013 0.02 0.31 0.05 0 1.17 0 0 0.2 0.4 0.6 0.8 1 1.2 1.4 AxisTitle
  • 39.
    Interest Coverage Ratio YearsAsian Paint Berger Kansai Nerolac Akzo Noble Shalimar Paints Jenson Nicholso 2011 74.05 17.99 310.54 103 2.99 -1.28 2012 50.66 15.14 3407.78 54.63 3.07 -0.20 2013 50.60 11.59 19081.75 32.36 2.07 -0.89
  • 40.
    Liquidity Ratio 0 0.2 0.4 0.6 0.8 1 1.2 1.4 1.6 1.8 ASIAN PAINTSBERGER NEROLAC SHAALIMAR DULUX 0.93 1.43 1.52 0.85 0.1 1.07 1.44 1.66 0.87 0.15 1.18 1.25 1.54 0.92 0.5 Current Ratio 2010-11 2011-12 2012-13
  • 41.
  • 42.
    Profitability Ratio GROSS PROFITRATIO Asian Paint Berger Paints Kansai Nerolac Akzo Nobel Shalimar Paints Jenson Nicholso 2011 16.14 8.77 10.7 9.21 5.73 -14.62 2012 15.61 9.19 10.24 7.29 6.91 -7.56 2013 15.83 9.64 10.11 6.71 6.31 -8.35 -20 -15 -10 -5 0 5 10 15 20 AxisTitle
  • 43.
    Profitability Ratio NET PROFITMARGIN AsianPaint Berger Paints Kansai Nerolac Akzo Nobel Shalimar Paints Jenson Nicholso 2011 11.61 6.99 9.03 14.8 2.87 -8.33 2012 11.38 6.61 7.86 10.1 2.97 1.22 2013 11.54 6.9 10.71 9.43 2.03 -9.51 -15 -10 -5 0 5 10 15 20 AxisTitle %
  • 44.
    Profitability Ratio EBITDA Asian Paint Berger Paints Kansai Nerolac Akzo Nobel Shalimar Paints Jenson Nicholso 201115.97 8.62 10.6 8.89 5.7 -13.5 2012 15.45 9.09 10.19 7.22 6.91 -7.09 2013 15.61 9.52 10.05 6.32 6.31 -8.05 -15 -10 -5 0 5 10 15 20 AxisTitle
  • 45.
    Return onCapital Employed AsianPaint Berger Paints Kansai Nerolac Akzo Nobel Shalimar Paints Jenson Nicholso 2011 55.73 27.36 26.2 14.17 22.61 81.86 2012 52.24 27.02 25.88 11.38 26 0.22 2013 50.38 24.99 22.67 26.05 21.06 1.18 0 10 20 30 40 50 60 70 80 90 AxisTitle %
  • 46.
    Return onEquity Asian Paint Berger Paints Kansai Nerolac Akzo Nobel Shalimar Paints Jenson Nicholso 201139.24 20.56 22.98 16.2 22.97 0.99 2012 38.52 21 20.3 14.12 23.76 -1.17 2013 34.74 21.31 22.72 19.79 14.68 1.43 -5 0 5 10 15 20 25 30 35 40 45 AxisTitle %
  • 47.
    Growth Values EBITDA GROWTH AsianPaint Berger Paints Kansai Nerolac Akzo Nobel Shalimar Paints Jenson Nicholso 2011 6.39 26.3 10.27 4.27 14.15 -38.92 2012 21.13 21.63 15.42 23.77 35.86 330.16 2013 12.05 19.14 -2.53 13.84 -5.62 -133.82 -200 -100 0 100 200 300 400 AxisTitle %
  • 48.
    Growth Values PAT GROWTH 23.63 15.11 25.48 16.85 11.38 22.29 31.55 26.34 21.45 81.24 19.4719.17 12.84 13.6 9.85 12.28 8.99 11.28 Asian Paint Berger Paints Kansai Nerolac Akzo Nobel Shalimar Paints Jenson Nicholso % 2011 2012 2013
  • 49.
    Growth Values Sales Growth Asian Paint Berger Paints Kansai Nerolac Akzo Nobel Shalimar Paints Jenson Nicholso 20110.08 25.11 24.46 10.86 16.68 -23.32 2012 23.64 26.34 4.81 14.27 23.95 117.27 2013 9.56 13.6 35.34 8.42 -23.82 -943.03 -1000 -800 -600 -400 -200 0 200 AxisTitle %
  • 50.
    Conclusion As per thedata analyse Asian paints is the biggest player in the paint sector. Berger paints is the second largest player and growing very fast in paint sector. DULUX paints is in loss in India and focuses only on international market therefore is in loss in India. Shalimar paints focuses only on India market. Nerolac paints growth is slow