Downloaded 89 times


![Licensed
for
single
user.
©
2018
ASHRAE,
Inc.
2.1
CHAPTER 2
AMMONIA REFRIGERATION SYSTEMS
EQUIPMENT............................................................................. 2.1
Compressors .............................................................................. 2.1
Condensers................................................................................. 2.5
Evaporators ............................................................................... 2.9
Evaporator Piping ................................................................... 2.10
Vessels...................................................................................... 2.11
Piping....................................................................................... 2.14
Controls.................................................................................... 2.15
SYSTEMS.................................................................................. 2.19
Single-Stage Systems................................................................ 2.19
Economized Systems................................................................. 2.19
Multistage Systems................................................................... 2.19
Liquid Recirculation Systems................................................... 2.21
Safety Considerations............................................................... 2.26
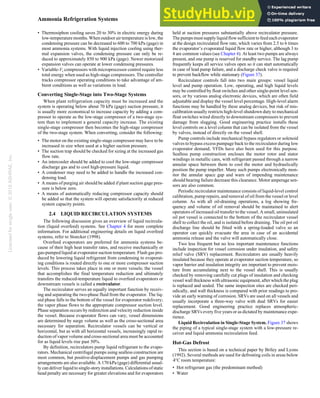
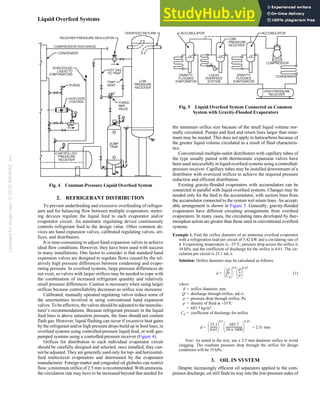
USTOM-ENGINEERED ammonia (R-717) refrigeration sys-
Ctems often have design conditions that span a wide range of
evaporating and condensing temperatures. Examples are (1) a food
freezing plant operating from 10 to –45°C; (2) a candy storage
requiring 15°C db with precise humidity control; (3) a beef chill
room at –2 to –1°Cwith high humidity; (4) a distribution warehouse
requiring multiple temperatures for storing ice cream, frozen food,
meat, and produce and for docks; and (5) a chemical process requir-
ing multiple temperatures ranging from 15 to –50°C. Ammonia is
the refrigerant of choice for many industrial refrigeration systems.
See Chapter 24 for information on refrigeration load calculations.
The figures in this chapter are for illustrative purposes only, and
may not show all the required elements (e.g., valves). For safety
and minimum design criteria for ammonia systems, refer to
ASHRAE Standard 15, IIAR Bulletin 109, IIAR Standard 2, and
applicable state and local codes.
History of Ammonia Refrigeration
First synthesized in 1823, ammonia was first used as a refrigerant
in an ice-making vapor absorption system developed by Ferdinand
Carré, a French engineer and inventor, in 1858 (GPO 1893). The
Carré machine used an aqueous ammonia solution, with water as the
absorbent and ammonia as the refrigerant. This type of vapor absorp-
tion system remains in use today.
Use of ammonia as a refrigerant in vapor compression systems
followed. David Boyle established an ice production plant in Jeffer-
son, TX, in 1873 using an improved compressor design, and he later
set up the Boyle Ice Machine Co. in Chicago, IL, in 1878 (Balmer
2010; Woolrich and Clark n.d.). With the financial backing of sev-
eral breweries, Professor Carl von Linde of Munich, Germany, had
30 ice machines of his design built between 1875 and 1881 (Dincer
1997; Schmidt 1908).
The first commercial production of synthetic ammonia began in
1913 (IIAR n.d.). Worldwide annual production of ammonia is
approximately 135 million metric tons, of which 9.4 million metric
tons was produced in the United States in 2011 (USGS 2012). Over
80% of the ammonia produced is used in agriculture as fertilizer; less
than 2% is used as a refrigerant (ASHRAE 2017).
Of the three primary first-generation refrigerants used during the
1920s [i.e., ammonia (R-717), chloromethane (R-40), and sulfur
dioxide (R-764)], only ammonia remains in use today as a refriger-
ant. Ammonia is considered a natural refrigerant because it is a com-
mon, naturally occurring compound, and it naturally breaks down
into hydrogen and nitrogen.
Ammonia Refrigerant for HVAC Systems
There is renewed interest in using ammonia for HVAC systems,
in part because of the scheduled phaseout and increasing costs of
chlorofluorocarbon (CFC) and hydrochlorofluorocarbon (HCFC)
refrigerants. Ammonia secondary systems that circulate chilled water
or another secondary refrigerant are a viable alternative to halocar-
bon systems, although ammonia is inappropriate for direct refriger-
ation systems (ammonia in the air unit coils) for HVAC applications.
Ammonia packaged chilling units are available for HVAC applica-
tions. As with the installation of any air-conditioning unit, all appli-
cable codes, standards, and insurance requirements must be
followed.
1. EQUIPMENT
1.1 COMPRESSORS
Compressors available for single- and multistage applications in-
clude the following:
• Rotary vane
• Reciprocating
• Rotary screw
Rotaryvanecompressorsaretypicallyusedforlow-stage(booster)
compressor applications. Reciprocating and screw compressors can
be used as single-stage, low-stage (booster), or high-stage machines
and can also be internally compounded to provide multiple compres-
sion stages on one compressor body.
The reciprocating compressor is the most common compressor
used in small, 75 kW or less, single-stage or multistage systems. The
screw compressor is the predominant compressor above 75 kW, in
both single- and multistage systems. Various combinations of com-
pressors may be used in multistage systems. Rotary vane and screw
compressors are frequently used for the low-pressure stage, where
large volumes of gas must be moved. The high-pressure stage may
be a reciprocating or screw compressor.
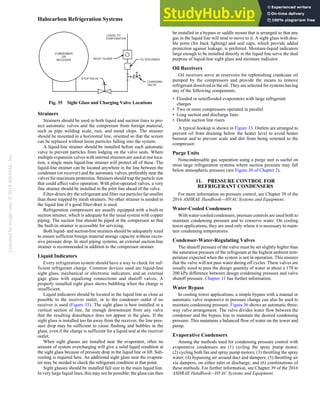
When selecting a compressor, consider the following:
• System size and capacity requirements.
• Location, such as indoor or outdoor installation at ground level or
on the roof.
• Equipment noise.
• Part- or full-load operation.
• Winter and summer operation.
• Pulldown time required to reduce the temperature to desired con-
ditions for either initial or normal operation. The temperature
must be pulled down frequently for some applications for a pro-
cess load, whereas a large cold-storage warehouse may require
pulldown only once in its lifetime.
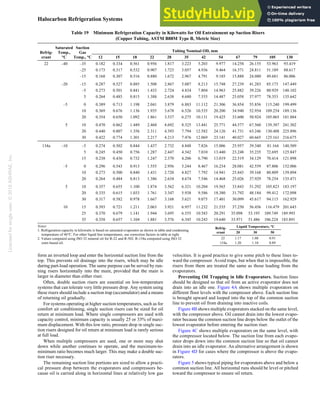
Lubricant Cooling. When a reciprocating compressor requires
lubricant cooling, an external heat exchanger using a refrigerant or
secondary cooling is usually added. Screw compressor lubricant
cooling is covered in detail in the section on Screw Compressors.
The preparation of this chapter is assigned to TC 10.3, Refrigerant Piping,
Controls and Accessories.
Related Commercial Resources](https://image.slidesharecdn.com/ashrae2018-refrigeration-230807180745-89f60944/85/ASHRAE-2018-REFRIGERATION-pdf-47-320.jpg)


![Licensed
for
single
user.
©
2018
ASHRAE,
Inc.
2.4 2018 ASHRAE Handbook—Refrigeration (SI)
reciprocating compressors. Most rotary vane compressors are lubri-
cated by injectors because they have no crankcase. In some designs,
a lubricant separator, lubricant receiver, and cooler are required on
the discharge of these compressors; a pump recirculates lubricant to
the compressor for both cooling and lubrication. In other rotary vane
compressor designs, a discharge lubricant separator is not used, and
lubricant collects in the high-stage suction accumulator or inter-
cooler, from which it may be drained. Lubricant for the injectors
must periodically be added to a reservoir.
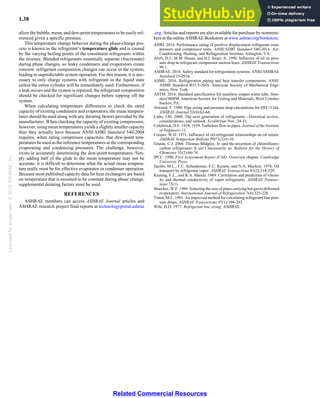
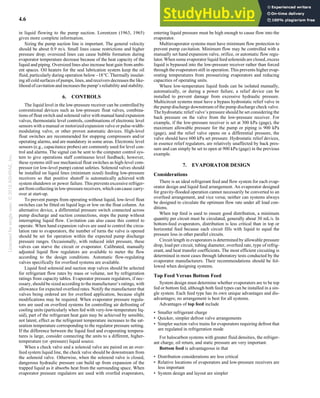
Cooling. The compressor jacket is cooled by circulating a cool-
ing fluid, such as a water/glycol solution or lubricant. Lubricant is
recommended, because it will not freeze and can serve both pur-
poses (Figure 4).
Screw Compressors
Helical screw compressors are the choice for most industrial re-
frigeration systems. All helical screw compressors have a constant-
volume (displacement) design. The volume index Vi refers to the in-
ternal volume ratio of the compressor (i.e., the reduction in volume
of the compressed gas from suction to discharge of the compressor).
Capacity control is accomplished by use of a slide valve, bypass
ports, or by controlling the speed [variable-frequency drive (VFD)].
The slide valve and bypass ports control capacity by only using a
portion of the screw(s) for the compression process.
Some compressors are designed with a fixed Vi. When Vi is fixed,
the compressor functions most efficiently at a certain compression
ratio (CR). In selecting a fixed Vi compressor, consider the average
CR rather than the maximum CR. A guide to proper compressor
selection is based on the equation Vi
k = CR, where k = 1.4 for ammo-
nia. For example, a screw compressor operating at 265 kPa suction
and 1350 kPa discharge has a CR = 5.09. Therefore, Vi = 3.2 (Vi =
CR1/k). Thus, a compressor with the Vi at or close to 3.2 is the best
selection. Because ambient conditions vary throughout the year, the
average condensing temperature may be 24°C (969 kPa). With the
lower discharge pressure, the average compressor CR is 3.65 and the
ideal Vi is 2.52. Therefore, a compressor with the Vi at or close to 2.5
is the proper selection to optimize efficiency.
Some compressors are equipped with a variable Vi control. This
makes compressor selection simpler, because the volume index can
vary for different operating conditions. Therefore, the internal
compression ratio can automatically match the external pressure
ratio. Typically, screw compressors with variable Vi can control
between 2.2 and 5.0 Vi. Variable-Vi compressors are beneficial over
a wide range of system pressure ratios to improve efficiency as con-
densing pressures vary.
Piping. Oil-flooded screw compressors are the most common
type of screw compressor used in refrigeration. Introduced in the late
1950s as an alternative to dry compressors with a symmetric rotor
profile, oil-flooded compressors rapidly gained acceptance in many
conventional reciprocating and small centrifugal applications. These
compressors typically have oil supplied to the compression area at a
volume rate of about 0.5% of the displacement volume. Some of this
oil is used for lubricating the bearings and shaft seal. Typically, par-
affinic or naphthenic mineral oils are used, though synthetics are
being used more frequently on some applications.
The oil fulfills three primary purposes: sealing, cooling, and
lubrication. The oil tends to fill any leakage paths between and
around the screws. This provides a good volumetric efficiency even
at high compression ratios. Normal volumetric efficiency exceeds
85% even with a compression ratio of 25. The oil sealing also helps
maintain good volumetric efficiency with decreased operating
speeds. The cooling function of the oil transfers much of the heat of
compression from the gas to the oil, keeping typical discharge tem-
peratures below 90°C. This allows high compression ratios without
the danger of oil breakdown. The oil’s lubrication function protects
the bearings, seals, and screw contact areas.
Oil injection to the screw compressor is normally achieved by
one of two methods:
• An oil pump operates and builds pressure over compressor dis-
charge pressure for oil injection. The pump may be required when
the screw compressor is operating at a low compression ratio or if
the compressor bearing design requires oil pressure greater than
compressor discharge pressure.
• Operation without a pump relies on the differential pressure across
the screw compressor as the driving force for the oil injection.
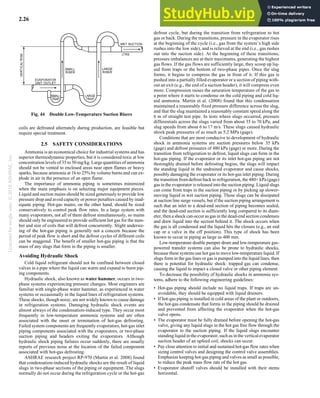
Some screw compressors may use a combination of both meth-
ods to achieve proper oil injection. The pump may only operate for
a period of time when the compression ratio is below a set value.
This option is shown schematically in Figure 5.
Oil injection requires an oil separator to remove the oil from the
high-pressure refrigerant. Oil separators are designed to satisfy re-
quirements of system type, refrigerant, and heat transfer equip-
ment being used. Modern separation equipment routinely limits
Fig. 4 Rotary Vane Booster Compressor Cooling
with Lubricant
Fig. 5 Screw Compressor Flow Diagram with
Optional Oil Pump](https://image.slidesharecdn.com/ashrae2018-refrigeration-230807180745-89f60944/85/ASHRAE-2018-REFRIGERATION-pdf-50-320.jpg)


![Licensed
for
single
user.
©
2018
ASHRAE,
Inc.
Carbon Dioxide Refrigeration Systems 3.3
by measuring saturated suction pressure and gas cooler outlet tem-
perature and regulating the refrigerant flow to maintain an optimum
discharge pressure. Achieving as low a temperature at the gas cooler
outlet as possible is key to good efficiency, suggesting that there is a
need for evaporatively cooled gas coolers, although none are cur-
rently on the market. Other devices, such as expanders, have been
developed to achieve the same effect by reducing the enthalpy during
the expansion process and using the recovered work in the compres-
sor to augment the electrical input.
CO2 Cascade System
The cascade system consists of two independent refrigeration
systems that share a common cascade heat exchanger. The CO2 low-
temperature refrigerant condenser serves as the high-temperature
refrigerant evaporator; this thermally connects the two refrigeration
circuits. System size influences the design of the cascade heat
exchanger: large industrial refrigeration system may use a shell-
and-tube vessel, plate-and-frame heat exchanger, or plate-and-shell
type, whereas commercial systems are more likely to use brazed-
plate, coaxial, and tube-in-tube cascade heat exchangers. In chilling
systems, the liquid CO2 is pumped from the receiver vessel below
the cascade heat exchanger to the heat load. In low-temperature
applications, the high-pressure CO2 liquid is expanded to a lower
pressure and a compressor is used to bring the suction gas back up
to the condensing pressure.
Using a cascade system allows a reduced high-temperature
refrigerant charge. This can be important in industrial applications
to minimize the amount of ammonia on site, or in commercial sys-
tems to reduce HFC refrigerant losses.
CO2 cascade systems are configured for pumped liquid recircu-
lation, direct expansion, volatile secondary and combinations of
these that incorporate multiple liquid supply systems.
Low-temperature cascade refrigeration application include cold
storage facilities, plate freezers, ice machines, spiral and belt freez-
ers, blast freezers, freeze drying, supermarkets, and many other
food and industrial product freezing systems.
Some theoretical studies [e.g., Vermeeren et al. (2006)] have sug-
gested that cascade systems are inherently less efficient than two-
stage ammonia plants, but other system operators claim lower
energy bills for their new CO2 systems compared to traditional
ammonia plants. The theoretical studies are plausible because intro-
ducing an additional stage of heat transfer is bound to lower the
high-stage compressor suction. However, additional factors such as
the size of parasitic loads (e.g., oil pumps, hot gas leakage) on the
low-stage compressors, the effect of suction line losses, and the
adverse effect of oil in low-temperature ammonia plants all tend to
offset the theoretical advantage of two-stage ammonia system, and
in the aggregate the difference in energy consumption one way or
the other is likely to be small. Other factors, such as reduced ammo-
nia charge, simplified regulatory requirements, or reduced operator
staff, are likely to be at least as significant in the decision whether to
adopt CO2 cascades for industrial systems.
In commercial installations, the greatest benefit of a CO2 cascade
is the reduction in HFC inventory, and consequent probable reduc-
tion in HFC emission. Use of a cascade also enables the operator to
retain existing HFC compressor and condenser equipment when
refurbishing a facility by connecting it to a CO2 pump set and
replacing the evaporators and low-side piping. End users in Europe
and the United States suggest that CO2 cascade systems are simpler
and easier to maintain, with fewer controls requiring adjustment,
than the HFC systems that they are replacing. This indicates that
they are inherently more reliable and probably cheaper to maintain
than conventional systems. If the efficiency is equivalent, then the
cost of ownership will ultimately be cheaper. However, it is not clear
if these benefits derive from the higher level of engineering input
required to introduce the new technology, or whether they can be
maintained in the long term.
2. SYSTEM DESIGN
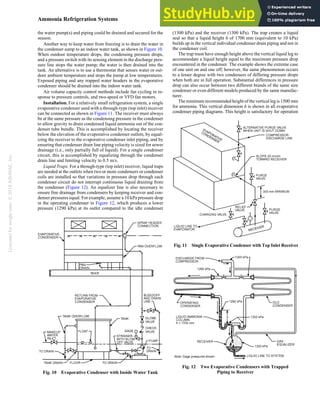
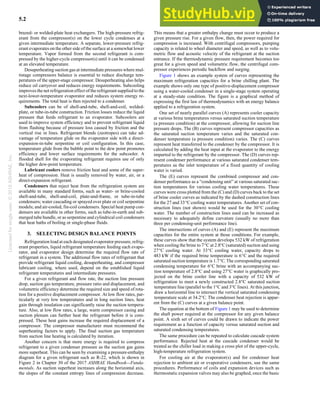
Transcritical CO2 Systems
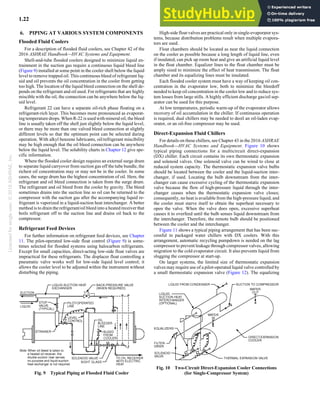
Recent advances in system component design have made it pos-
sible to operate in previously unattainable pressure ranges. The
development of hermetic and semihermetic multistage CO2 com-
pressors provided the economical ability to design air-cooled tran-
scritical systems that are efficient, reliable, and cost effective. Today,
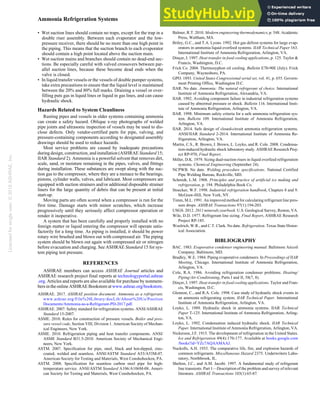
transcritical systems are commercially available in sizes from the
smallest appliances to entire supermarket systems. Figures 3 and 4
shows examples of simple transcritical systems. Heat rejection to
atmosphere is by cooling the supercritical CO2 gas without phase
change. For maximum efficiency, the gas cooler must be able to
operate as a condenser in colder weather, and the control system must
be able to switch from gas cooler operation (where outflow from the
air-cooled heat exchanger is restricted) to condenser operation
Fig. 3 Transcritical CO2 Refrigeration Cycle in Appliances
and Vending Machines
Fig. 4 CO2 Heat Pump for Ambient Heat to Hot Water](https://image.slidesharecdn.com/ashrae2018-refrigeration-230807180745-89f60944/85/ASHRAE-2018-REFRIGERATION-pdf-77-320.jpg)


![Licensed
for
single
user.
©
2018
ASHRAE,
Inc.
Carbon Dioxide Refrigeration Systems 3.7
maximum solubility limit in a CO2 system, problems may occur,
especially if the temperature is below 0°C. In this case, the water
freezes, and ice crystals may block control valves, solenoid valves,
filters, and other equipment.
If the water concentration in a CO2 system exceeds the saturation
limit, it creates carbonic acid, which can cause equipment failures
and possibly internal pipe corrosion. Filter-driers should be located
at all main liquid feed locations.
Because the entire CO2 system is at positive pressure during all
operating conditions, the most likely time for moisture penetration
is during charging. The appropriate specification for water content
depends on the size of the system and its intended operating tem-
perature. Chilling systems are more tolerant of water than freezers,
and industrial systems with large liquid receivers are likely to be
more tolerant than small direct-expansion (DX) circuits. It is imper-
ative that the CO2 is specified with a suitable water content. Refrig-
erant grade, with a content less than 5 ppm, is suitable for small
commercial systems; larger plant may use cryogenic grade, with a
content less than 20 ppm. The content should be certified by the ven-
dor and tested on site before installing in the system. On small sys-
tems, it may also be appropriate to charge through a filter-drier.
3. SYSTEM SAFETY
Safety is an important factor in the design of every refrigeration
system, and is one of the main reasons why carbon dioxide is
gaining acceptance as a refrigerant of the future. CO2 is a natural
refrigerant and considered environmentally safe. As a refrigerant, it
is not without potential risks, but they are substantially smaller than
those of other refrigerants. It is a slightly toxic, odorless, colorless
gas with a slightly pungent, acid taste. Carbon dioxide is a small but
important constituent of air. CO2 will not burn or support combus-
tion. An atmosphere containing of more than 10% CO2 will extin-
guish an open flame.
Mechanical failure in refrigeration equipment and piping can
course a rapid increase in concentration levels of CO2. When in-
haled at elevated concentrations, carbon dioxide may produce mild
narcotic effects, stimulation of the respiratory centre, and asphyxi-
ation, depending on concentration present.
In the United States, the Occupational Safety and Health Admin-
istration (OSHA) limits the permissible exposure limit (PEL) time
weighted average (TWA) concentration that must not be exceed
during any 8 h per day, 40 h per week, to 5000 ppm. The OSHA
short-term exposure limit (STEL), a 15 min TWA exposure that
should not be exceeded, is 30 000 ppm. In other countries (e.g., the
United Kingdom), the STEL is lower, at 15 000 ppm.
At atmospheric pressure, carbon dioxide is a solid, which sub-
limes to vapor at –56.6°C. All parts of a charged CO2 refrigerating
system are above atmospheric pressure. Do not attempt to break
piping joints or to remove valves or components without first ensur-
ing that the relevant parts of the system have been relieved of pres-
sure.
When reducing pressure or transferring liquid carbon dioxide,
care is necessary to guard against blockages caused by solid carbon
dioxide, which forms at pressures below 517 kPa. If a blockage
occurs, it must be treated with caution. No attempt should be made
to accelerate the release of pressure by heating the blocked compo-
nent.
In a room where people are present and the CO2 concentration
could exceed the refrigerant concentration limit of 0.9 kg/10 m3 in
the event of a leak, proper detection and ventilation are required.
When detectors sense a dangerous level of CO2 in a room, the alarm
system must be designed to make sure all people in the room are
evacuated and no one is allowed to reenter until concentration levels
return to acceptable ranges. Protective clothing, including gloves
and eyewear, should be standard in locations that contain CO2
equipment or controls, or where service work is done.
4. PIPING
Carbon Dioxide Piping Materials
When selecting piping material for CO2 refrigeration systems,
the operating pressure and temperature requirements must be under-
stood. Suitable piping materials may include copper, carbon steel,
stainless steel, and aluminum.
Many transcritical systems standardize on brazed air-conditioning
and refrigeration (ACR) copper piping for the low-pressure side of
the system, because of its availability. For pressures above 4.1 MPa,
the annealing effect of brazing can weaken copper pipe, so pipework
should be welded steel. Alternatively, cold-formed mechanical per-
manent joints can be used with copper pipe if the pipe and fittings
are suitably pressure rated. Small-diameter copper tubing meets the
requirement pressure ratings. The allowable internal pressure for
copper tubing in service is based on a formula used in ASME Stan-
dard B31 and ASTM Standard B280:
p = (2)
where
p = allowable pressure
S = allowable stress [i.e., allowable design strength for continuous
long-term service, from ASME (2007)]
tm = wall thickness
D = outside diameter
Carbon Steel Piping for CO2
Low-temperature seamless carbon steel pipe (ASTM Standard
A333) Grade 6 is suited for conditions within refrigeration systems.
Alternatively a number of common stainless steel alloys provide
adequate low temperature properties.
Stainless steel, aluminum, and carbon steel piping require qual-
ified welders for the piping installation.
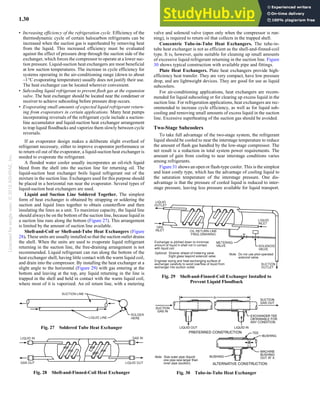
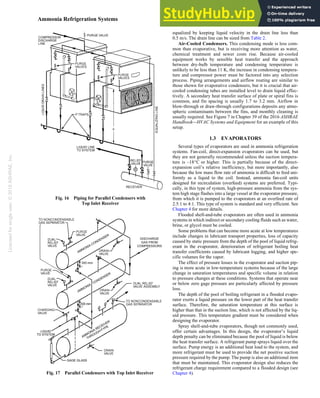
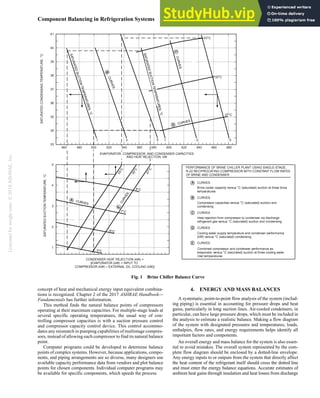
Pipe Sizing
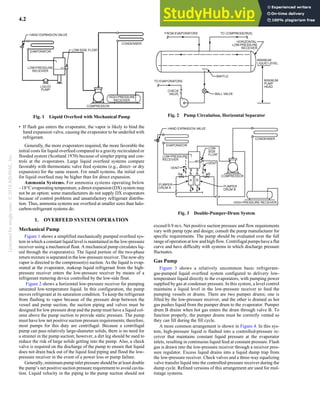
For the same pressure drop, CO2 has a corresponding tempera-
ture penalty 5 to 10 times smaller than ammonia and R-134a have
(Figure 11). For a large system with an inherently large pressure
drop, the temperature penalty with CO2 is substantially less than the
same pressure drop using another refrigerant.
Because of CO2’s physical properties (particularly density), the
vapor side of the system is much smaller than in a typical ammonia
system, but the liquid side is similar or even larger because CO2’s
Fig. 10 Water Solubility in CO2
(Adapted from Vestergaard 2007)
2Stm
D – 0.08tm
-----------------------------
-](https://image.slidesharecdn.com/ashrae2018-refrigeration-230807180745-89f60944/85/ASHRAE-2018-REFRIGERATION-pdf-81-320.jpg)


![Licensed
for
single
user.
©
2018
ASHRAE,
Inc.
6.8 2018 ASHRAE Handbook—Refrigeration (SI)
Copper Plating
Copper plating is the formation of a copper film on steel surfaces
in refrigeration and air-conditioning compressors. A blush of copper
is often discernible on compressor bearing and valve surfaces when
machines are cut apart. After several hours of exposure to air, this
thin film becomes invisible, probably because metallic copper is
converted to copper oxide. In severe cases, the copper deposit
can build up to substantial thickness and interfere with com-
pressor operation. Extreme copper plating can cause compressor
failure.
Although the exact mechanism of copper plating is not com-
pletely understood, early work by Spauschus (1963), Steinle and
Bosch (1955), and Steinle and Seemann (1951, 1953) demonstrated
that three distinct steps must occur: (1) copper oxidation, (2) solu-
bilization and transport of copper ions, and (3) deposition of copper
onto iron or steel.
In step 1, copper oxidizes from the metallic (0 valent) state to
either the +1 or +2 oxidation state. Under normal operating condi-
tions, this chemical process does not occur with a lubricant, and is
unlikely to occur with carboxylic acids. The most likely source of
oxidizing agents is system contaminants, such as air (oxygen), chlo-
rine-containing species (CFC refrigerants or cleaning solvents, sol-
der fluxes), or strong acids.
Step 2 is dissolution of the copper ions. Spauschus postulated
that an organic complex of the copper and olefins is the soluble spe-
cies in mineral oils. Oxygen-containing lubricants are much more
likely to solubilize metal ions and/or complexes via coordination
with the oxygen atoms. Once soluble, the copper can move through-
out the refrigeration system.
Step 3 is deposition of the copper onto iron surfaces, an electro-
chemical process in which electrons transfer from iron to copper,
resulting in copper metal (0 valent) plating on the surface of the
iron and the concomitant generation of iron ions. This is most
likely to occur on hot, clean iron surfaces and is often seen on bear-
ing surfaces.
Thomas and Pham (1989) compared copper plating in R-12/
mineral oil and R-134a/PAG systems. They showed that R-134a/
PAG systems produce much less total copper (in solution and as
precipitate) than R-12/mineral oil systems, and that water did not
significantly affect the amount of copper produced. In an R-134a/
PAG system, copper is largely precipitated. In an R-12/mineral oil
system, copper is found in solution when dry and precipitates
when wet. Walker et al. (1960) found that water below the satura-
tion level has no significant effect on copper plating for R-12/
mineral oil systems. Spauschus (1963) observed that copper plat-
ing in sealed glass tubes is more prevalent with medium-refined
naphthenic pale oil than with highly refined white oil, and con-
cluded that the refrigerant/lubricant reaction is an essential pre-
cursor for gross copper plating. The excess acid produced by
refrigerant decomposition has little effect on copper solubility, but
facilitates plating. Herbe and Lundqvist (1996, 1997) examined a
large number of systems retrofitted from R-12 to R-134a for con-
taminants and copper plating. They reported that copper plating
does not occur in retrofitted systems where the level of contami-
nants is low.
ASHRAE research project RP-1249 examined the steps of cop-
per plating in refrigeration and air-conditioning systems (Kauffman
2005). The study used glass vial tests to simulate acidic oil drops
adhering to copper tubing and/or compressor steel surfaces with and
without air contamination, and analyzed copper plating removed
from field refrigeration systems. The findings were as follows:
• Copper plating is most likely an electrochemical process involv-
ing copper carboxylates.
• The steel surface must be corroded for copper plating to occur.
• Water promotes plating by encouraging steel surface corrosion
and providing a conductive path.
• Air only has an effect when copper metal surfaces are corroded.
• Passivation of steel surfaces does not inhibit copper plating.
• Copper platings created in the lab and field are similar in mor-
phology and composition.
• Copper plating occurs in stationary and nonwearing rotating steel
surfaces.
Corrosion
Corrosion of Refrigerant Piping and Heat Exchangers. Cor-
rosion on copper tubing used for refrigerant piping and heat
exchangers can cause leaks that release refrigerant to the atmo-
sphere, shorten equipment life, and result in property damage
because of failed temperature control. Corrosive mechanisms are
(1) stress corrosion cracking caused by ammonia and related com-
pounds from refrigerant-tube insulation material, (2) formicary cor-
rosion caused by acetic and formic acids (e.g., from interior house
paint, oak, engineered wood products, carpet, and adhesives), and
(3) sulfur corrosion caused by drywall out-gassing, biofeed synthe-
sis, organic fertilizers, and sewer gases.
Formicary Corrosion. Formicary (“ants’ nest”) corrosion com-
monly appears in copper tubing in air-conditioning and refrigera-
tion equipment, and also has been reported in heat pumps. Damage
typically is found in shielded areas (crevices) in closed heat
exchanger bundles or between copper tubing and aluminum fins.
Formicary corrosion occurs when air, moisture, and certain low-
molecular-mass organic compounds are present. Degradation prod-
ucts are carboxylic acids such as formic and acetic acids.
Control measures include removing any one of the causes,
selecting substances with low carboxylic content, and using more
corrosion-resistant alloys and hydrophobic coatings that reduce the
effect of humidity (Corbett and Severance 2005).
Even though formicary corrosion occurs outside the refrigeration
system, the problem can eventually affect the internal system
because of system conditions or migration of contaminants into the
system.
Effects of Unsaturated Contaminants on HFC or HFO
Refrigerants and Lubricants
In HVAC&R systems, unsaturated fluorocarbon contaminants in
refrigerants may result in reaction products that could cause prob-
lems in system performance or reliability. However, the 40 mg/kg
limit for unsaturated halogenated contaminants in new and
reclaimed refrigerants set by AHRI Standard 700 has proven to be
more restrictive than expected for reclaimers, recyclers, and
HVAC&R system providers. In addition, it may not be appropriate
to classify all unsaturated compounds as unstable and blanket them
under the same restrictive limit: compounds such as hydrofluoroole-
fins (HFOs) have been tested as low-global-warming-potential
(GWP) alternative refrigerants and shown to have acceptable stabil-
ity in some applications. Rohatgi (2016) examined the effects of
halogenated unsaturated contaminants in refrigerants on the stabil-
ity of refrigerant/lubricant systems, and recommended a concentra-
tion limit specific to the unsaturated contaminant, below which the
refrigerant/lubricant system is thermally stable. Based on criteria
such as visual changes, total acid numbers (TAN), organic anion
concentration, and dissolved metal concentrations after aging,
Rohatgi concluded that the R134a/POE system was as stable as the
control (without contaminant) when the concentration of its con-
taminants [R-1130, R-1130(E), R-1131, and R-1234yf] was less
than 1000 mg/kg. The R-1234yf/POE system was stable when its
contaminants [R-1225ye(Z), R-1233xf, and R-1243zf] were less
than 5000 mg/kg, whereas the R-123/mineral oil system was stable
when its contaminants (R-1122, R-1123, and R-1131) were less than
30 000 mg/kg. These maximum concentration limits were however](https://image.slidesharecdn.com/ashrae2018-refrigeration-230807180745-89f60944/85/ASHRAE-2018-REFRIGERATION-pdf-108-320.jpg)


![Licensed
for
single
user.
©
2018
ASHRAE,
Inc.
Control of Moisture and Other Contaminants in Refrigerant Systems 7.7
• Plugging expansion valve screens, expansion valve ports, or cap-
illary tubing
• Depositing on suction or discharge valve seats, significantly re-
ducing compressor efficiency
• Plugging oil holes in compressor parts, leading to improper lubri-
cation
• Increasing the rate of chemical breakdown [e.g., at elevated tem-
peratures, R-22 decomposes more readily when in contact with
iron powder, iron oxide, or copper oxide (Norton 1957)]
• Plugging driers, filters, and filter-driers
Liquid-line filter-driers, suction filters, and strainers isolate con-
taminants from the compressor and expansion valve. Filters mini-
mize return of particulate matter to the compressor and expansion
valve, but the capacity of permanently installed liquid and/or suction
filters must accommodate this particulate matter without causing
excessive, energy-consuming pressure losses. Equipment manufac-
turers should consider the following procedures to ensure proper
operation during the design life:
1. Develop cleanliness specifications that include a reasonable
value for maximum residual matter. Some manufacturers specify
allowable quantities in terms of internal surface area. ASTM
Standard B280 allows a maximum of 37 mg of contaminants per
square metre of internal surface.
2. Multiply the factory contaminant level by a suitable safety factor
to allow for solid contaminants added during installation. This
factor depends on the type of system and the previous experience
of the installers, among other considerations.
3. Determine maximum pressure drop to be incurred by the suction
or liquid filter when loaded with the quantity of solid matter cal-
culated in Step 2.
4. Conduct filtration capability tests per ASHRAE Standard 63.2.
5. Select driers for each system per its capacity requirements and
test data. In addition to contaminant removal capacity, tests can
evaluate filter efficiency, maximum escaped particle size, and
average escaped particle size.
Very small particles passing through filters tend to accumulate in
the crankcase. Most compressors tolerate a small quantity of these
particles without allowing them into the oil pump inlet, where they
can damage running surfaces.
Organic Contaminants: Sludge, Wax, and Tars
Organic contaminants in a refrigerating system with a mineral oil
lubricant can appear when organic materials such as oil, insulation,
varnish, gaskets, and adhesives decompose. As opposed to inorganic
contaminants, these materials are mostly carbon, hydrogen, and oxy-
gen. Organic materials may be partially soluble in the refrigerant/
lubricant mixture or may become so when heated. They then circu-
late in the refrigerating system and can plug small orifices. Organic
contaminants in a refrigerating system using a synthetic polyol ester
lubricant may also generate sludge. The following contaminants
have demonstrated the ability to compromise system chemistry and
should be avoided:
• Paraffin (typically found in mineral oil lubricants)
• Silicone (found in some machine lubricants)
• Phthalate (found in some machine lubricants)
Whether mineral oil or synthetic lubricants are used, some
organic contaminants remain in a new refrigerating system during
manufacture or assembly. For example, excessive brazing paste
introduces a waxlike contaminant into the refrigerant stream. Cer-
tain cutting lubricants, corrosion inhibitors, or drawing compounds
frequently contain paraffin-based compounds. These lubricants can
leave a layer of paraffin on a component that may be removed by the
refrigerant/lubricant combination and generate insoluble material in
the refrigerant stream. Organic contamination also results during
the normal method of fabricating return bends. The die used during
forming is lubricated with these organic materials, and afterwards
the return bend is brazed to the tubes to form the evaporator and/or
condenser. During brazing, residual lubricant inside the tubing and
bends can be baked to a resinous deposit.
If organic materials are handled improperly, certain contami-
nants remain. Resins used in varnishes, wire coating, or casting seal-
ers may not be cured properly and can dissolve in the refrigerant/
lubricant mixture. Solvents used in washing stators may be ad-
sorbed by the wire film and later, during compressor operation,
carry chemically reactive organic extractables. Chips of varnish, in-
sulation, or fibers can detach and circulate in the system. Portions of
improperly selected or cured rubber parts or gaskets can dissolve in
the refrigerant.
Refrigeration-grade mineral oil decomposes under adverse
conditions to form a resinous liquid or a solid frequently found on
refrigeration filter-driers. These mineral oils decompose notice-
ably when exposed for as little as 2 h to temperatures as low as
120°C in an atmosphere of air or oxygen. The compressor manu-
facturer should perform all high-temperature dehydrating opera-
tions on the machines before adding the lubricant charge. In
addition, equipment manufacturers should not expose compres-
sors to processes requiring high temperatures unless the compres-
sors contain refrigerant or inert gas.
The result of organic contamination is frequently noticed at the
expansion device. Materials dissolved in the refrigerant/lubricant
mixture, under liquid line conditions, may precipitate at the lower
temperature in the expansion device, resulting in restricted or
plugged capillary tubes or sticky expansion valves. A few milli-
grams of these contaminants can render a system inoperative.
These materials have physical properties that range from a fluffy
powder to a solid resin entraining inorganic debris. If the contam-
inant is dissolved in the refrigerant/lubricant mixture in the liquid
line, it will not be removed by a filter-drier.
Chemical identification of these organic contaminants is very dif-
ficult. Fourier transform infrared spectroscopy (FTIR), gas chroma-
tography with mass spectroscopy (GCMS), liquid chromatography
with mass spectroscopy (LCMS), and other mass spectroscopy-
coupled analytical instruments can characterize the type of organic
groups and compounds present in contaminants. Materials found in
actual systems vary from waxlike aliphatic hydrocarbons to resinlike
materials containing double bonds, carbonyl groups, and carboxyl
groups. In some cases, organic compounds of copper and/or iron
have been identified.
These contaminants can be eliminated by carefully selecting
materials and strictly controlling cleanliness during manufacture
and assembly of the components as well as the final system.
Because heat degrades most organic materials and enhances chem-
ical reactions, avoid operating conditions with excessively high dis-
charge or bearing surface temperatures to prevent formation of
degradation products.
Residual Cleaning Agents
Mineral Oil Systems. Solvents used to clean compressor parts
are likely contaminants if left in refrigerating equipment. These
solvents are considered pure liquids without additives. If additives
are present, they are reactive materials and should not be in a re-
frigerating system. Some solvents are relatively harmless to the
chemical stability of the refrigerating system, whereas others initi-
ate or accelerate degradation reactions. For example, the common
mineral spirits solvents are considered harmless. Other common
compounds react rapidly with hydrocarbon lubricants (Elsey et al.
1952).
Polyol Ester Lubricated Systems. Typical solvents used in
cleaning mineral oil systems are not compatible with polyol ester](https://image.slidesharecdn.com/ashrae2018-refrigeration-230807180745-89f60944/85/ASHRAE-2018-REFRIGERATION-pdf-123-320.jpg)


![Licensed
for
single
user.
©
2018
ASHRAE,
Inc.
7.10 2018 ASHRAE Handbook—Refrigeration (SI)
Contaminant control concerns for retrofitting a system to an al-
ternative refrigerant fall into the following categories:
• Cross-contamination of old and new refrigerants. This
should be avoided even though there are usually no chemical
compatibility problems between the original refrigerants and
their replacements. One problem with mixing refrigerants is that
it is difficult to determine system performance after retrofit.
Pressure/temperature relationships are different for a blend of
two refrigerants than for each refrigerant individually. A second
concern is that if the new refrigerant charge must be removed in
the future, the mixture may not be reclaimable (DuPont 1992).
The phaseout of HCFCs has coincided with a significant
increase in cross-contaminated refrigerants, especially R-22.
• Cross-contamination of old and new lubricant. Refrigerant
manufacturers claim some replacement refrigerants are direct
drop-ins, with no specific requirement for change in lubricant.
Depending on the particular refrigerant and type of system,
equipment manufacturers generally specify a recommended
replacement lubricant. In some cases, the new lubricant is
incompatible with the old one or with chlorinated residues pres-
ent. In other cases, the old lubricant is insoluble with the new
refrigerant and tends to collect in the evaporator, interfering
with heat transfer. For example, when mineral oil is replaced by
a polyol ester lubricant during retrofit to an HFC refrigerant, a
typical recommendation is to reduce the old oil content to 5% or
less of the nominal oil charge (Castrol 1992). Some retrofit rec-
ommendations specify lower levels of acceptable contamination
for polyol ester lubricant/HFC retrofits, so original equipment
manufacturers recommendations should be obtained before
attempting a conversion. On larger centrifugal systems, per-
forming a system cleanup to reduce oil concentration before ret-
rofit can prevent the need for several costly oil changes after the
retrofit, and can significantly diminish the need for later system
decontamination to address sludge build-up. Even when the
level of the original lubricant is significantly reduced, if the
replacement lubricant [e.g., POE (polar)] has a different polarity
than the original [e.g., mineral oil (nonpolar)], the solubility of
built-up residues in the system may change. This change in sol-
ubility may liberate sludge particles, which can cause blockages
in narrower parts of the system, such as control orifices and cap-
illary tubes, reducing system capacity or functionality. Larger
particulates can also cause premature compressor failure.
• Chemical compatibility of old system components with new
fluids. One of the preparatory steps in a retrofit is to confirm that
either the existing materials in the system are acceptable or that
replacement materials are on hand to be installed in the system
during the retrofit. Fluorocarbon refrigerants generally have sol-
vent properties, and some are very aggressive. This characteris-
tic can lead to swelling and extrusion of polymer O rings,
undermining their sealing capabilities. Material can also be
extracted from polymers, varnishes, and resins used in hermetic
motor windings. These extracts can then collect in expansion
devices, interfering with system operation. Residual manufac-
turing fluids such as those used to draw wire for compressor
motors can be extracted from components and deposited in
areas where they can interfere with operation. Suitable materials
of construction have been identified by equipment manufactur-
ers for use with HFC refrigerant systems.
Drier media must also be chemically compatible with the new re-
frigerant and effective in removing moisture, acid, and particulates
in the presence of the new refrigerant. Drier media commonly used
with CFC refrigerants tend to accept small HFC refrigerant mole-
cules and lose moisture retention capability (Cohen and Blackwell
1995), although some media have been developed that minimize
this tendency. Compatibility with next-generation, low-global-
warming-potential (LGWP), and natural refrigerants requires vali-
dation, as well.
5. CHILLER DECONTAMINATION
Chiller decontamination is used to clean reciprocating, rotary
screw, and centrifugal machines. Large volumes of refrigerant are
circulated through a contaminated chiller while continuously
being reclaimed. It has been used successfully to restore many
chillers to operating specifications. Some chillers have been saved
from early retirement by decontamination procedures. Variations
of the procedure are myriad and have been used for burnouts,
water-flooded barrels, particulate incursions, chemical contamina-
tion, brine leaks, and oil strips. One frequently used technique is
to perform numerous batch cycles, thus increasing the velocity-
based cleansing component. Excess oil is stripped out to improve
chiller heat transfer efficiency. The full oil charge can be removed
in preparation for refrigerant conversion.
Low-pressureunits require differentmachinery than high-pressure
units. It is best to integrate decontamination and mechanical
services early into one overall procedure. On machines that require
compressor rebuild, it is best to perform decontamination work
while the compressor is removed or before it is rebuilt, particularly
for reciprocating units. Larger-diameter or relocated access ports
may be requested. The oil sump will be drained. For chillers that
cannot be shut down, special online techniques have been developed
using reclamation. The overall plan is coordinated with operations
personnel to prevent service interruptions. For some decontamina-
tion projects, it is advantageous to have the water boxes open; in
other cases, closed. Intercoolers offer special challenges.
6. SYSTEM SAMPLING
Analysis of refrigerant and lubricant, either as follow-up to a
retrofit, for troubleshooting a refrigeration or chiller system, or as
part of a routine maintenance plan, helps validate system perfor-
mance and identify potential system problems before they become
serious issues. Refrigerant analysis can identify specific system
contaminants such as moisture, noncondensable gases, acids,
chlorides, particulate, high-boiling-point residue (e.g., lubricant),
and other refrigerants. Under AHRI Standard 700 procedures, the
analysis measures specific levels of each contaminant except for
chlorides and particulates, which are evaluated on a pass/fail
basis.
Lubricant analysis similarly measures several trace elements,
including additives formulated for the particular lubricant. Standard
lubricant analysis also measures viscosity, moisture, and total acid
number. For lubricants with suspended debris, consider ferro-
graphic analysis or inductively coupled plasma (ICP) testing for ele-
mental analysis or a particle count and size distribution. Debris can
also be filtered out and visually assessed by microscopy or compo-
sitionally analyzed by scanning electron microscope with electron
dispersive spectroscopy (SEM/EDS) and x-ray fluorescence (XRF)
for elements identification, x-ray diffraction (XRD) for compounds
identification, or other methods.
For chillers, water chemistry is also very important to maintain-
ing an efficient and reliable system. (Water treatment is addressed in
Chapter 49 of the 2015 ASHRAE Handbook—HVAC Applications.)
Note that contaminants usually infiltrate the system or are generated
very slowly. As a result, the system can become inefficient and dete-
riorate to the point of failure without noticeable warning. Regular,
periodic sampling and trending the results promotes more efficient
and reliable system operation, which can significantly reduce both
operating and maintenance costs.](https://image.slidesharecdn.com/ashrae2018-refrigeration-230807180745-89f60944/85/ASHRAE-2018-REFRIGERATION-pdf-126-320.jpg)


![Licensed
for
single
user.
©
2018
ASHRAE,
Inc.
8.1
CHAPTER 8
EQUIPMENT AND SYSTEM DEHYDRATING,
CHARGING, AND TESTING
Dehydration (Moisture Removal) ................................................................................................... 8.1
Moisture Measurement.................................................................................................................... 8.3
Charging ......................................................................................................................................... 8.4
Testing for Leaks............................................................................................................................. 8.4
Performance Testing ....................................................................................................................... 8.5
ROPER dehydration, charging, and testing of packaged refrig-
Peration systems and components (compressors, evaporators,
and condensing coils) help ensure proper performance and extend
the life of refrigeration systems. This chapter covers the methods
used to perform these functions. It does not address criteria such as
allowable moisture content, refrigerant quantity, and performance,
which are specific to each machine.
1. DEHYDRATION (MOISTURE REMOVAL)
Factory dehydration may be feasible only for certain sizes of
equipment. On large equipment, which is open to the atmosphere
when connected in the field, factory treatment is usually limited to
purge and backfill, with an inert holding charge of nitrogen. In most
instances, this equipment is stored for short periods only, so this
method suffices until total system evacuation and charging can be
done at the time of installation.
Excess moisture in refrigeration systems may lead to freeze-up of
the capillary tube or expansion valve. It also has a negative effect on
thermal stability of certain refrigeration oils [e.g., polyol ester
(POE)]. (Chapter 7 has more information on moisture and other con-
taminants in refrigerant systems.)
Except for freeze-up, these effects are not normally detected by a
standard factory test.
It is important to use a dehydration technique that yields a safe
moisture level without adding foreign elements or solvents, because
contaminants can cause valve breakage, motor burnout, and bearing
and seal failure. In conjunction with dehydration, an accurate
method of moisture measurement must be established. Many fac-
tors, such as the size of the unit, its application, and type of refriger-
ant, determine acceptable moisture content. Table 1 shows moisture
limits recommended by various manufacturers for particular refrig-
eration system components.
Sources of Moisture
Moisture in refrigerant systems can be (1) retained on the sur-
faces of metals; (2) produced by combustion of a gas flame; (3) con-
tained in liquid fluxes, oil, and refrigerant; (4) absorbed in the
hermetic motor insulating materials; (5) derived from the factory
ambient at the point of unit assembly; and (6) provided by free water.
Moisture contained in the refrigerant has no effect on dehydration of
the component or unit at the factory. However, because the refriger-
ant is added after dehydration, it must be considered in determining
the overall moisture content of the completed unit. Moisture in oil
may or may not be removed during dehydration, depending on when
the oil is added to the component or system.
Bulk mineral oils, as received, have 20 to 30 mg/kg of moisture.
Synthetic POE lubricants have 50 to 85 mg/kg; they are highly
hygroscopic, so they must be handled appropriately to prevent
moisture contamination. Refrigerants have an accepted commer-
cial tolerance of 10 to 15 mg/kg on bulk shipments. Controls at the
factory are needed to ensure these moisture levels in the oils and
refrigerant are maintained.
Newer insulating materials in hermetic motors retain much less
moisture compared to the old rag paper and cotton-insulated motors.
However, tests by several manufacturers have shown that the stator
is still the major source of moisture in compressors.
Dehydration by Heat, Vacuum, or Dry Air
Heat may be applied by placing components in an oven or by
using infrared heaters. The oven temperature should be selected
carefully to prevent damage to the synthetics used and to avoid
breakdown of any residual run-in oil that may be present in compres-
sors. Oven temperatures of 80 to 170°C are usually maintained. Air
in the oven must be maintained at low humidity. When dehydrating
by heat alone, the time and escape area are critical; therefore, the size
of parts that can be economically dehydrated by this method is
restricted.
The vacuum method reduces the boiling point of water below the
ambient temperature. The moisture then changes to vapor, which is
pumped out by the vacuum pump. Table 3 in Chapter 1 of the 2017
ASHRAE Handbook—Fundamentals shows the relationship of tem-
perature and pressure for water at saturation.
Vacuum is classified according to the following absolute pressure
ranges:
Low Vacuum 101.325 to 3.5 kPa
Medium Vacuum 3500 to 0.130 Pa
High Vacuum 130 to 0.13 mPa
Very High Vacuum 130 to 0.13 Pa
Ultrahigh Vacuum 0.13 Pa and below
The degree of vacuum achieved and the time required to obtain
the specified moisture level are a function of the (1) type and size of
vacuum pump used, (2) internal volume of the component or system,
(3) size and composition of water-holding materials in the system,
(4) initial amount of moisture in the volume, (5) piping and fitting
sizes, (6) shape of the gas passages, and (7) external temperatures
maintained. The pumping rate of the vacuum pump is critical only if
the unit is not evacuated through a conductance-limiting orifice such
as a purge valve. Excessive moisture content, such as a pocket of
puddled water, takes a long time to remove because of the volume
expansion to vapor.
Vacuum measurements should be taken directly at the equipment
(or as close to it as possible) rather than at the vacuum pump. Small
tubing diameters or long tubing runs between the pump and the
equipment should be avoided because line/orifice pressure drops
reduce the actual evacuation level at the equipment.
The preparation of this chapter is assigned to TC 8.1, Positive Displacement
Compressors.
Related Commercial Resources](https://image.slidesharecdn.com/ashrae2018-refrigeration-230807180745-89f60944/85/ASHRAE-2018-REFRIGERATION-pdf-129-320.jpg)


![Licensed
for
single
user.
©
2018
ASHRAE,
Inc.
Equipment and System Dehydrating, Charging, and Testing 8.5
method is normally used to measure the total leakage rate from all
joints simultaneously. The main limitation for this method is that the
costs for test equipment and consumables are higher than for other
leak detection methods. Test levels for production equipment are
typically set near 10–2 mm3/s.
The required concentration of helium depends on the maximum
leak permissible, the configuration of the system under test, the time
the system can be left in the helium atmosphere, and the vacuum
level in the system; the lower the vacuum level, the higher the
helium readings. The longer a unit is exposed to the helium atmo-
sphere, the lower the concentration necessary to maintain the
required sensitivity. If, because of the shape of the test unit, a leak is
distant from the point of sampling, a good vacuum must be drawn,
and sufficient time must be allowed for traces of helium to appear on
the mass spectrometer.
As with other methods described in this chapter, the best testing
procedure when using the spectrometer is to locate and characterize
calibrated leaks at extreme points of the test unit and then to adjust
exposure time and helium concentration to allow cost-effective test-
ing. One manufacturer reportedly found leaks of 1.4 g of refrigerant
per year by using a 10% concentration of helium and exposing the
tested system for 10 min.
The sensitivity of the mass spectrometer method can be limited
by the characteristics of the tested system. Because only the total
leakage rate is found, it is impossible to tell whether a leakage rate
of, for example, 30 g per year is caused by one fairly large leak or
several small leaks. If the desired sensitivity rejects units outside the
sensitivity range of tests listed earlier in this chapter, it is necessary
to use a helium probe to locate leaks. In this method, the compo-
nent or system to be probed is fully evacuated to clear it of helium;
then, while the system is connected to the mass spectrometer, a fine
jet of helium is sprayed over each joint or suspect area. With large
systems, a waiting period is necessary because some time is
required for the helium to pass from the leak point to the mass spec-
trometer. To save time, isolated areas (e.g., return bends on one end
of a coil) may be hooded and sprayed with helium to determine
whether the leak is in the region.
With a hand-held mass spectrometer, the unit to be tested is
pressurized with pure helium or a helium/nitrogen mixture, and
hand-held “sniffer” is used to check each joint and area of concern.
The required helium concentration and pressure depend on the max-
imum leak permissible. This method can be calibrated to detect
leaks of as low as 1.42 g of refrigerant per year, but it shares the
same disadvantages as electronic leak testing. Every joint and sus-
pect area should be explored.
Special Considerations
There are two general categories of leak detection: those that
allow a leak check before refrigerant is introduced into the system,
and those that require refrigerant. Methods that do not use refriger-
ant have the advantage that heat applied to repair a joint has no
harmful effects. On units containing refrigerant, the refrigerant must
be removed and the unit vented before any welding, brazing, or sol-
dering is attempted. This practice avoids refrigerant breakdown and
pressure build-up, which would prevent the successful completion
of a sound joint.
All leak-testing equipment must be calibrated frequently to
ensure maximum sensitivity. The electronic leak detector and the
mass spectrometer are usually calibrated with equipment furnished
by the manufacturer. Mass spectrometers are usually checked using
a flask containing helium. A glass orifice in the flask allows helium
to escape at a known rate; the operator calibrates the spectrometer
by comparing the measured escape rate with the standard.
The effectiveness of the detection system can best be checked
with calibrated leaks made of glass, which can be bought commer-
cially. These leaks can be built into a test unit and sent through the
normal leak detection cycles to evaluate the detection method’s
effectiveness. Ensure that the test leak site does not become closed;
the leakage rate of the test leak must be determined before and after
each system audit.
From a manufacturing standpoint, use of any leak detection
method should be secondary to leak prevention. Improper brazing
and welding techniques, unclean parts, untested sealing compounds
or improper fluxes and brazing materials, and poor-quality work re-
sult in leaks that occur in transit or later. Careful control and analysis
of each joint or leak point make it possible to concentrate tests on
areas where leaks are most likely to occur. If operators must scan
hundreds of joints on each unit, the probability of finding all leaks
is rather small, whereas concentration on a few suspect areas reduc-
es field failures considerably.
5. PERFORMANCE TESTING
Because there are many types and designs of refrigeration sys-
tems, this section only presents some specific information on com-
pressor testing and covers some important aspects of performance
testing of other components and complete systems.
Compressor Testing
The two prime considerations in compressor testing are power and
capacity. Secondary considerations are leakback rate, low-voltage
starting, noise, and vibration. The following are typical compressor
tests.
Testing Without Refrigerant. A number of tests measure com-
pressor power and capacity before the unit is exposed to refrigerant.
In cases where excessive power is caused by friction of running
gear, low-voltage tests spot defective units early in assembly. In
these tests, voltage is increased from a low or zero value to the value
that causes the compressor to break away, and this value is com-
pared with an established standard. When valves or valve plates are
accessible, the compressor can be tested by using an air pump for a
leakback. In this test, the air is put through the unit at fixed pressure
to determine the flow rate at which valves open. This flow rate is
then compared to an established standard. This method is effective
only when the valves are reasonably tight, and is difficult to use on
valves that must be run in before seating properly.
Take extreme care when using a compressor to pump air, because
the combination of oil, air, and high temperatures caused by com-
pression can result in a fire or explosion.
In a test using the compressor as an air pump, the discharge air-
flow is measured through a flowmeter, orifice, or other flow-measur-
ing device. Because air is compressed adiabatically in this test, the
discharge pressure must be low to prevent overheating of discharge
lines and oil oxidation if the test lasts longer than a few minutes. [The
discharge temperature of isentropic compression from ambient
condition is 140°C at 240 kPa (gage), but 280°C at 860 kPa (gage).]
When the compressor is run long enough to stabilize temperatures,
both power and flow can be compared with established limits. Dis-
charge temperature readings and speed measurements aid in analyz-
ing defective units. If a considerable amount of air is discharged or
trapped, the air used in the test must be dry enough to prevent con-
densation from causing rust or corrosion on the discharge side.
Another method of determining compressor performance re-
quires the compressor to pump from a free air inlet into a fixed vol-
ume. The time required to reach a given pressure is compared
against a maximum standard acceptable value. The pressure used in
this test is approximately 860 kPa (gage), so that a reasonable time
spread can be obtained. The time needed for measuring the com-
pressor’s capacity must be sufficient for accurate readings but short
enough to prevent overheating. Power readings can be recorded at
any time in the cycle. By shutting off the compressor, the leakback
rate can be measured as an additional check.](https://image.slidesharecdn.com/ashrae2018-refrigeration-230807180745-89f60944/85/ASHRAE-2018-REFRIGERATION-pdf-133-320.jpg)


![Licensed
for
single
user.
©
2018
ASHRAE,
Inc.
9.6 2018 ASHRAE Handbook—Refrigeration (SI)
resale; this information is generally not available for recycled refrig-
erant.
Purity Standards
AHRI Standard 700 discusses halocarbon refrigerants, regard-
less of source, and defines acceptable levels of contaminants, which
are the same as the Federal Specifications for Fluorocarbon Refrig-
erants BB-F-1421B [superseded by A-A-58060, Fluorocarbon and
Other Refrigerants (2005)]. It specifies laboratory analysis methods
for each contaminant. Only fully equipped laboratories with trained
personnel are presently capable of performing the analysis.
Because AHRI Standard 700 is based on chemical analysis of a
sample from each batch after removal, it is not concerned with the
level of contaminants before removal (Manz 1995). This difference
from the “standard contaminated refrigerant sample” required in
AHRI Standard 740 is the basic distinction between analysis/recla-
mation and certification/recycling.
SAE Standards J1991 and J2099 list recycled refrigerant purity
levels for mobile air-conditioning systems using R-12 and R-134a,
respectively.
REFERENCES
ASHRAE members can access ASHRAE Journal articles and
ASHRAE research project final reports at technologyportal.ashrae
.org. Articles and reports are also available for purchase by nonmem-
bersintheonlineASHRAEBookstoreat www.ashrae.org/bookstore.
AHRI. 2017. Specifications for fluorocarbon refrigerants. Standard 700.
Air-Conditioning, Heating, and Refrigeration Institute, Arlington, VA.
AHRI. 2016. Refrigerant recovery/recycling equipment. Standard 740. Air-
Conditioning, Heating, and Refrigeration Institute, Arlington, VA.
AHRI. 2015. Containers for recovered non-flammable fluorocarbon refrig-
erants. Guideline K. Air-Conditioning, Heating, and Refrigeration Insti-
tute, Arlington, VA.
AHRI. 2017. Assignment of refrigerant color containers. Guideline N. Air-
Conditioning, Heating, and Refrigeration Institute, Arlington, VA.
ASHRAE. 2013. Reducing the release of halogenated refrigerants from
refrigerating and air-conditioning equipment and systems. ANSI/
ASHRAE Standard 147-2013.
Clodic, D. 1997. Zero leaks. ASHRAE.
Clodic, D., and F. Sauer. 1994. The refrigerant recovery book. ASHRAE.
EPA.1996.Regulations governingsale of refrigerant. 61FR68505.U.S.Fed-
eral Register, U.S. Government Printing Office, Washington, D.C.
Kauffman, R.E. 1992. Chemical analysis and recycling of used refrigerant
from field systems. ASHRAE Transactions 98(1).
Manz, K.W. 1991. How to handle multiple refrigerants in recovery and recy-
cling equipment. ASHRAE Journal 33(4).
Manz, K.W. 1995. The challenge of recycling refrigerants. Business News
Publishing, Troy, MI.
Manz, K.W. 1996. Recycling alternate refrigerants R-404A, R-410A, and
R-507. Proceedings of the International Conference on Ozone Protec-
tion Technologies, Frederick, MD, pp. 411-419.
O’Meara, D.R. 1988. Operating experiences of a refrigerant recovery ser-
vices company. ASHRAE Transactions 94(2).
Parker, R.W. 1988. Reclaiming refrigerant in OEM plants. ASHRAE Trans-
actions 94(2).
RSES. 1991. Refrigerant service for the 90’s, 1st ed. Refrigeration Service
Engineers Society, Des Plaines, IL.
SAE. 2011. Standard of purity for use in mobile air-conditioning systems.
Standard J1991. Society of Automotive Engineers, Warrendale, PA.
SAE. 2012. Standard of purity for recycled R-134a (HFC-134a) and R-
1234yf (HFO-1234yf) for use in mobile air-conditioning systems. Stan-
dard J2099. Society of Automotive Engineers, Warrendale, PA.
BIBLIOGRAPHY
ASNT. 2017. Nondestructive testing handbook, vol. 2: Leak testing, 4th ed.
American Society for Nondestructive Testing, Columbus, OH.
Kauffman, R.E. 1993. Sealed-tube tests of refrigerants from field systems
before and after recycling. ASHRAE Transactions 99(2):414-424.
Manz, K.W. 1988. Recovery of CFC refrigerants during service and recy-
cling by the filtration method. ASHRAE Transactions 94(2):2145-2151.
McCain, C.A. 1991. Refrigerant reclamation protects HVAC equipment
investment. ASHRAE Journal 33(4).
Related Commercial Resources](https://image.slidesharecdn.com/ashrae2018-refrigeration-230807180745-89f60944/85/ASHRAE-2018-REFRIGERATION-pdf-141-320.jpg)


![Licensed
for
single
user.
©
2018
ASHRAE,
Inc.
Insulation Systems for Refrigerant Piping 10.5
• Cellular glass has excellent compressive strength, but it is rigid.
Density varies between 98 and 136 kg/m3, but does not greatly
affect thermal performance. It is fabricated for use on piping and
vessels. When installed on applications that are subject to exces-
sive vibration, the inner surface of the material may need to be
coated. The coefficient of thermal expansion for this material is
relatively close to that of carbon steel. When installed on refrig-
eration systems, provisions for expansion and contraction of the
insulation are usually only recommended for applications that
cycle from below-ambient to high temperatures. Cellular glass
has very low water vapor permeability and water absorption; see
information on vapor retarder systems in the section on Insulation
System Moisture Resistance.
• Flexible elastomerics are soft and flexible. This material is suit-
able for use on nonrigid tubing, and its density ranges from 48 to
136 kg/m3. Although vapor permeability can be as low as
0.146 ng/(s·Pa·m), this is still significantly higher than the per-
meance requirement for vapor retarders [1.14 ng/(s ·Pa·m2)]. For
this reason, in refrigeration piping, flexible elastomeric should be
used only with a vapor retarder applied to the exterior surface.
• Closed-cell phenolic foam insulation has a very low thermal con-
ductivity, and can provide the same thermal performance as other
insulations at a reduced thickness. Its density is 16 to 48 kg/m3.
This material also has low flammability.
• Polyisocyanurateinsulation has low thermal conductivity and ex-
cellent compressive strength. Density ranges from 29 to 96 kg/m3.
• Extruded polystyrene (XPS) insulation has good compressive
strength. Typical density range is 24 to 32 kg/m3.
Insulation Joint Sealant/Adhesive
All insulation materials that operate in below-ambient conditions
should be protected by a continuous vapor retarder system. Joint seal-
ants contribute to the effectiveness of this system. The sealant should
resist liquid water and water vapor, and should bond to the specific
insulation surface. The sealant should be applied at all seams, joints,
terminations, and penetrations to retard transfer of water and water
vapor into the system.
Vapor Retarders
Insulation materials should be protected by a continuous vapor
retarder system with a maximum permeance of 1.14 ng/(s ·Pa·m2),
either integral to the insulation or as a separate vapor retarder mate-
rial applied to the exterior surface of the insulation. At operating
temperatures below –18°C, strongly consider requiring the vapor
retarder to have a maximum permeance of 0.57 ng/(s·Pa·m2).
Service life of the insulation and pipe depends primarily on the
installed water vapor permeance of the system, comprised of the
permeance of the insulation, vapor retarders on the insulation, and
the sealing of all joints, seams, and penetrations. Therefore, the
vapor retarder must be free of discontinuities and unsealed
penetrations. It must be installed to allow expansion and contrac-
tion without compromising the vapor retarder’s integrity. The
Table 3 Cellular Glass Insulation Thickness for
Indoor Design Conditions, mm
(32°C Ambient Temperature, 80% Relative Humidity,
0.9 Emittance, 0 km/h Wind Velocity)
Nominal Pipe
Size, mm
Pipe Operating Temperature, °C
+4 –7 –18 –29 –40 –51 –62 –73
15 25 40 40 50 50 65 65 65
20 40 40 50 50 65 65 65 75
25 25 40 50 50 65 65 75 75
40 40 40 50 50 65 65 75 75
50 40 50 50 65 65 75 90 90
65 40 40 50 65 65 75 75 90
75 40 50 65 65 75 90 90 100
100 40 50 65 75 75 90 90 100
125 40 50 65 75 75 90 100 100
150 40 50 65 75 90 90 100 100
200 40 50 65 75 90 100 100 115
250 40 50 65 75 90 100 115 115
300 40 50 65 75 90 100 115 125
350 50 65 75 90 100 115 115 125
400 50 65 75 90 100 115 115 125
450 50 65 75 90 100 115 125 125
500 50 65 75 90 100 115 125 140
600 50 65 75 90 100 115 125 140
700 50 65 75 90 100 115 125 140
750 50 65 75 90 100 115 125 140
900 50 65 75 90 100 115 125 140
Vert Flat 50 65 90 100 115 125 150 165
Tk Top 50 65 90 100 115 125 150 165
Tk Bot. 50 65 90 100 115 125 150 165
Notes:
1. Insulation thickness shown is that required to prevent condensation on outside jacket
surface or limit heat gain to 25 W/m2, whichever thickness is greater, at the condi-
tions specified.
2. Thicknesses shown are applicable only to the conditions specified. Changing any
condition, even slightly, can influence the required thickness.
3. All thicknesses are in millimetres.
4. Values do not include safety factor. Actual operating conditions may vary. Consult a
design engineer for appropriate recommendation for the specific system.
5. Thickness calculated using ASTM Standard C680-14 methodology.
Table 4 Cellular Glass Insulation Thickness for
Outdoor Design Conditions, mm
(38°C Ambient Temperature, 94% Relative Humidity,
0.1 Emittance, 12 km/h Wind Velocity)
NominalPipe
Size, mm
Pipe Operating Temperature, °C
+4 –7 –18 –29 –40 –51 –62 –73
15 40 40 50 65 65 65 75 75
20 40 50 50 65 65 75 75 90
25 40 50 50 65 75 90 90 100
40 40 50 65 65 75 90 100 100
50 50 65 75 75 90 100 115 125
65 40 50 65 75 90 100 115 125
75 50 65 75 90 100 115 125 140
100 65 75 90 100 115 125 140 150
125 65 75 100 115 125 140 150 165
150 65 90 100 115 125 150 165 180
200 65 90 115 125 140 165 180 190
250 75 100 115 140 150 180 190 205
300 75 100 125 150 165 190 205 215
350 90 115 140 150 180 190 215 230
400 90 115 140 165 180 205 230 240
450 90 125 140 165 190 215 230 255
500 100 125 150 180 205 215 240 255
600 100 125 150 190 205 230 255 280
700 100 140 165 190 215 240 265 290
750 115 140 165 190 230 240 265 290
900 115 150 180 205 230 255 280 305
Vert Flat 180 240 290 345 395 445 495 >510
Tk Top 190 240 290 345 395 445 495 >510
Tk Bot. 180 240 290 345 395 445 495 >510
Notes:
1. Insulation thickness shown is that required to prevent condensation on outside jacket
surface or limit heat gain to 25 W/m2, whichever thickness is greater, at the condi-
tions specified.
2. Thicknesses shown are applicable only to the conditions specified. Changing any
condition, even slightly, can influence the required thickness.
3. All thicknesses are in millimetres.
4. Values do not include safety factor. Actual operating conditions may vary. Consult a
design engineer for appropriate recommendation for the specific system.
5. Thickness calculated using ASTM Standard C680-14 methodology.](https://image.slidesharecdn.com/ashrae2018-refrigeration-230807180745-89f60944/85/ASHRAE-2018-REFRIGERATION-pdf-146-320.jpg)
![Licensed
for
single
user.
©
2018
ASHRAE,
Inc.
10.6 2018 ASHRAE Handbook—Refrigeration (SI)
manufacturer should have specific design and installation instruc-
tions for their products.
Separate vapor retarder materials can be categorized into the
following types:
• Laminate material vapor retarders consist of multiple layers of
polymer film and aluminum foil laminated to one another and
may also include reinforcing layers. This type is applied to the
outer surface of the insulation by the manufacturer or fabricator,
or in the field. Flat pieces of this material without any joints have
a water vapor permeance of 0 ng/(s·Pa·m2). This type has longi-
tudinal and butt joints, so achieving a low system permeance
depends on complete sealing of all joints and seams. Joints may
be sealed with an adhesive applied to both overlapping surfaces,
double-sided tape applied between two overlapping surfaces, or a
single-sided tape applied over the joint between two mating sur-
faces. Manufacturers’ instructions must be strictly followed
during the installation. Materials in this category must be compli-
ant with ASTM Standard C1775.
• All-service jacket (ASJ) vapor retarders are applied to the insu-
lation surface by the manufacturer, fabricator, or in the field. This
type of jacket has a low water vapor permeance under ideal condi-
tions [1.14 ng/(s·Pa·m2)]. These jackets have longitudinal joints
and butt joints, so achieving low permeance depends on complete
sealing of all joints and seams. Joints may be sealed with an adhe-
sive applied to both overlapping surfaces, double-sided tape ap-
plied between two overlapping surfaces, or a single-sided tape
applied over the joint between two mating surfaces. Manufactur-
ers’ instructions must be strictly followed during installation.
Metal jacketing may damage ASJ jacketing, so use extra care
when installing these together.
There are two types of ASJ vapor retarder. The traditional ASJ
material has been available for many years and consists of lami-
nated white paper, reinforcing glass fiber scrim, and aluminum
foil. In plasticized ASJ (pASJ), the paper layer is either replaced
by or encapsulated by plastic. The traditional ASJ with exposed
paper has service limitations on below-ambient systems in humid
environments, such as those commonly encountered by insulation
systems on refrigerant piping. In such situations, condensation
can occur more frequently on the insulation’s outer surface (e.g.,
when relative humidity exceeds 90%). The moisture-sensitive
nature of paper and the relative frailty of uncoated aluminum foil
can be problematic in the potentially high-humidity environment
of unconditioned spaces with below-ambient applications. Expo-
sure to water, either from condensation or from ambient sources,
can cause degradation and distortion of the paper, higher likeli-
hood of mold growth, and aluminum foil corrosion, leading to
vapor retarder failure. The presence of leachable chloride can pro-
mote corrosion of the foil. With pASJ, the lack of exposed paper
may reduce these concerns, but the layer of aluminum foil provid-
ing the vapor-retarding performance is still very thin and fragile.
Also, cut edges expose any paper present, which could lead to
wicking of water through this exposed paper into the interior of
the pASJ.
Traditional ASJ vapor retarder with exposed paper is not
recommended for use in refrigerant piping applications, re-
gardless of pipe temperature or ambient environment. Plasti-
cized ASJ could be acceptable in HVAC applications (see Chapter
Table 5 Flexible Elastomeric Insulation Thickness for
Indoor Design Conditions, mm
(32°C Ambient Temperature, 80% Relative Humidity,
0.9 Emittance, 0 km/h Wind Velocity)
Nominal Pipe
Size, mm
Pipe Operating Temperature, °C
+4 –7 –18 –29 –40 –51 –62 –73
15 25 40 40 50 50 65 65 65
20 40 40 50 50 65 65 65 65
25 25 40 50 50 65 65 65 75
40 40 40 50 50 50 65 65 75
50 40 40 50 65 65 75 75 90
65 40 40 50 50 65 65 75 75
75 40 50 50 65 75 75 90 90
100 40 50 65 65 75 75 90 100
125 40 50 65 65 75 90 90 100
150 40 50 65 75 75 90 90 100
200 40 50 65 75 75 90 100 100
250 40 50 65 75 90 100 100 115
300 40 50 65 75 90 100 100 115
350 40 50 65 75 90 100 115 115
400 40 50 65 75 90 100 115 125
450 40 50 75 90 90 100 115 125
500 40 65 75 90 100 100 115 125
600 40 65 75 90 100 115 115 125
700 40 65 75 90 100 115 125 125
750 40 65 75 90 100 115 125 125
900 40 65 75 90 100 115 125 140
Vert Flat 50 65 75 90 115 125 140 150
Tk Top 40 65 75 90 115 125 140 150
Tk Bot. 50 65 75 90 115 125 140 150
Notes:
1. Insulation thickness shown is that required to prevent condensation on outside jacket
surface or limit heat gain to 25 W/m2, whichever thickness is greater, at the condi-
tions specified.
2. Thicknesses shown are applicable only to the conditions specified. Changing any
condition, even slightly, can influence the required thickness.
3. All thicknesses are in millimetres.
4. Values do not include safety factor. Actual operating conditions may vary. Consult a
design engineer for appropriate recommendation for the specific system.
5. Thickness calculated using ASTM Standard C680-14 methodology.
Table 6 Flexible Elastomeric Insulation Thickness for
Outdoor Design Conditions, mm
(38°C Ambient Temperature, 94% Relative Humidity,
0.1 Emittance, 12 km/h Wind Velocity.)
Nominal Pipe
Size, mm
Pipe Operating Temperature, °C
+4 –7 –18 –29 –40 –51 –62 –73
15 40 40 50 50 65 65 65 75
20 40 50 50 65 65 65 75 90
25 40 40 50 65 65 75 90 90
40 40 50 50 65 75 90 90 100
50 40 50 65 75 90 100 100 115
65 40 50 65 75 90 100 100 115
75 50 65 75 90 100 115 125 125
100 50 65 75 100 115 115 125 140
125 65 75 90 100 115 125 140 150
150 65 75 90 115 125 140 150 165
200 65 90 100 115 140 150 165 180
250 75 90 115 125 150 165 180 190
300 75 100 115 140 150 180 190 205
350 75 100 125 140 165 180 205 215
400 90 100 125 150 180 190 205 230
450 90 115 140 150 180 205 215 230
500 90 115 140 165 190 205 230 240
600 90 125 150 180 190 215 240 255
700 100 125 150 180 205 230 255 265
750 100 125 150 180 205 230 255 280
900 100 140 165 190 215 240 265 290
Vert Flat 165 215 265 320 370 420 455 495
Tk Top 165 215 265 320 370 420 455 495
Tk Bot. 165 215 265 320 370 420 455 495
Notes:
1. Insulation thickness shown is that required to prevent condensation on outside jacket
surface or limit heat gain to 25 W/m2, whichever thickness is greater, at the condi-
tions specified.
2. Thicknesses shown are applicable only to the conditions specified. Changing any
condition, even slightly, can influence the required thickness.
3. All thicknesses are in millimetres.
4. Values do not include safety factor. Actual operating conditions may vary. Consult a
design engineer for appropriate recommendation for the specific system.
5. Thickness calculated using ASTM Standard C680-14 methodology.](https://image.slidesharecdn.com/ashrae2018-refrigeration-230807180745-89f60944/85/ASHRAE-2018-REFRIGERATION-pdf-147-320.jpg)


![Licensed
for
single
user.
©
2018
ASHRAE,
Inc.
Refrigerant Control Devices 11.5
3. CONTROL VALVES
Control valves are used to start, stop, direct, and modulate refrig-
erant flow to satisfy system requirements in accordance with load
requirements. To ensure satisfactory performance, valves should be
protected from foreign material, excessive moisture, and corrosion
by properly sized strainers, filters, and/or filter-driers.
3.1 THERMOSTATIC EXPANSION VALVES
The thermostatic expansion valve controls the flow of liquid
refrigerant entering the evaporator in response to the superheat of
gas leaving the evaporator. It keeps the evaporator active without
allowing liquid to return through the suction line to the compressor.
This is done by controlling the mass flow of refrigerant entering the
evaporator so it equals the rate at which it can be completely vapor-
ized in the evaporator by heat absorption. Because this valve is
operated by superheat and responds to changes in superheat, a por-
tion of the evaporator must be used to superheat refrigerant gas.
Unlike the constant-pressure valve, the thermostatic expansion
valve is not limited to constant-load applications. It is used for con-
trolling refrigerant flow to all types of direct-expansion evaporators
in air-conditioning and in commercial (medium-temperature), low-
temperature, and ultralow-temperature refrigeration applications.
Operation
Figure 10 shows a schematic cross section of a typical thermo-
static expansion valve, with the principal components identified.
The following pressures and their equivalent forces govern thermo-
static expansion valve operation:
P1 = pressure of thermostatic element (a function of bulb’s
charge and temperature), which is applied to the top of
diaphragm and acts to open valve
P2 = evaporator pressure, which is applied under the diaphragm
through an equalizer passage and acts to close valve
P3 = pressure equivalent of superheat spring force, which is
applied underneath the diaphragm and is also a closing
force
At any constant operating condition, these pressures (forces) are
balanced and P1 = P2 + P3.
An additional force, which is small and not considered funda-
mental, arises from the pressure differential across the valve port. To
a degree, it can affect thermostatic expansion valve operation. For
the configuration shown in Figure 10, the force resulting from port
imbalance is the product of pressure drop across the port and the
area of the port; it is an opening force in this configuration. In other
designs, depending on the direction of flow through the valve, port
imbalance may result in a closing force.
The principal effect of port imbalance is on the stability of valve
control. As with any modulating control, if the ratio of the dia-
phragm area to the port is kept large, the unbalanced port effect is
minor. However, if this ratio is small or if system operating condi-
tions require, a balanced port valve can be used. Figure 11 shows a
typical balanced port design.
Figure 12 shows an evaporator operating with R-410A at a satu-
ration temperature of 4°C [814 kPa (gage)]. Liquid refrigerant
enters the expansion valve, is reduced in pressure and temperature at
the valve port, and enters the evaporator at point A as a mixture of
saturated liquid and vapor. As flow continues through the evapora-
tor, more of the refrigerant is evaporated. Assuming there is no pres-
sure drop, the refrigerant temperature remains at 4°C until the liquid
is entirely evaporated at point B. From this point, additional heat
absorption increases the temperature and superheats the refrigerant
gas, while the pressure remains constant at 814 kPa, until, at point C
(the evaporator’s outlet), the refrigerant gas temperature is 10°C. At
this point, the superheat is 6 K (10 – 4°C).
An increased heat load on the evaporator increases the tempera-
ture of refrigerant gas leaving the evaporator. The bulb of the valve
senses this increase, and the thermostatic charge pressure P1 in-
creases and causes the valve to open wider. The increased flow re-
sults in a higher evaporator pressure P2, and a balanced control point
is again established. Conversely, decreased heat load on the evapo-
rator decreases the temperature of refrigerant gas leaving the evapo-
rator and causes the thermostatic expansion valve to start closing.
The new control point, after an increase in valve opening, is at a
slightly higher operating superheat because of the spring rate of the
diaphragm and superheat spring. Conversely, decreased load results
Fig. 9 Capacitance Probe in (A) Vertical Receiver and (B)
Auxiliary Level Column
Fig. 10 Typical Thermostatic Expansion Valve](https://image.slidesharecdn.com/ashrae2018-refrigeration-230807180745-89f60944/85/ASHRAE-2018-REFRIGERATION-pdf-158-320.jpg)


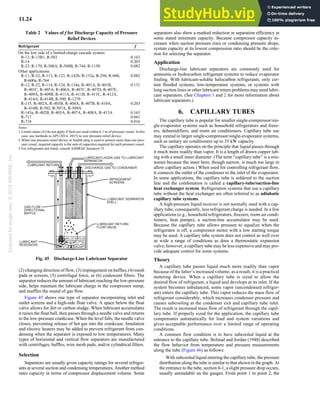


![Licensed
for
single
user.
©
2018
ASHRAE,
Inc.
12.2 2018 ASHRAE Handbook—Refrigeration (SI)
The Falex pin and V-block method (ASTM Standard D2670)
allows wear measurement during the test itself, and scar width on
the V-blocks and/or mass loss of the pin is used to measure antiwear
properties. Load-carrying capability can also be measured by fail-
ure (ASTM Standard D3233), which can be caused by excess wear
or extreme frictional resistance.
The Timken method (ASTM Standard D2782) determines the
load at which rupture of the lubricant film occurs, and the Alpha
LFW-1 machine (Falex block-on-ring tester; ASTM Standard
D2714) measures frictional force and wear.
The FZG gear test method (ASTM Standard D5182) [Institute
for Machine Elements Gear Research Centre (FZG), Technical Uni-
versity of Munich] provides useful information on how a lubricant
performs in a gear box. Specific applications include gear-driven
centrifugal compressors in which lubricant dilution by refrigerant is
expected to be quite low.
However, because all these machines operate in air, available
data may not apply to a refrigerant environment. Divers (1958)
questioned the validity of tests in air, because several oils that per-
formed poorly in Falex testing have been used successfully in re-
frigerant systems. Murray et al. (1956) suggest that halocarbon
refrigerants can aid in boundary lubrication. R-12, for example,
when run hot in the absence of oil, reacted with steel surfaces to
form a lubricating film. Jonsson and Hoglund (1993) showed that
the presence of refrigerant lowers both the viscosity and pressure-
viscosity coefficient of the lubricant, and thus the film thickness
under EHL conditions. These studies emphasize the need for labo-
ratory testing in a simulated refrigerant environment.
In Huttenlocher’s (1969) simulation method, refrigerant vapor
is bubbled through the lubricant reservoir both before the test to
displace the dissolved air, and continually during the test to main-
tain a blanket of refrigerant on the lubricant surface. Using the
Falex tester, Huttenlocher showed the beneficial effect of R-22 on
the load-carrying capability of the same lubricant compared with
air or nitrogen. Sanvordenker and Gram (1974) describe a further
modification of the Falex test using a sealed sample system.
Both R-12 (a CFC) and R-22 (an HCFC) atmospheres improved
a lubricant’s boundary lubrication characteristics when compared
with tests in air. HFC refrigerants, which are chlorine-free, contrib-
ute to increased wear, compared to a chlorinated refrigerant with the
same lubricant.
Komatsuzaki and Homma (1991) used a modified four-ball tester
to determine antiseizure and antiwear properties of R-12 and R-22 in
mineral oil and R-134a in a propylene glycol. Davis and Cusano
(1992) used a high-pressure tribometer (HPT) fitted with a high-
pressure chamber up to 1.72 MPa to determine friction and wear of
R-22 in mineral oil and alkylbenzene, and R-134a in polyalkylene
glycol and pentaerythritol polyesters. Muraki et al. (2002) found
greater breakdown of fluorinated ether (HFC-245mc) compared to
R-134a, using x-ray photoelectron spectroscopy (XPS) to study sur-
face films generated in a ball-on-ring tribometer under boundary
conditions. Films that form as a result of refrigerant degradation pro-
vide greater protection against wear and friction compared to appli-
cations where the films are not formed. Nunez et al. (2008) used an
HPT in a pin-on-disk configuration under a constant 1.4 MPa pres-
ence of CO2; XPS analysis showed that interactions between CO2
and moisture in PAG lubricants formed carbonate layers.
Advanced surface analyses (e.g., XPS) in the presence of refrig-
erants can lead to a good understanding and correlation of lubrica-
tion performance. Care must be taken, however, to include test
parameters that are as close as possible to the actual hardware envi-
ronments, such as base material from which test specimens are
made, their surface condition, processing methods, and operating
temperature. There are several bearings or rubbing surfaces in a
refrigerant compressor, each of which may use different materials
and may operate under different conditions. A different test may be
required for each bearing. Moreover, bearings in hermetic compres-
sors have very small clearances. Permissible bearing wear is mini-
mal because wear debris remains in the system and can cause other
problems even if clearances stay within working limits. Compressor
system mechanics must be understood to perform and interpret sim-
ulated tests.
Some aspects of compressor lubrication are not suitable for labo-
ratory simulation. For instance, return of liquid refrigerant to the
compressor can cause lubricant to dilute or wash away from the bear-
ings, creating conditions of boundary lubrication. Tests using oper-
ating refrigerant compressors have also been considered (e.g., DIN
Standard 8978). The test is functional for a given compressor system
and may allow comparison of lubricants within that class of com-
pressors. However, it is not designed to be a generalized test for the
boundary lubricating capability of a lubricant. Other tests using
radioactive tracers in refrigerant systems have given useful results
(Rembold and Lo 1966).
Although most boundary lubrication testing is performed at or
near atmospheric pressure, testing some refrigerants at atmospheric
pressures yields less meaningful results. Atmospheric or low-
pressure sealed operation with refrigerant bubbled through the lubri-
cant during the test has yielded positive results for refrigerants with
a normal evaporation pressure within 1 MPa of the testing pressure
under the normal compressor operating temperature range. Refriger-
ants that operate at high pressure, such as CO2, and zeotropic refrig-
erant blends, such as R-410A, require testing at near-operation
elevated test pressures.
2. REFRIGERATION LUBRICANT
REQUIREMENTS
Regardless of size or system application, refrigerant compres-
sors are classified as either positive-displacement or dynamic. Both
function to increase the pressure of the refrigerant vapor. Positive-
displacement compressors increase refrigerant pressure by reducing
the volume of a compression chamber through work applied to the
mechanism (scroll, reciprocating, rotary, and screw). In contrast,
dynamic compressors increase refrigerant pressure by continuous
transfer of angular momentum from the rotating member. As the gas
decelerates, the imparted momentum is converted into a pressure
rise. Centrifugal compressors function based on these principles.
Refrigerant compressors require lubricant to do more than sim-
ply lubricate bearings and mechanism elements. Oil delivered to the
mechanism serves as a barrier that separates gas on the discharge
side from gas on the suction side. Oil also acts as a coolant, trans-
ferring heat from the bearings and mechanism elements to the
crankcase sump, which, in turn, transfers heat to the surroundings.
Moreover, oil helps reduce noise generated by moving parts inside
the compressor. Generally, the higher the lubricant’s viscosity, the
better the sealing and noise reduction capabilities.
A hermetic system, in which the motor is exposed to the lubricant,
requires a lubricant with electrical insulating properties. Refrigerant
gas normally carries some lubricant with it as it flows through the
condenser, flow control device, and evaporator. This lubricant must
return to the compressor in a reasonable time and must have adequate
fluidity at low temperatures. It must also be free of suspended matter
or components such as wax that might clog the flow control device or
deposit in the evaporator and adversely affect heat transfer. In a her-
metic system, the lubricant is typically charged only once, so it must
function for the compressor’s lifetime. The chemical stability re-
quired of the lubricant in the presence of refrigerants, metals, motor
insulation, and extraneous contaminants is perhaps the most import-
ant characteristic distinguishing refrigeration lubricants from those
used for all other applications (see Chapter 6).
Although compression components of centrifugal compressors
require no internal lubrication, rotating shaft bearings, seals, and](https://image.slidesharecdn.com/ashrae2018-refrigeration-230807180745-89f60944/85/ASHRAE-2018-REFRIGERATION-pdf-189-320.jpg)


![Licensed
for
single
user.
©
2018
ASHRAE,
Inc.
Lubricants in Refrigerant Systems 12.5
The viscosity grade of refrigeration lubricants is most often
defined by the kinematic viscosity at 40°C ± 10% (ISO viscosity
grade), but the viscosity scale of PAOs is usually designated by
kinematic viscosity at 100°C. Representative oligomer composi-
tions for various viscosity grades are shown in Table 2, where both
viscosity grades are correlated.
Polyol Esters (POE)
Esters are manufactured by the reaction of a carboxylic acid with
an alcohol:
(1)
The predominant esters used for refrigeration applications are the
neopentyl polyol esters. Neopentyl esters [polyol esters (POEs)] are
derived from a reaction between a neopentyl polyol (usually pen-
taerythritol, trimethylolpropane, or neopentyl glycol) and a linear or
branched carboxylic acid. For higher viscosities, a dipentaerythritol
is often used. Acids are usually selected to give the correct viscosity
and fluidity at low temperatures along with suitable miscibility per-
formance with the refrigerant. Complex polyol esters are derived by
a sequential reaction of the polyol with a dibasic acid followed by
reaction with mixed monoacids (Short 1990). This results in lubri-
cants with a higher relative molecular mass, high viscosity indices,
and higher ISO viscosity grades. Polyol ester lubricants are used
commercially with HFC refrigerants in all types of compressors, as
well as with single-component HFO refrigerants, including R-1234yf
and R-1234ze(E), and refrigerant blends containing HFOs.
Polyol esters are favored in refrigeration applications because
they have greater thermal stability than other types of esters. The
improved thermal stability is derived from the chemical structure of
the alcohol used in the synthesis of the ester. Normal esters are pre-
pared with branched or linear alcohols that contain a hydrogen atom
attached to the beta carbon (i.e., the carbon adjacent to the one pos-
sessing the alcohol group). This hydrogen can undergo an intramo-
lecular reaction with the oxygen atoms of the ester at high
temperature to form an olefin and a carboxylic acid:
(2a)
Neopentyl polyols are a specific group of alcohols that do not
contain a hydrogen attached to the beta carbon of the alcohol group,
and thus the mechanism for high-temperature thermal rearrange-
ment is eliminated:
(2b)
Commercially relevant neopentyl polyols used in the manufac-
ture of refrigeration lubricants are shown in Figure 4.
The most common carboxylic acids used to make POE refriger-
ation lubricants are shown in Table 3 and represent a range of C5 to
C10 linear and branched acids.
Table 2 Typical Physical Properties and Composition of PAO
Lubricants
PAO 4 PAO 6 PAO 8 PAO 10
ISO viscosity grade 16 32 46 68
Kinematic viscosity at 40°C, mm2/s 16.7 30.9 46.3 64.5
Kinematic viscosity at 100°C, mm2/s 3.8 6.0 7.7 9.9
Viscosity index 124 143 136 137
Decene oligomer composition, %
Dimer 0.6 0.1 0 0
Trimer 84.4 33.9 6.0 1.1
Tetramer 14.5 43.5 55.7 42.5
Pentamer 0.5 17.4 27.2 32.3
Table 3 Carboxylic Acids Commonly Used in the Manufacture of Polyol Ester Refrigeration Lubricants
Number of
Carbons Linear Branched
5
Valeric Acid 2-Methylbutanoic Acid
7
n-Heptanoic Acid
8
n-Octanoic Acid 2-Ethylhexanoic Acid
9
3,5,5-Trimethylhexanoic Acid
10
n-Decanoic Acid](https://image.slidesharecdn.com/ashrae2018-refrigeration-230807180745-89f60944/85/ASHRAE-2018-REFRIGERATION-pdf-192-320.jpg)


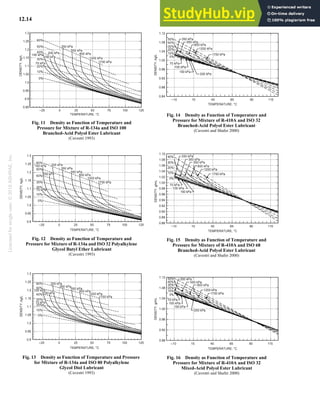


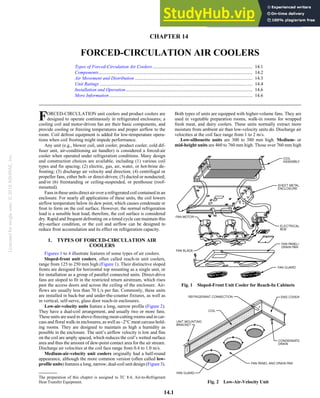


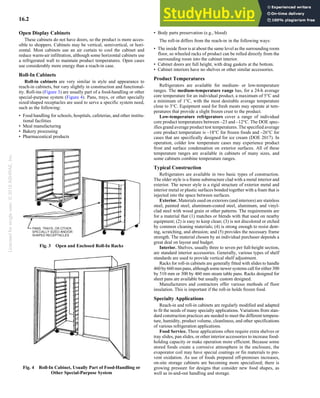


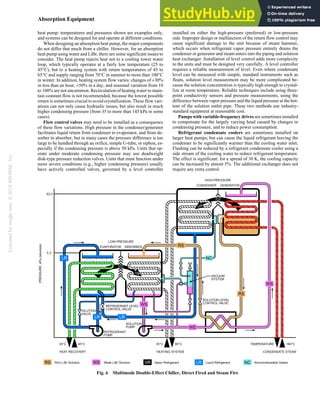


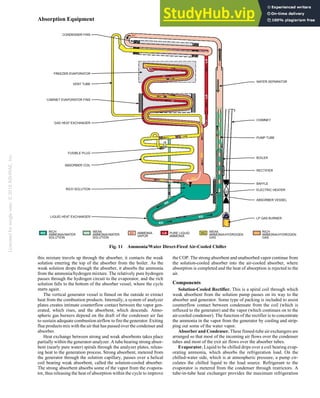


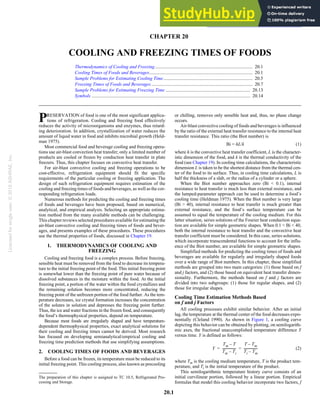


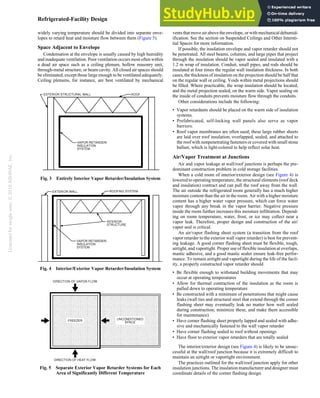


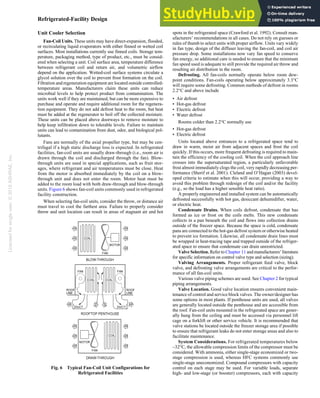


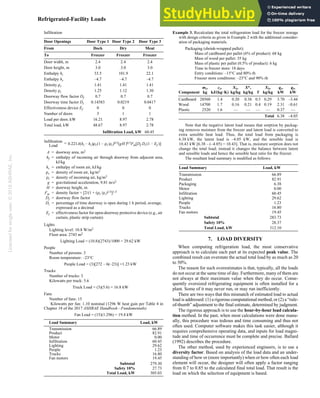


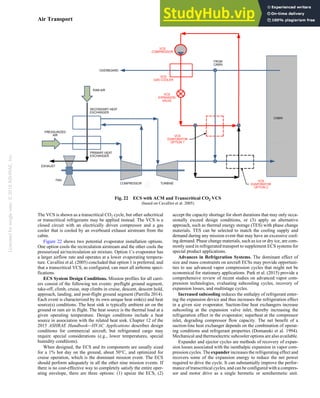


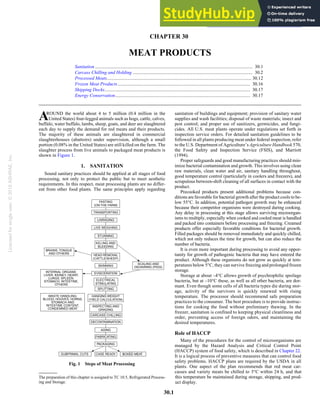


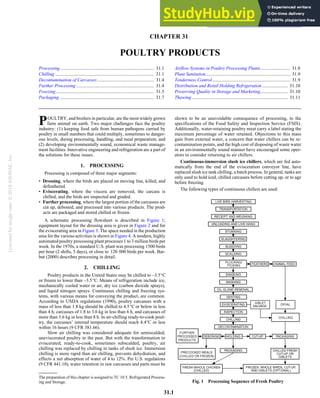


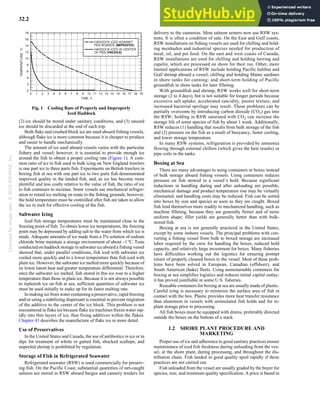


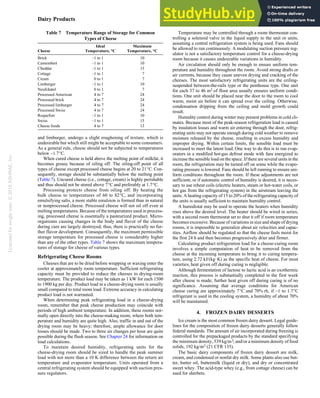


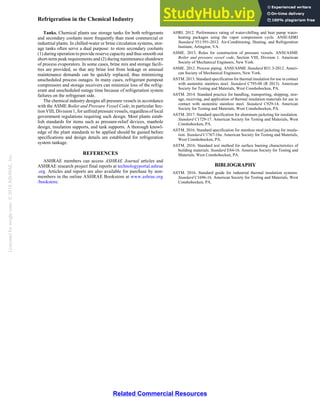


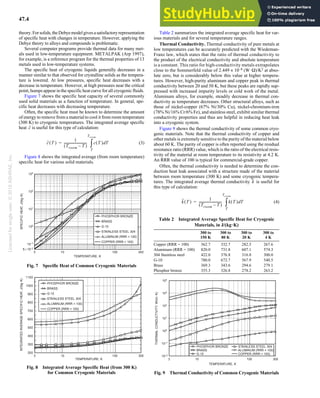


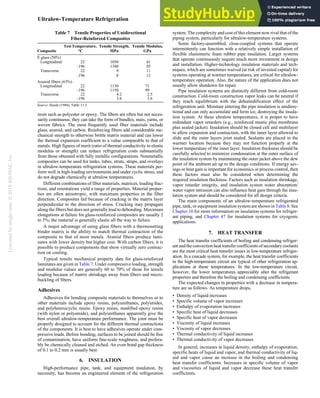


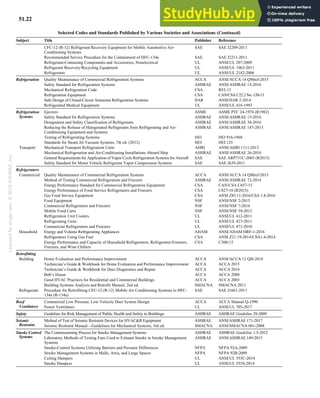


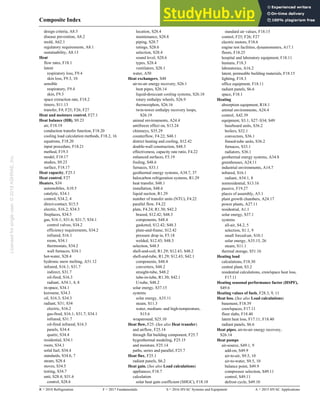


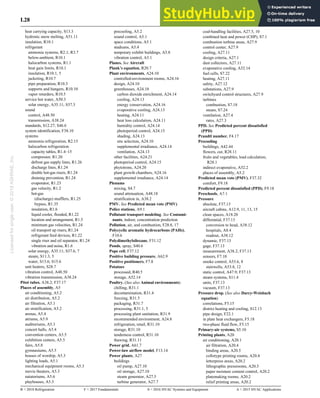


This document is the 2018 ASHRAE Handbook: Refrigeration which is copyrighted and for single user use only. It was published by ASHRAE and contains 51 chapters on refrigeration systems and applications. No part of the publication can be reproduced without permission from ASHRAE. Volunteer members of ASHRAE Technical Committees compiled the information which is generally reviewed and updated every four years with comments, criticisms, and suggestions invited.