Download as PDF, PPTX

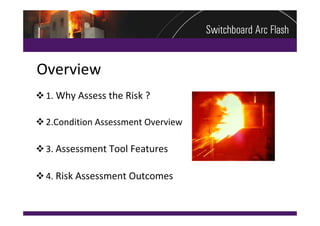
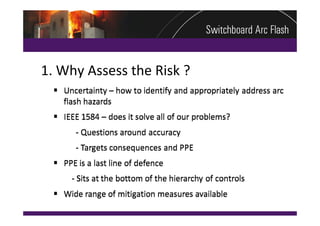
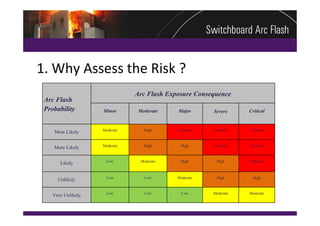

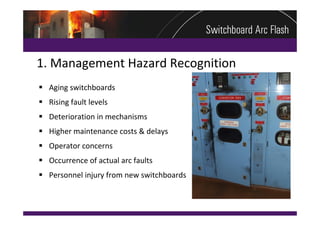
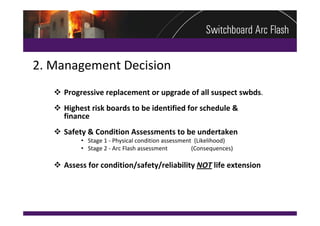
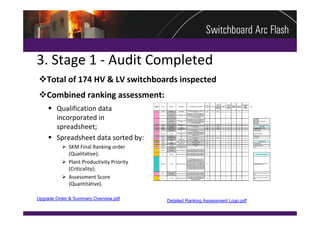
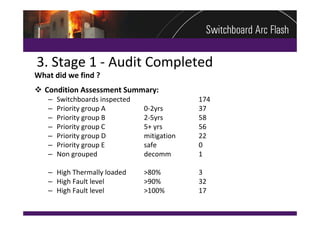
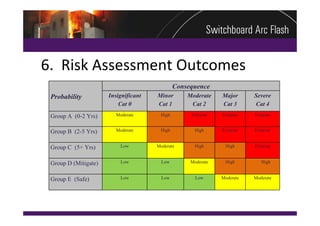

This document summarizes a practical arc flash risk assessment strategy conducted on 174 high and low voltage switchboards at a mining site. The assessment included a physical condition assessment to determine the likelihood of arc faults occurring, and an arc flash evaluation to determine the consequences of arc faults. The results were combined into a risk matrix to prioritize upgrade and mitigation efforts. The assessment found 37 switchboards requiring replacement within 2 years and 58 requiring replacement within 5 years based on their poor condition and increased risk.